


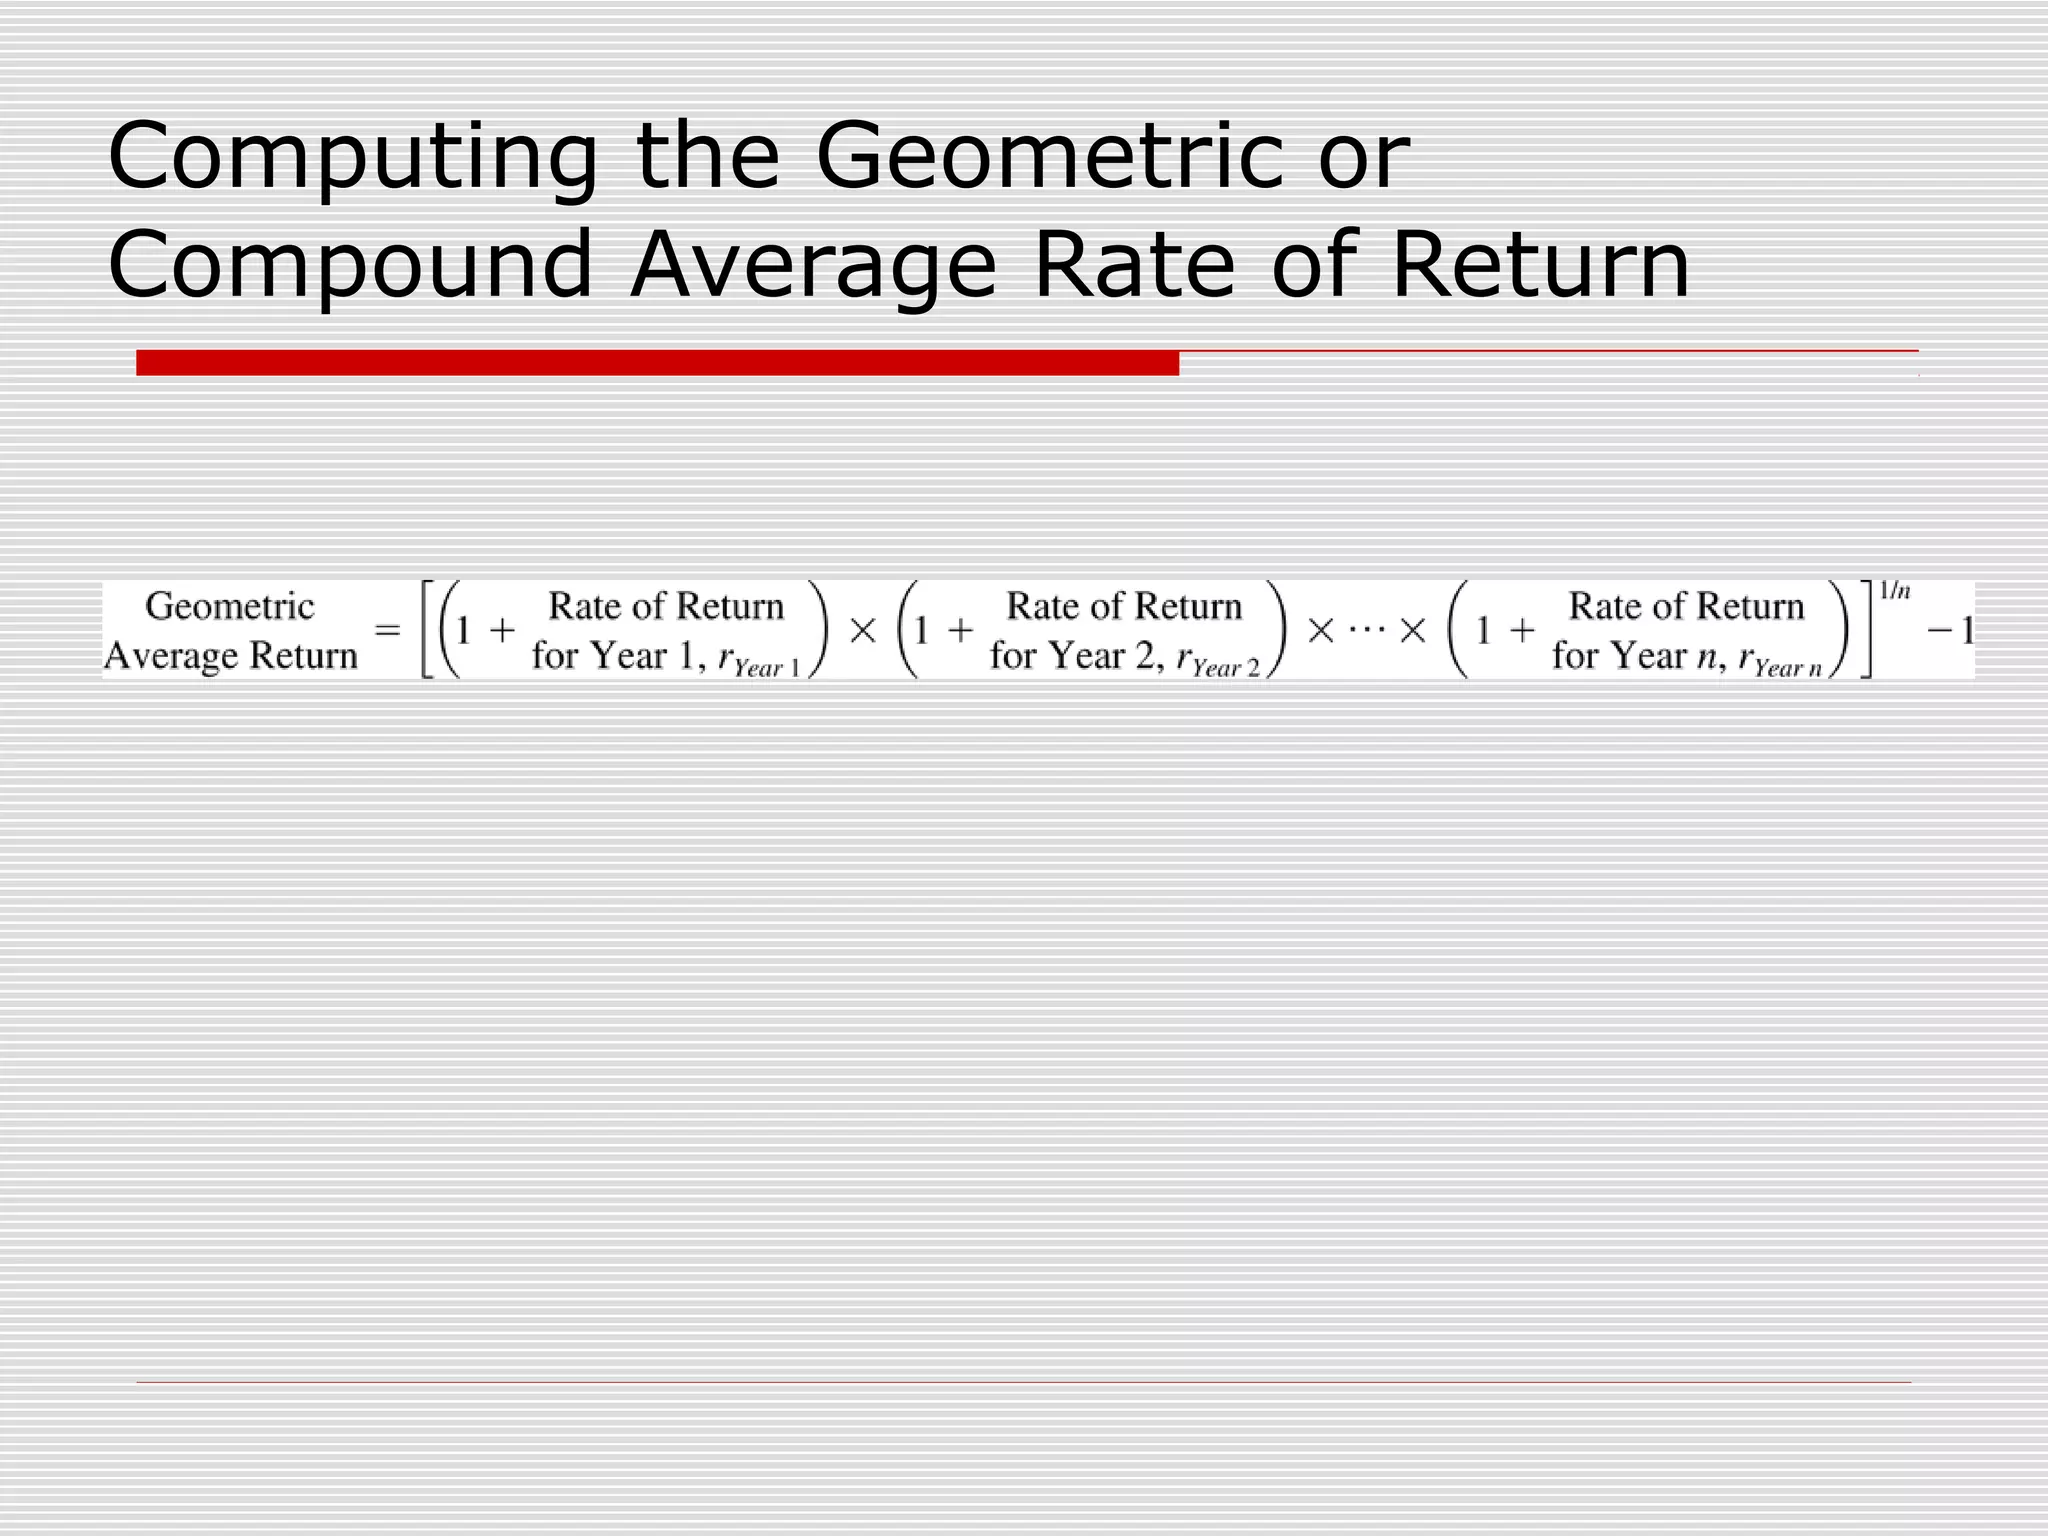
![Computing the Geometric or
Compound Average Rate of Return
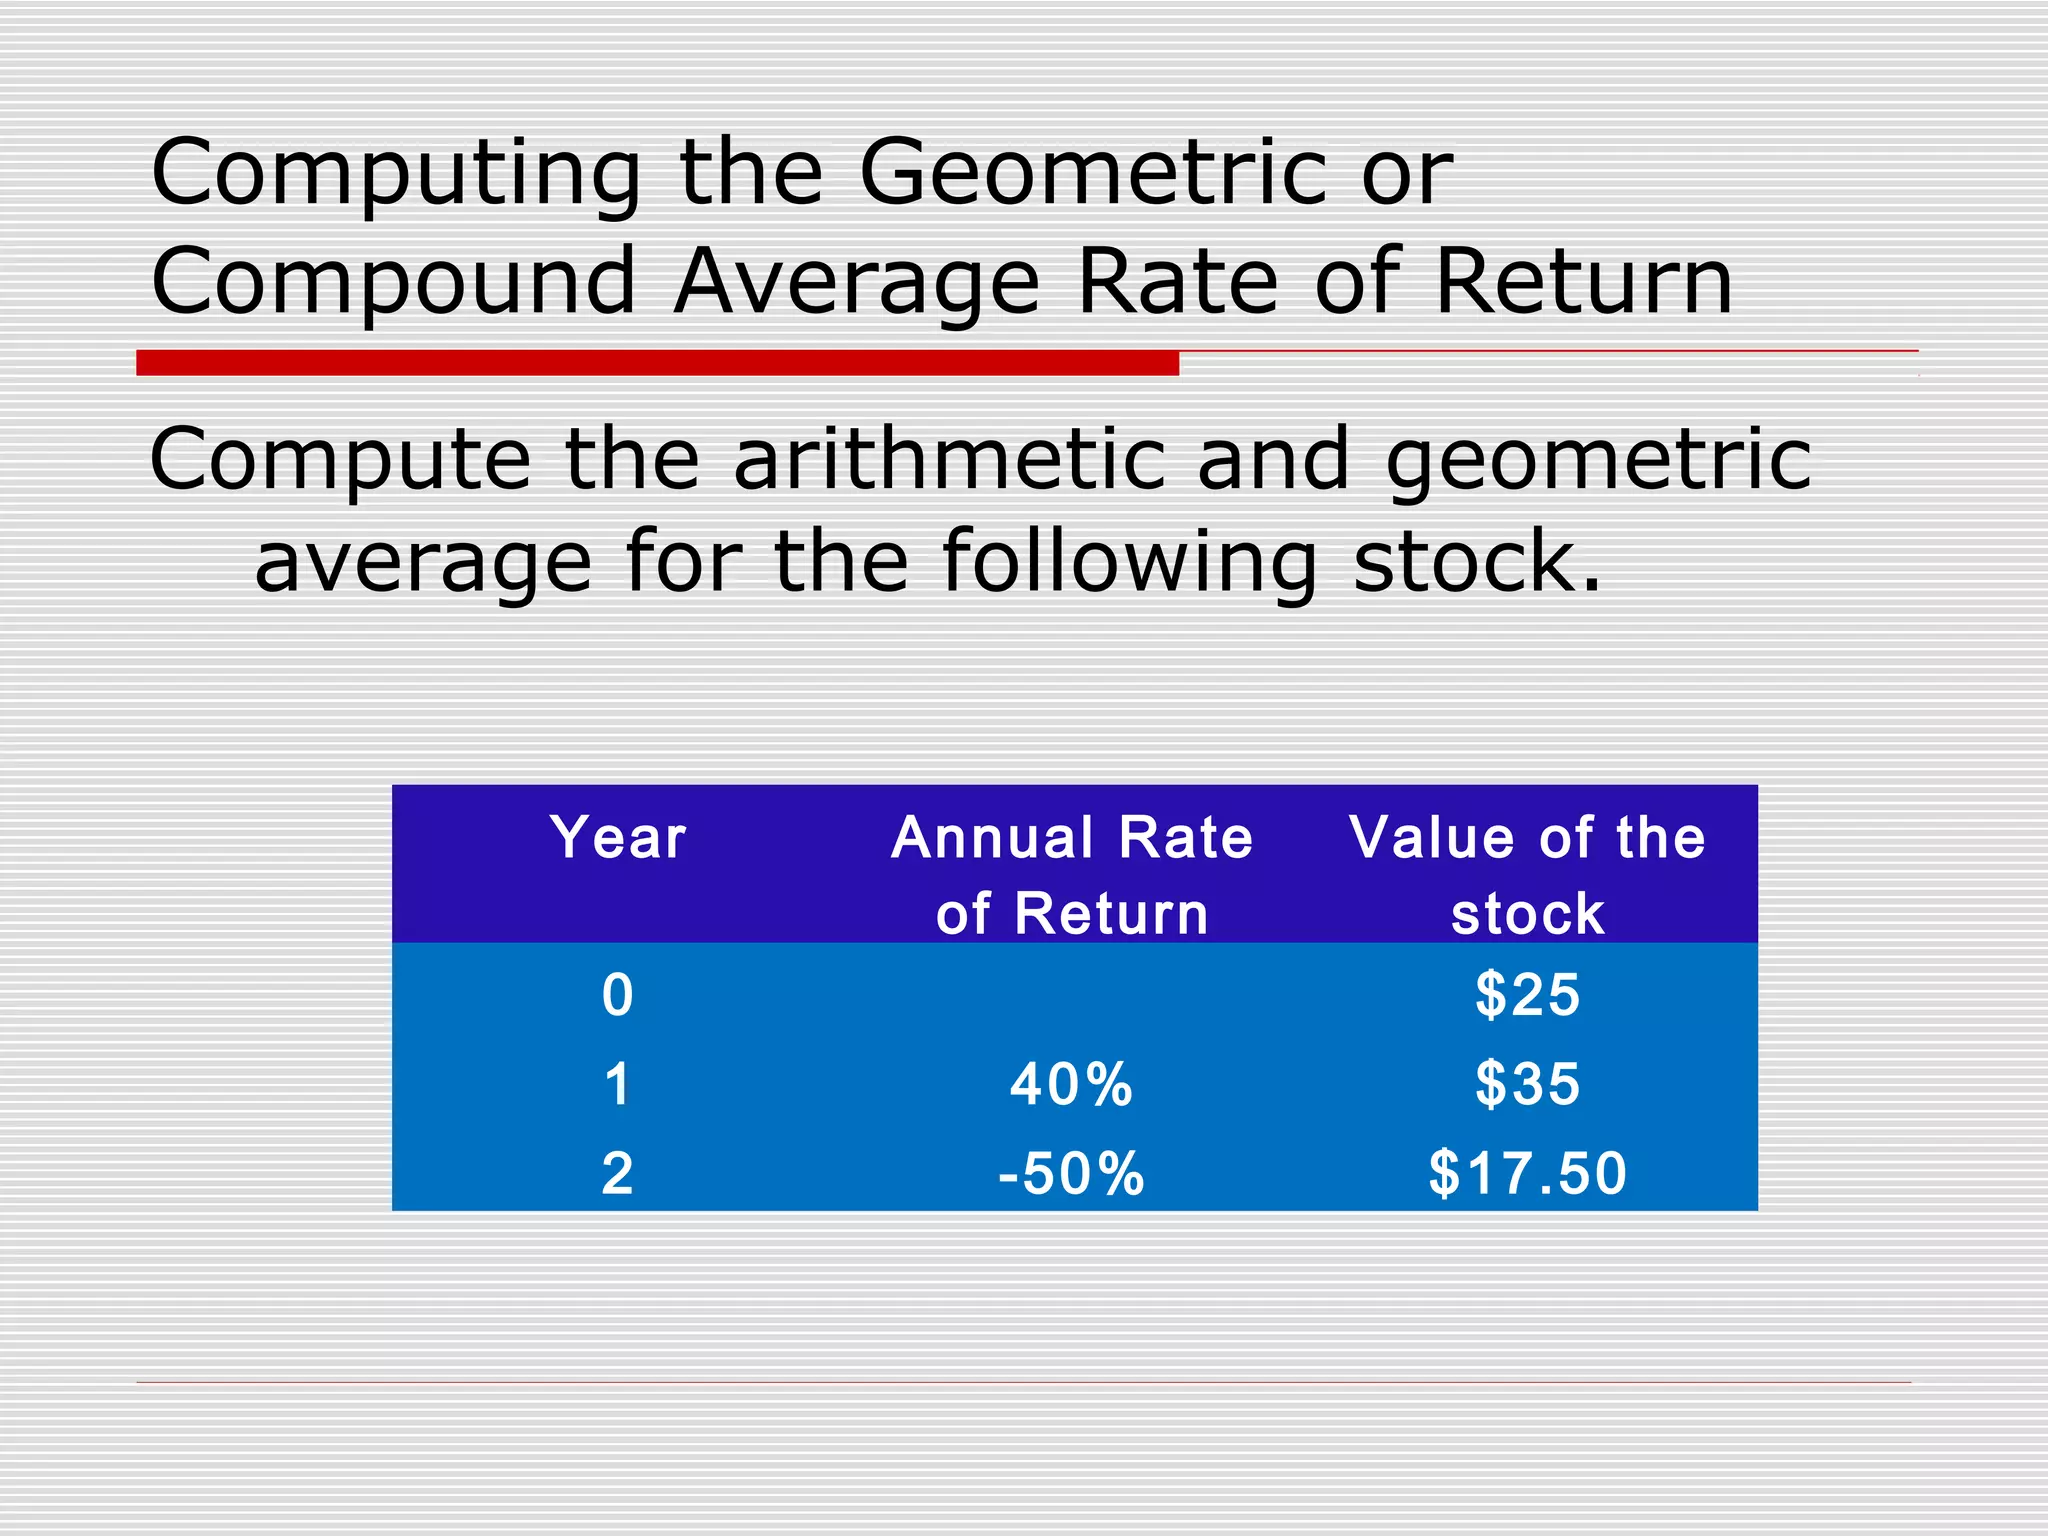
Arithmetic Average = (40-50) ÷ 2 =
-5%
Geometric Average
= [(1+Ryear1) × (1+Ryear 2)]1/2 - 1
= [(1.4) × (.5)] 1/2 - 1
= -16.33%](https://image.slidesharecdn.com/chapter7-anintroductiontoriskandreturn-140220131248-phpapp02/75/Chapter7-an-introduction-to-risk-and-return-40-2048.jpg)
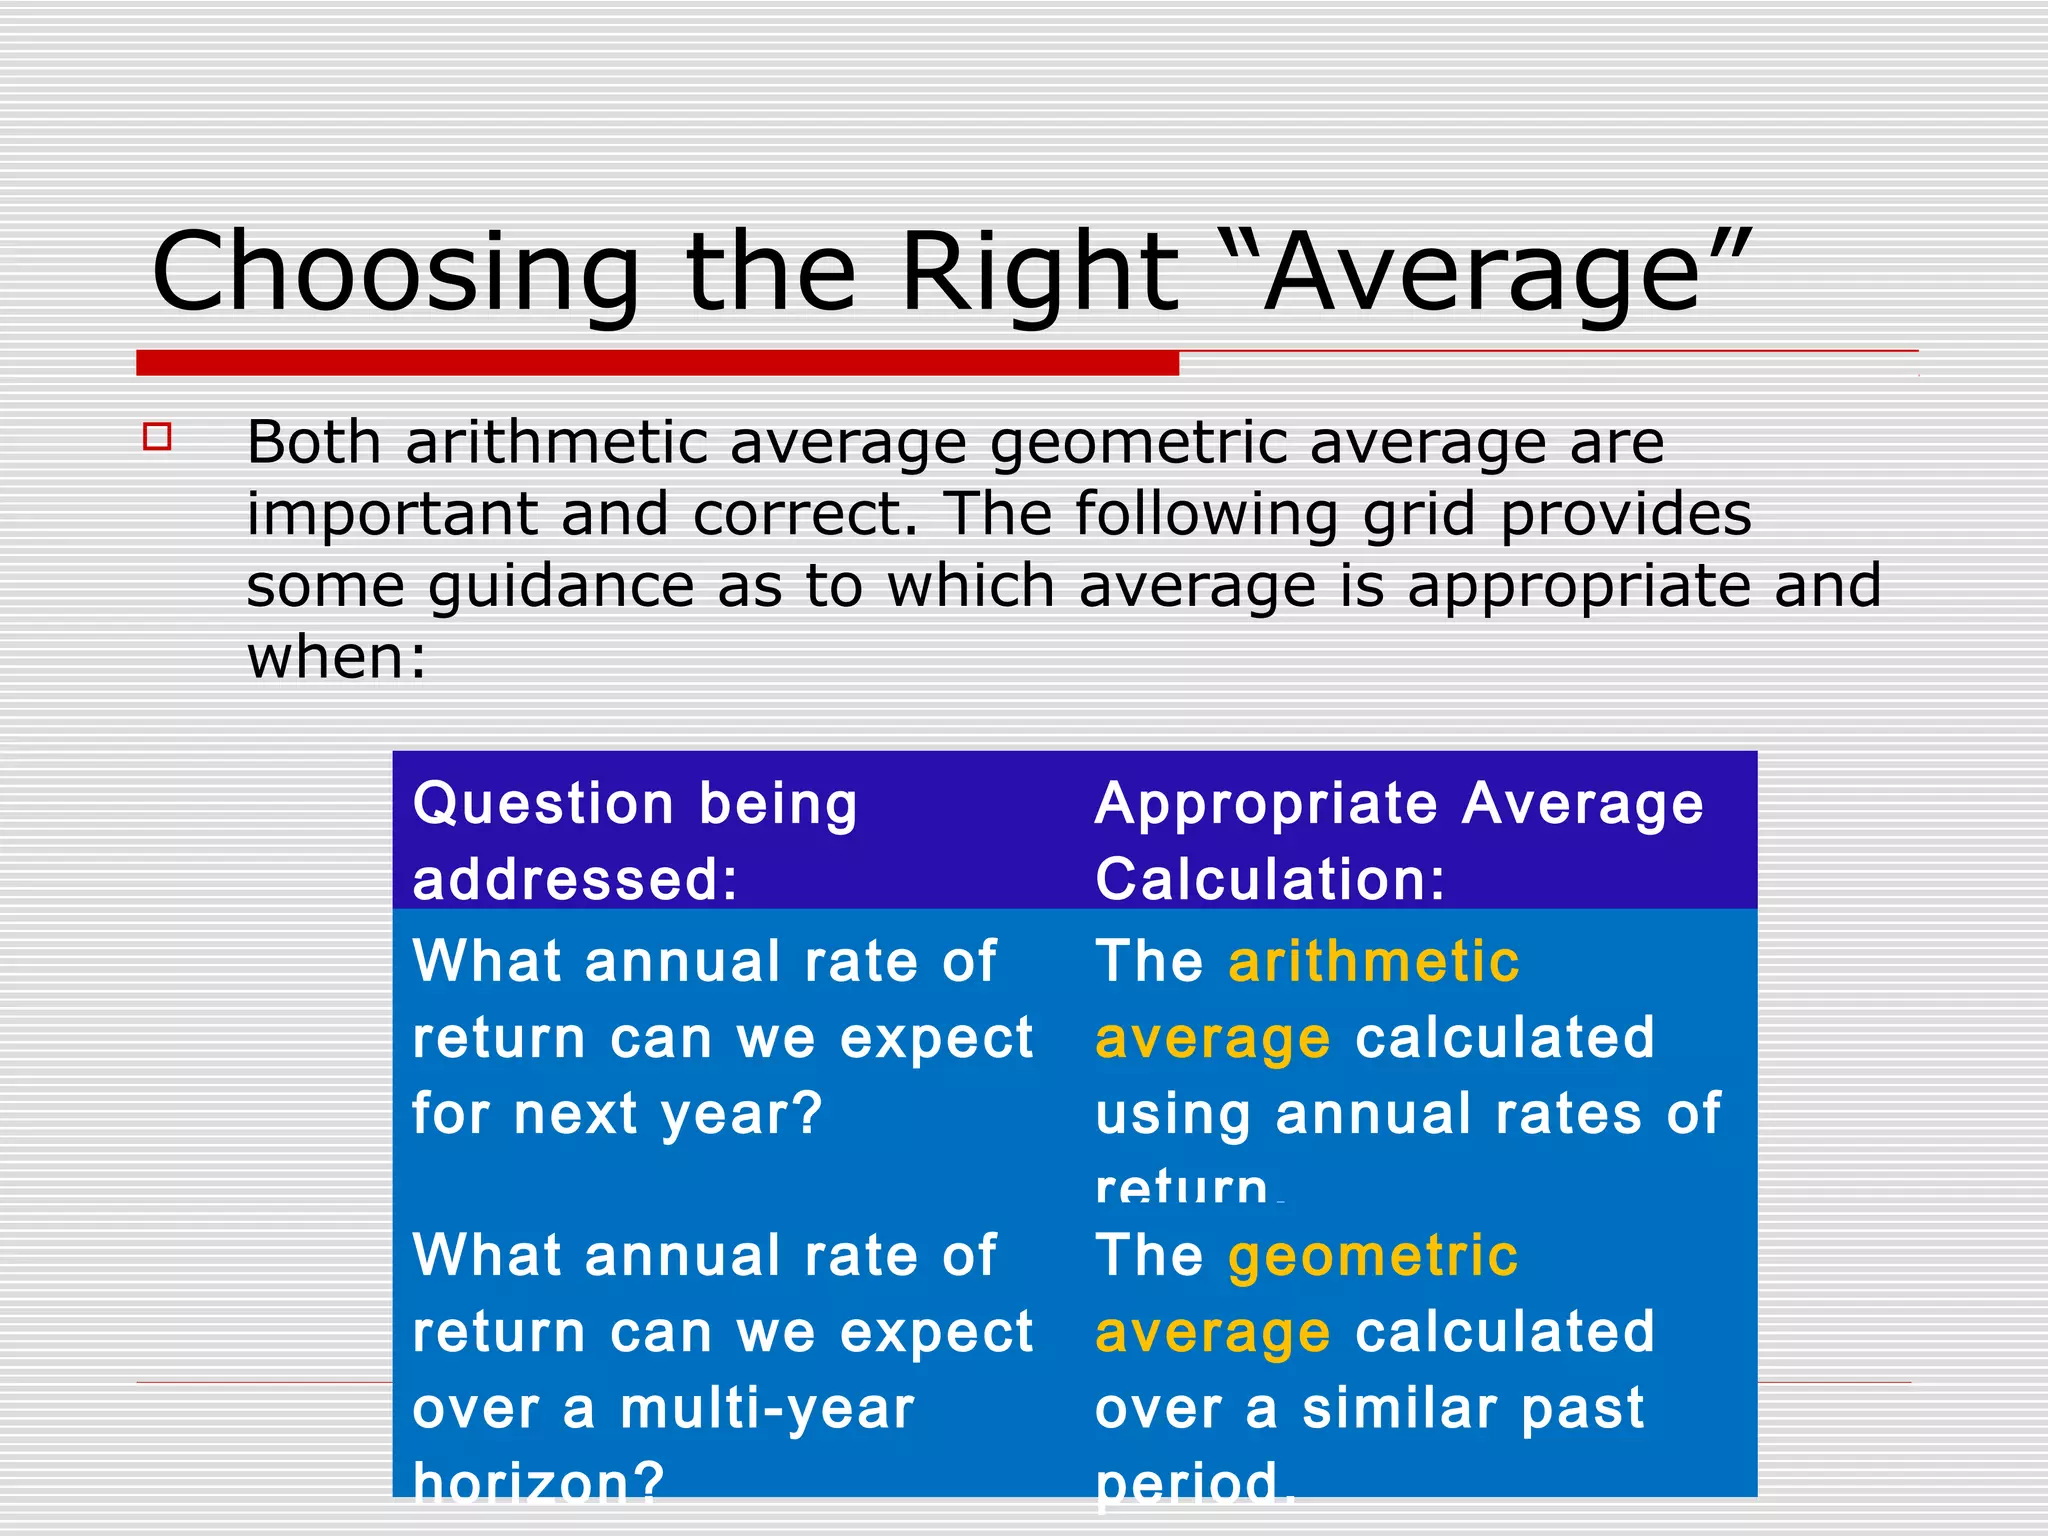

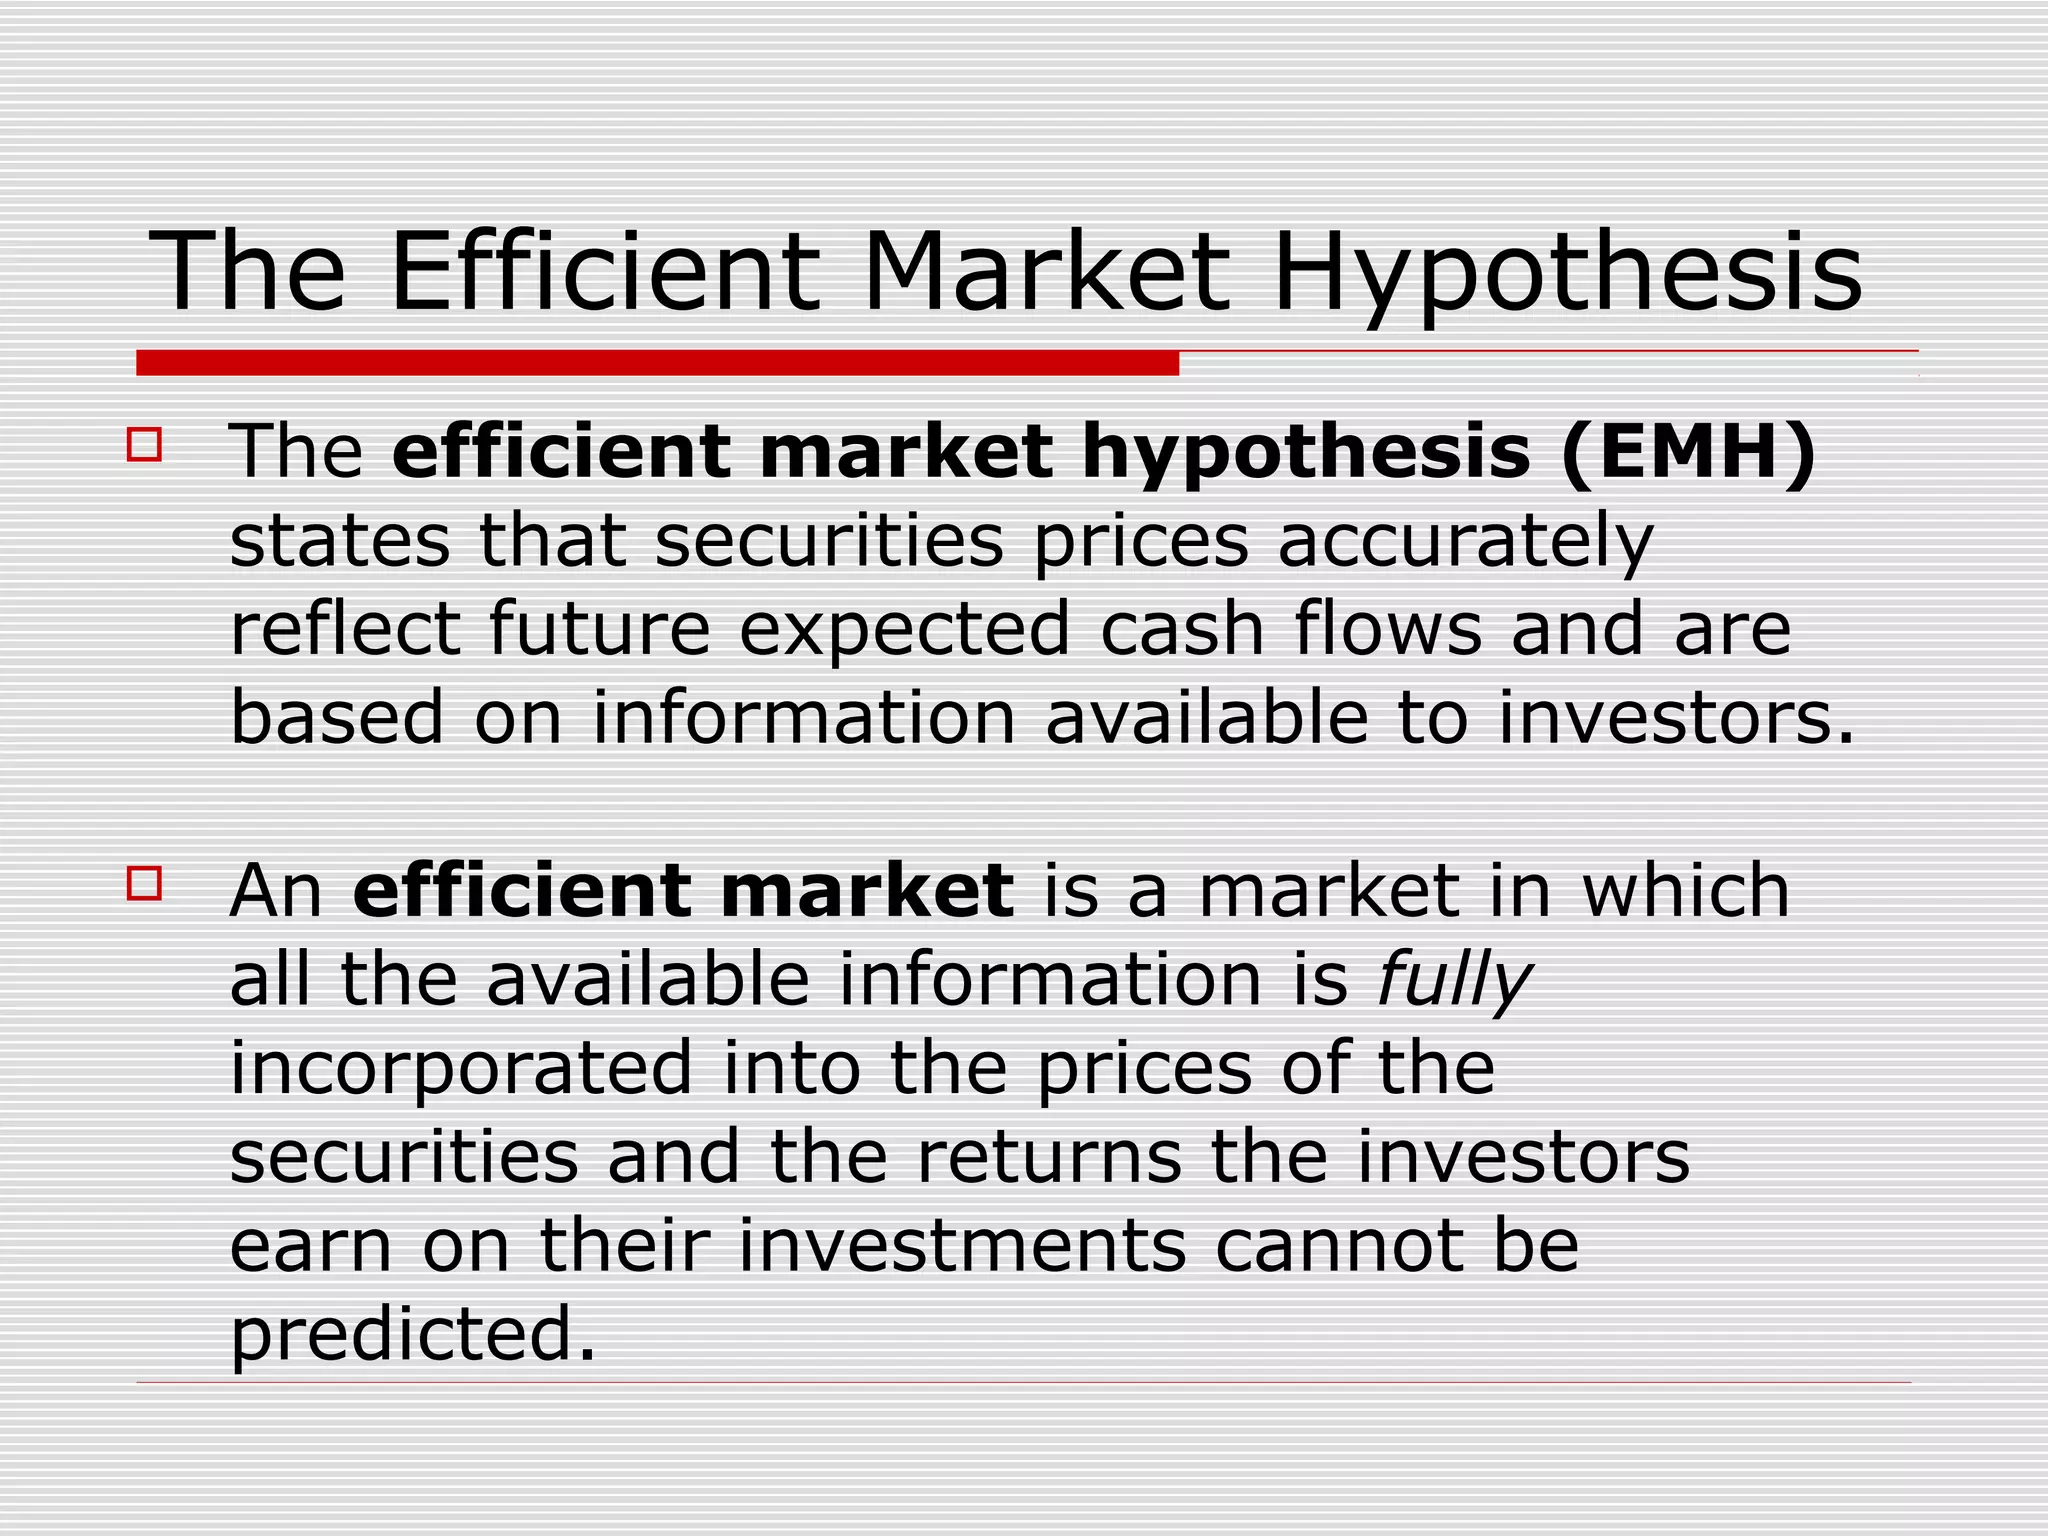

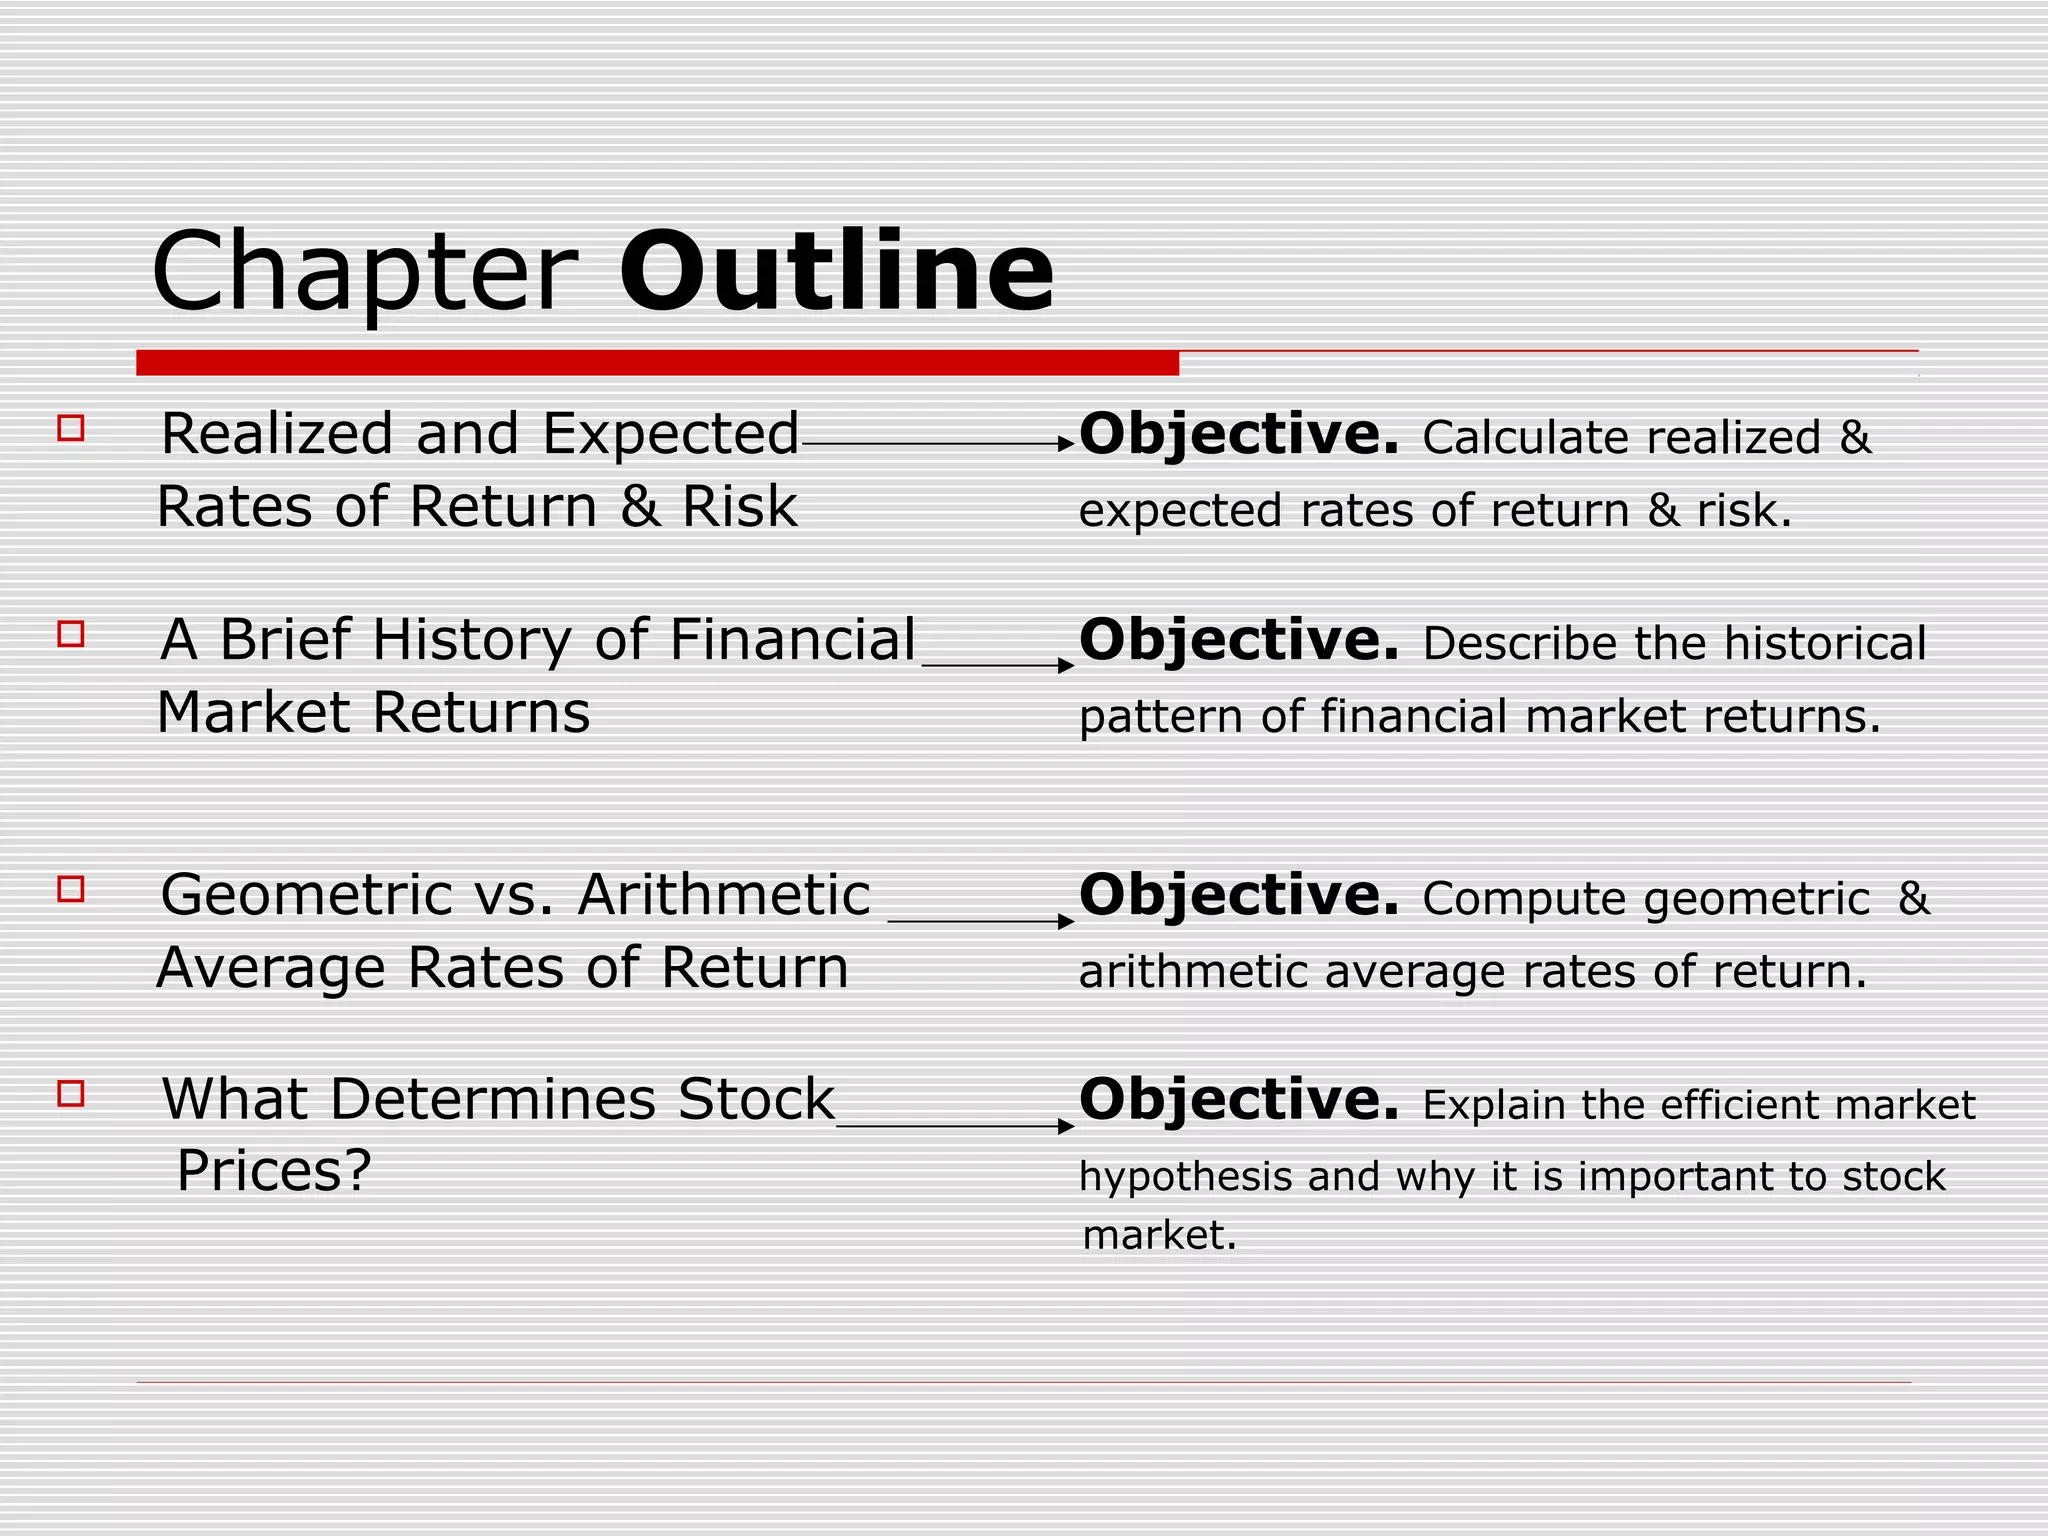
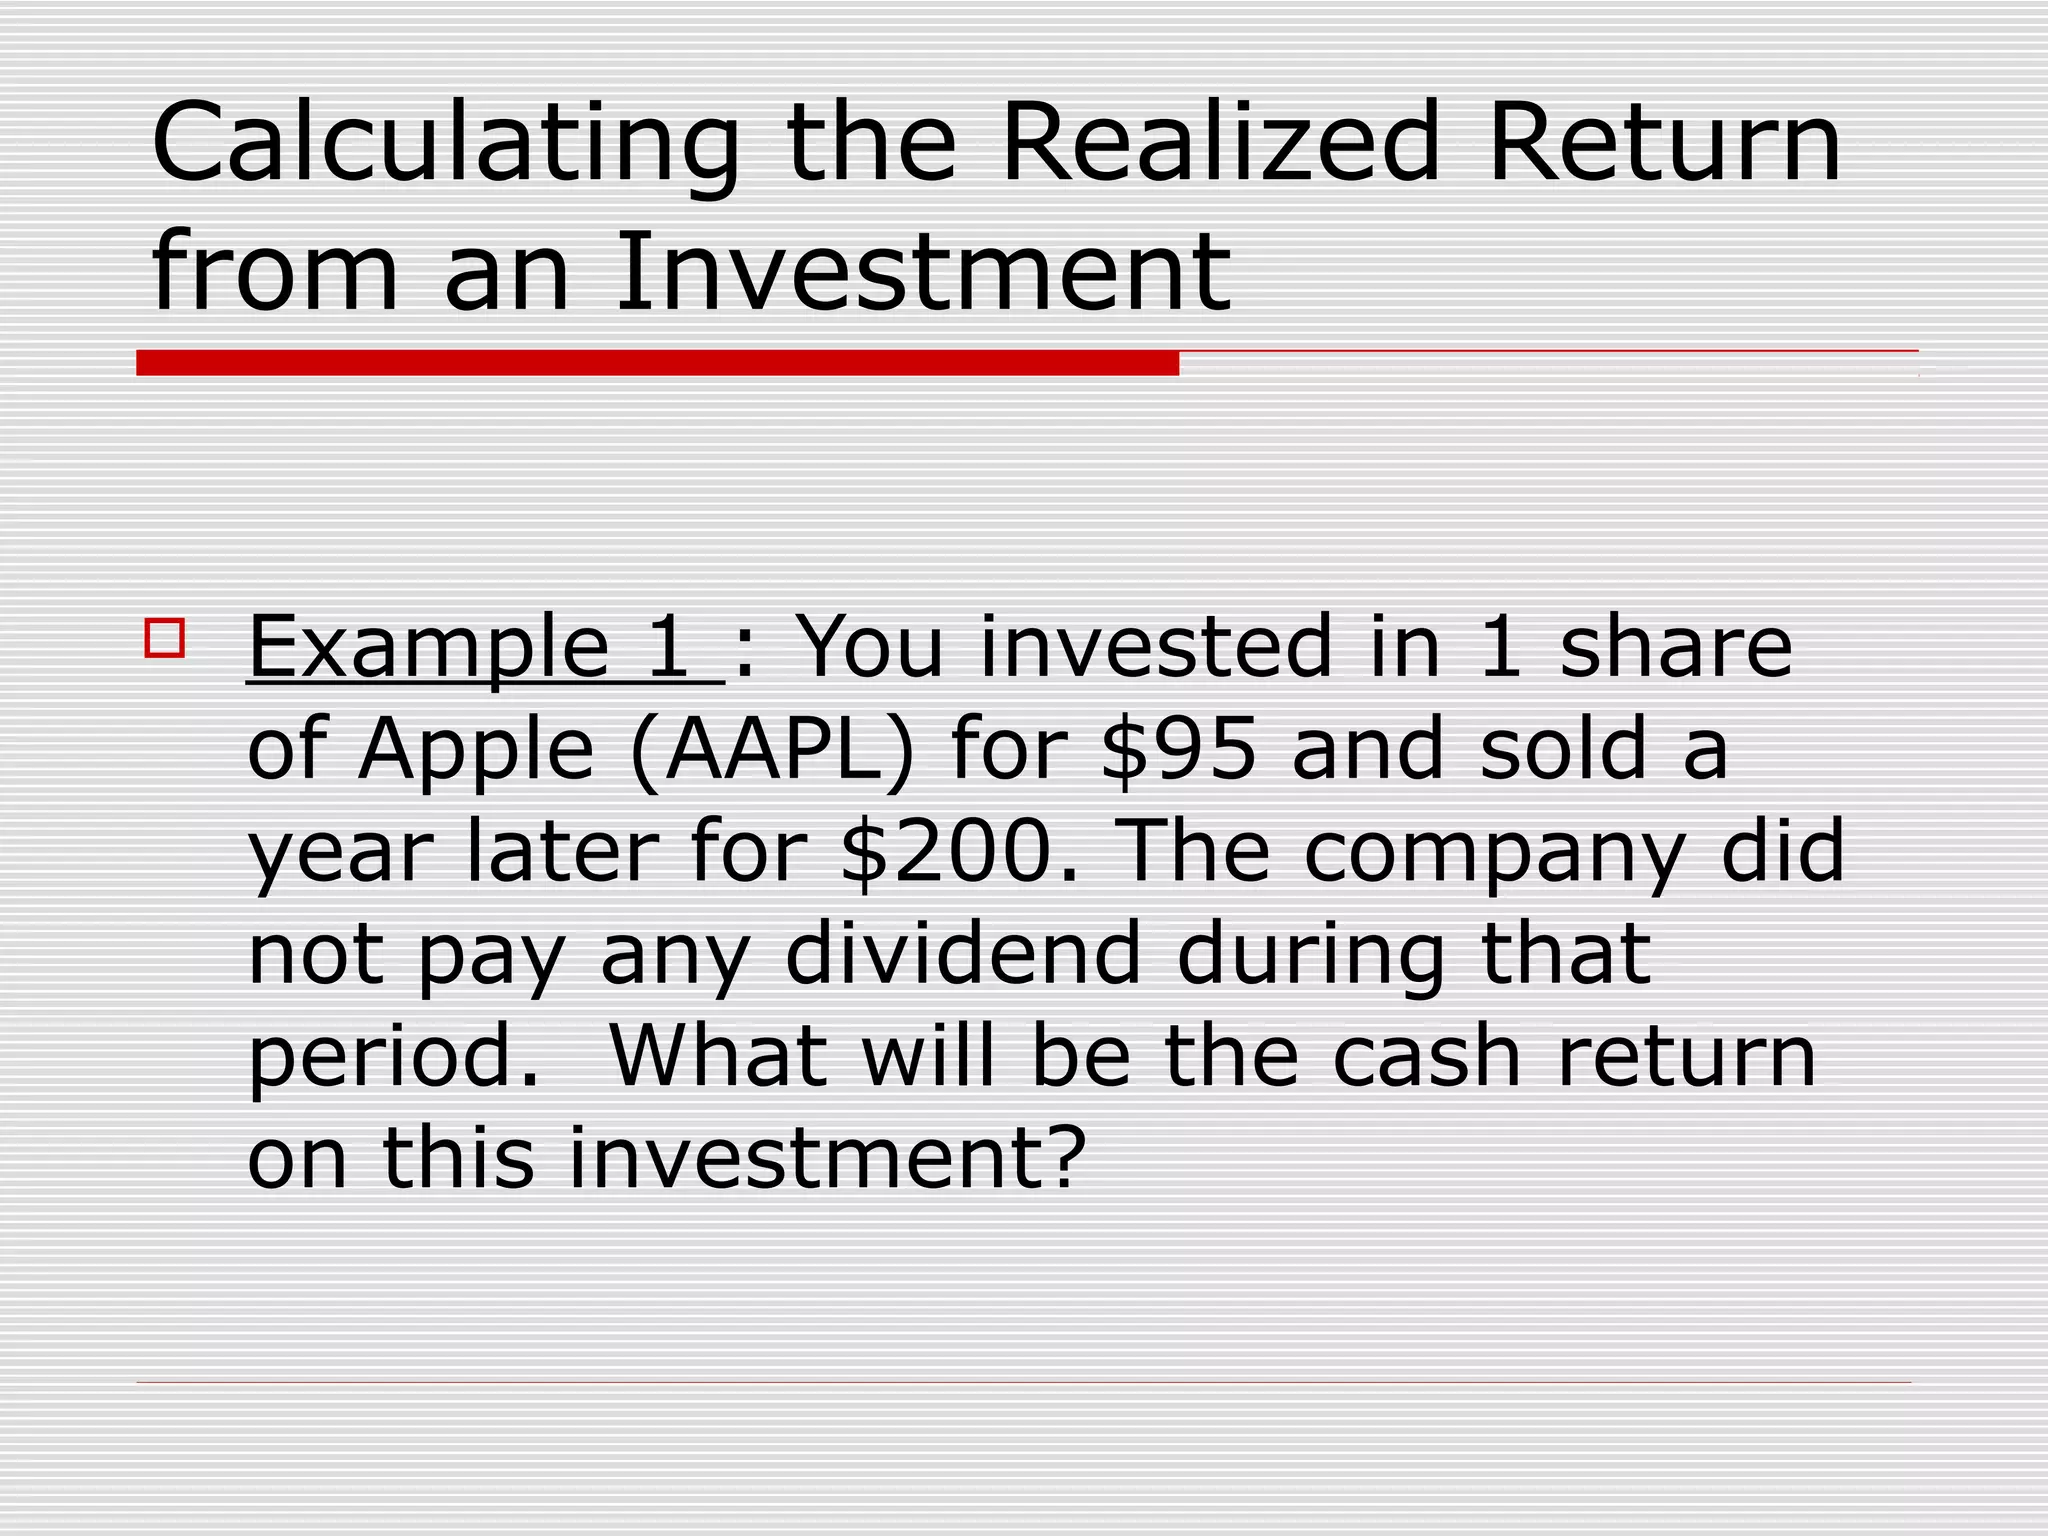
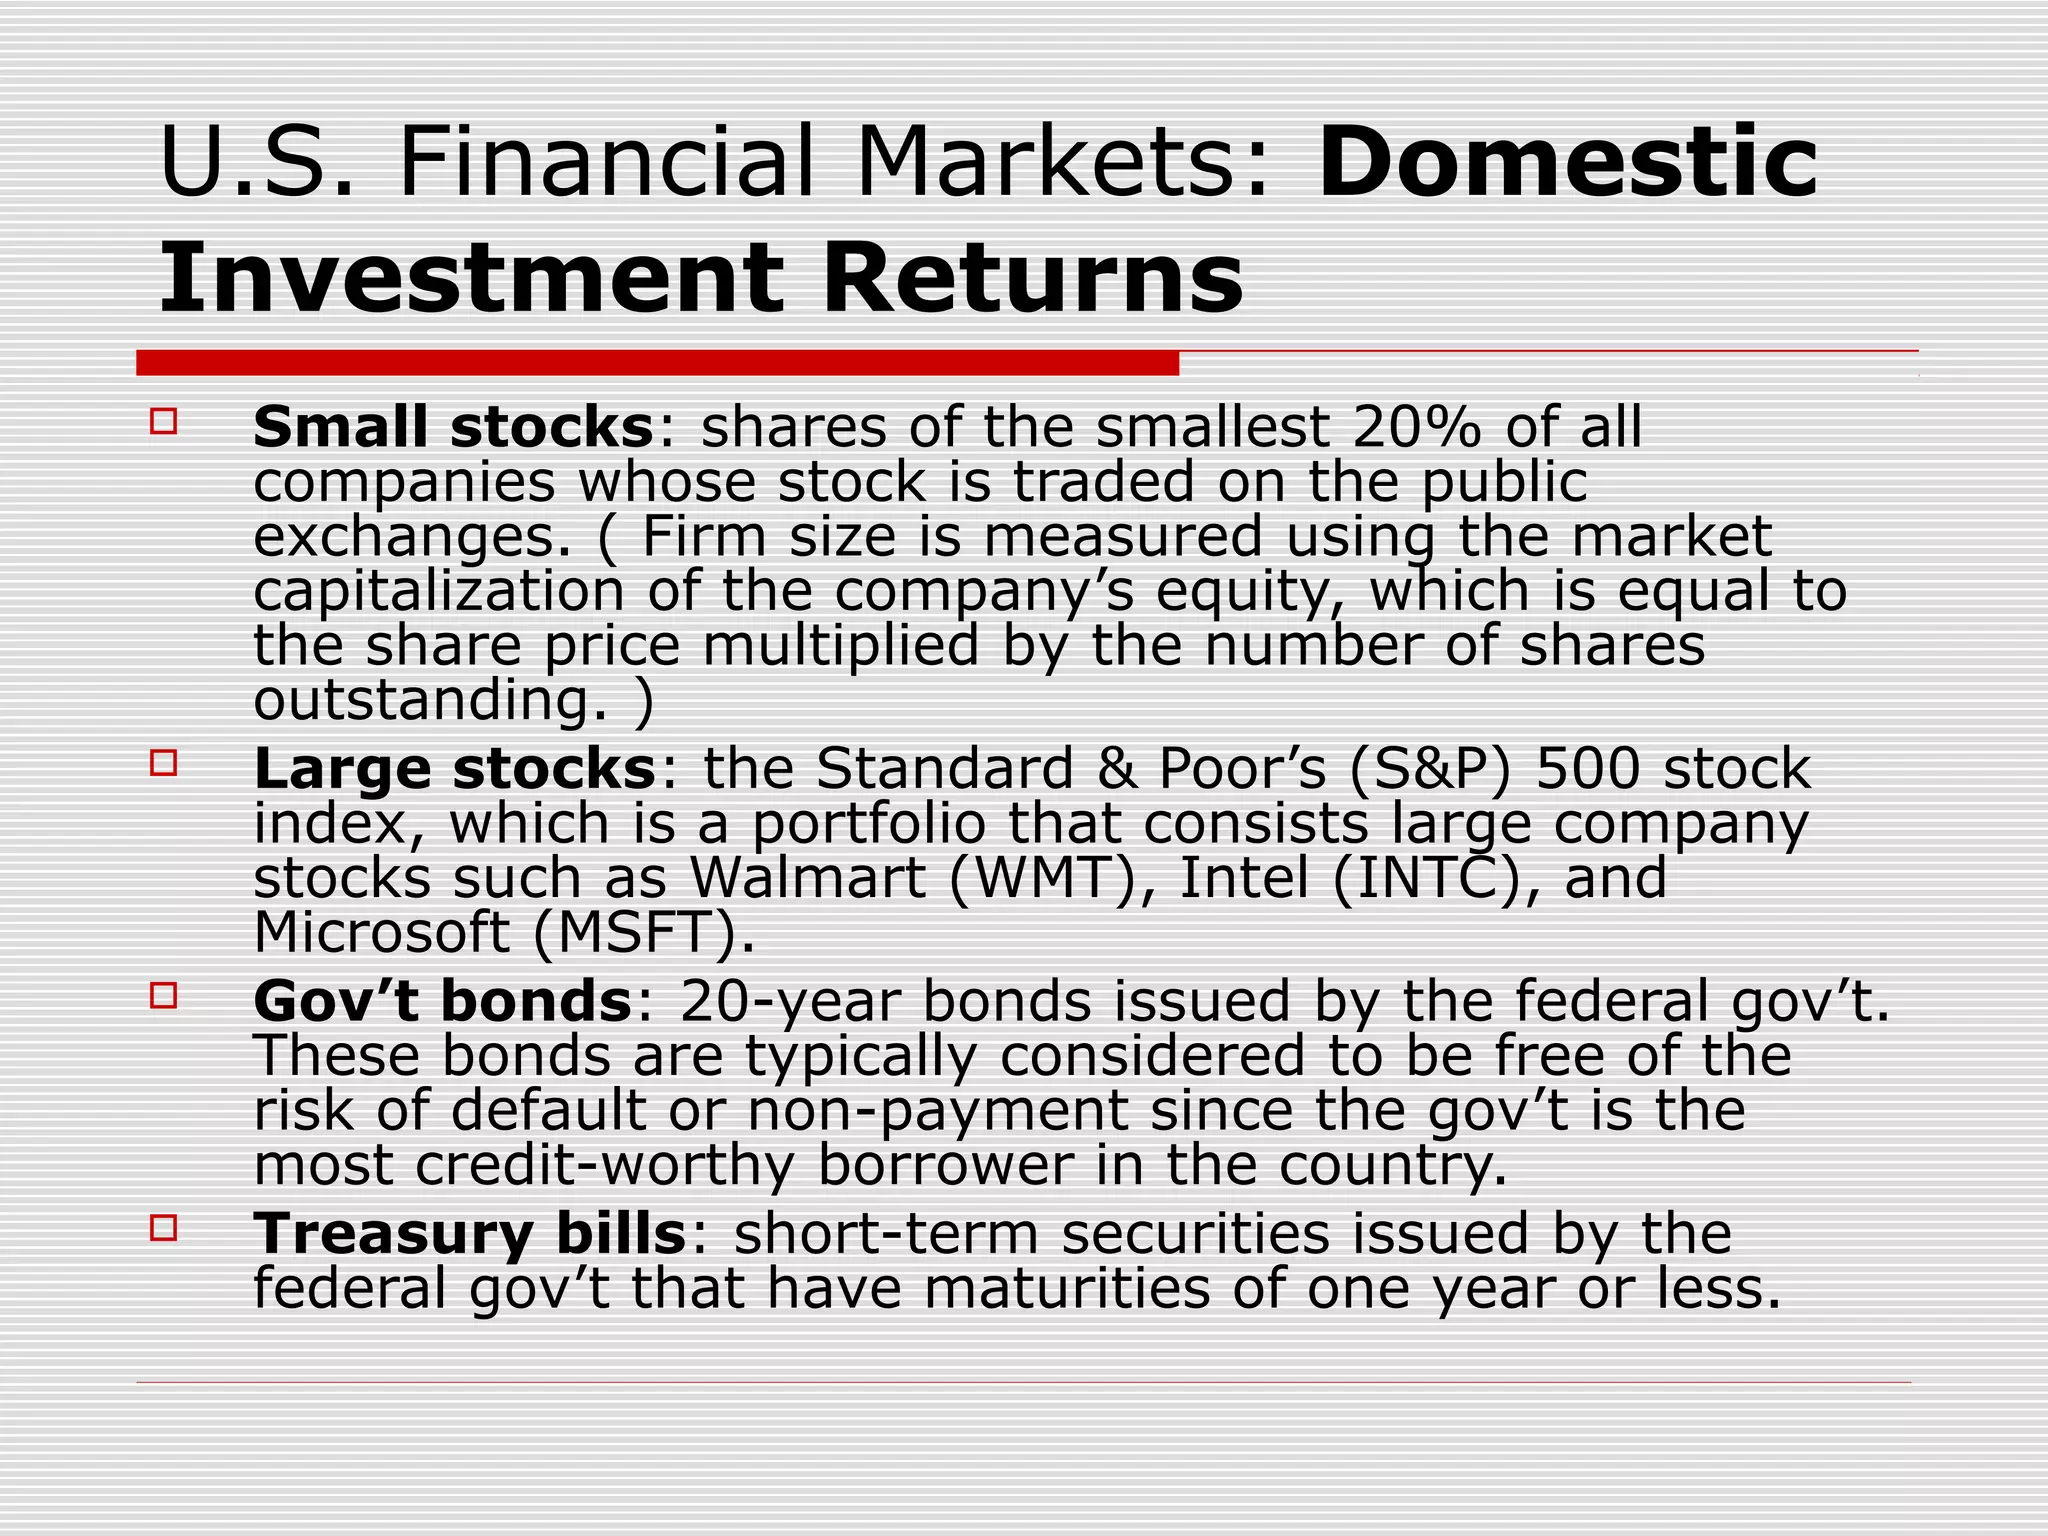
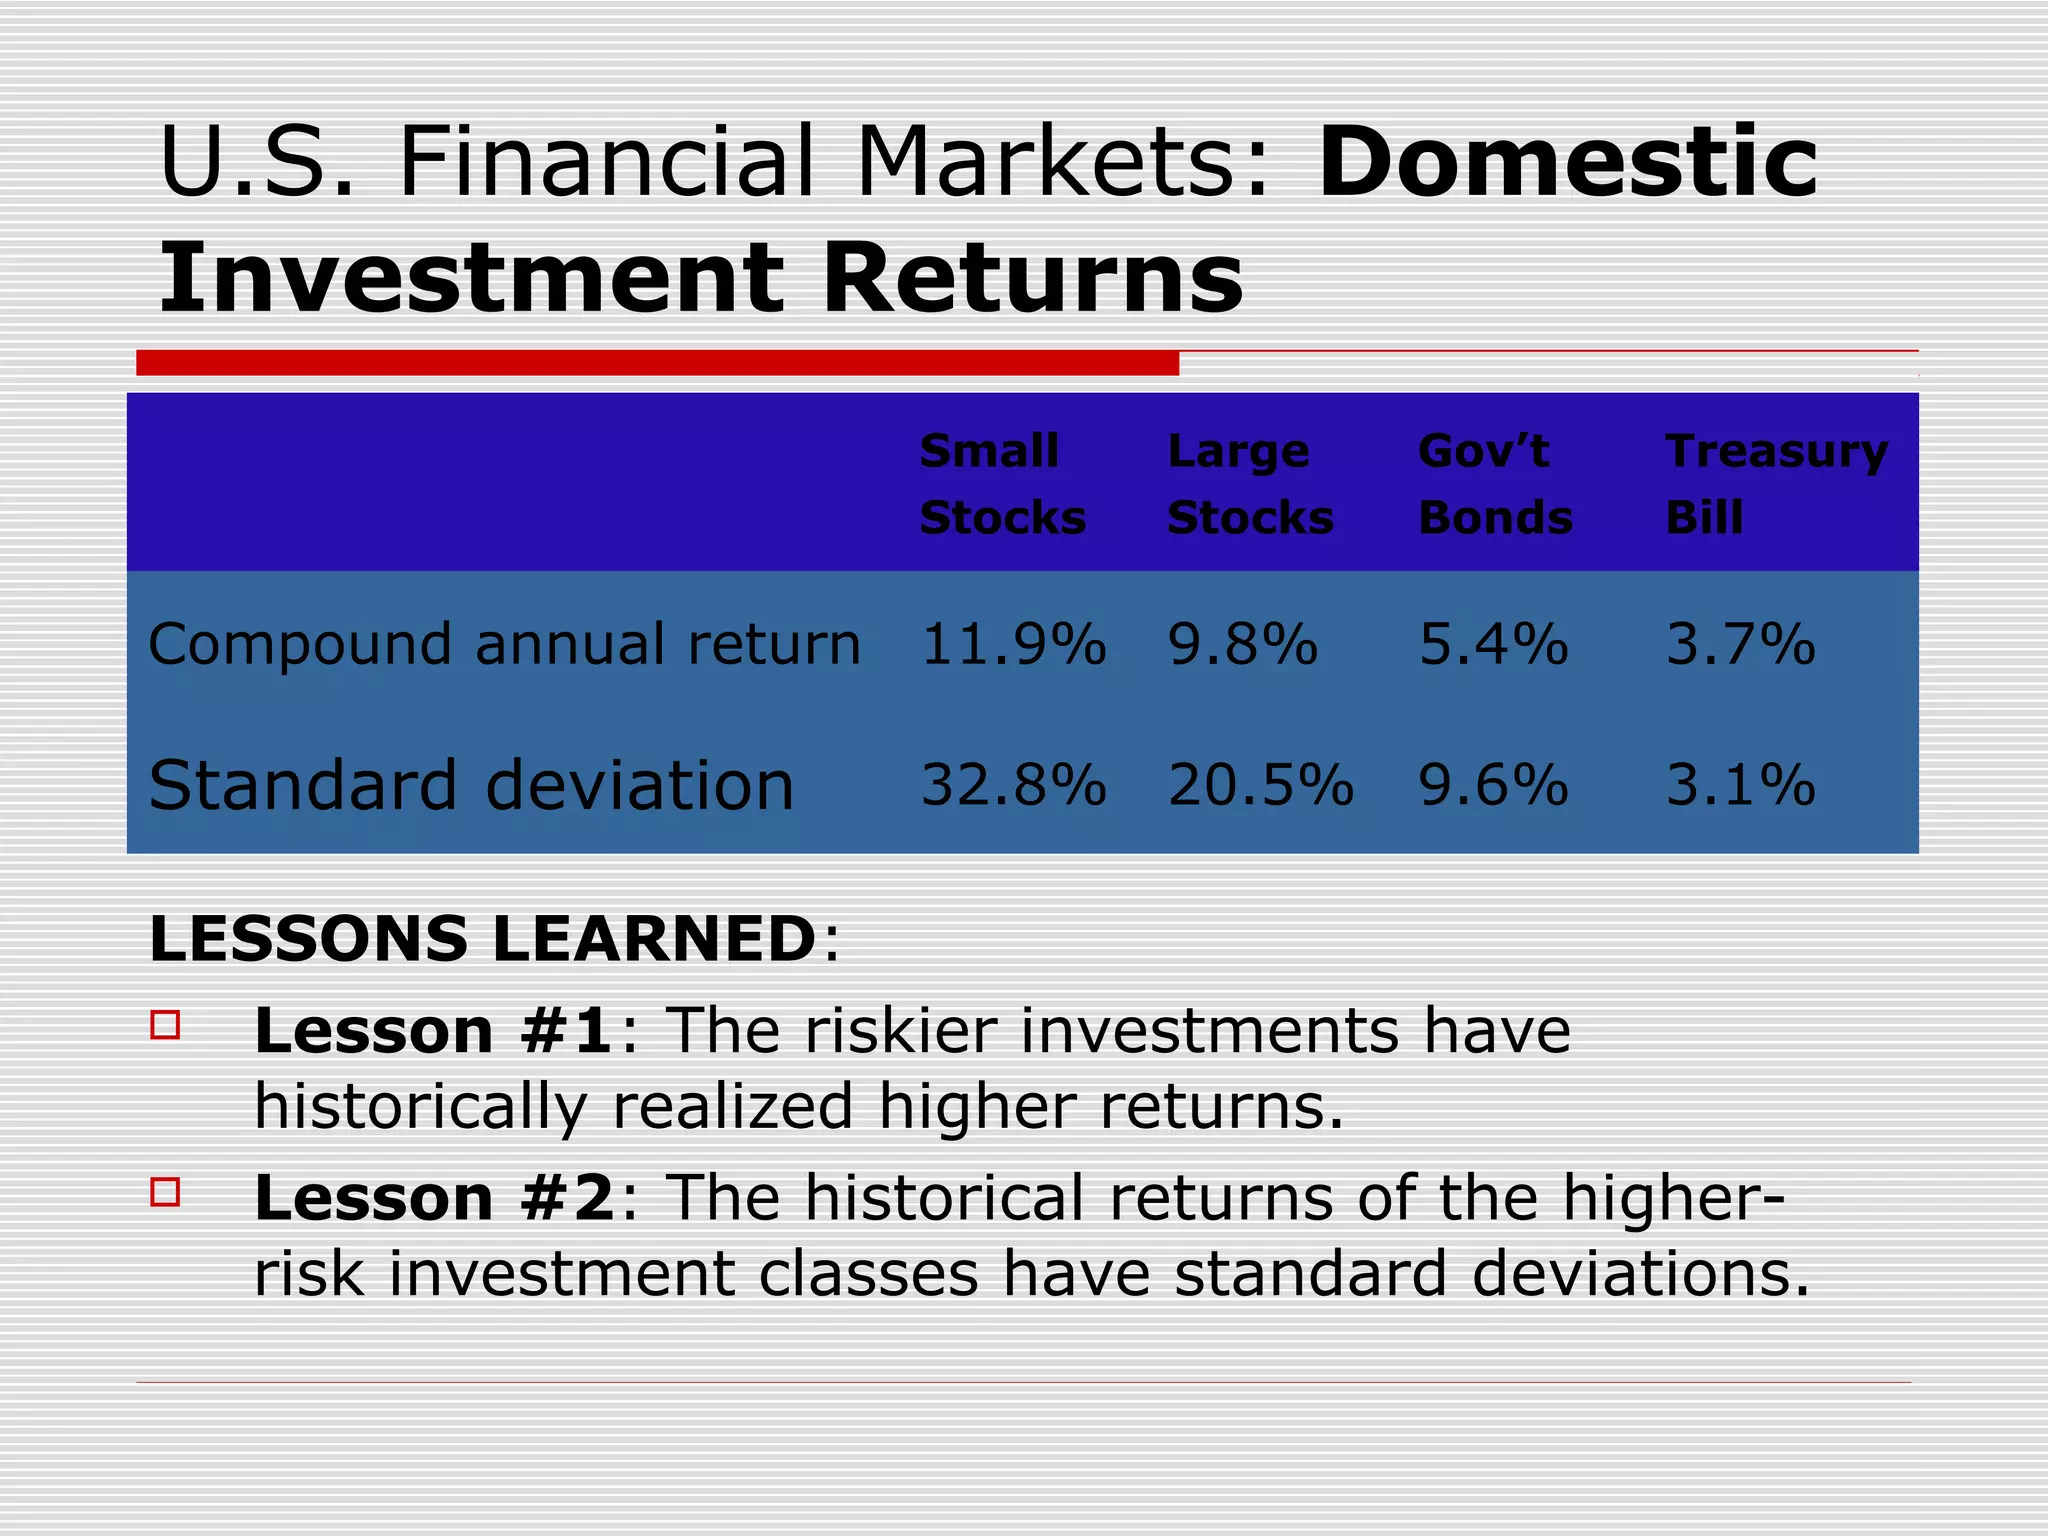
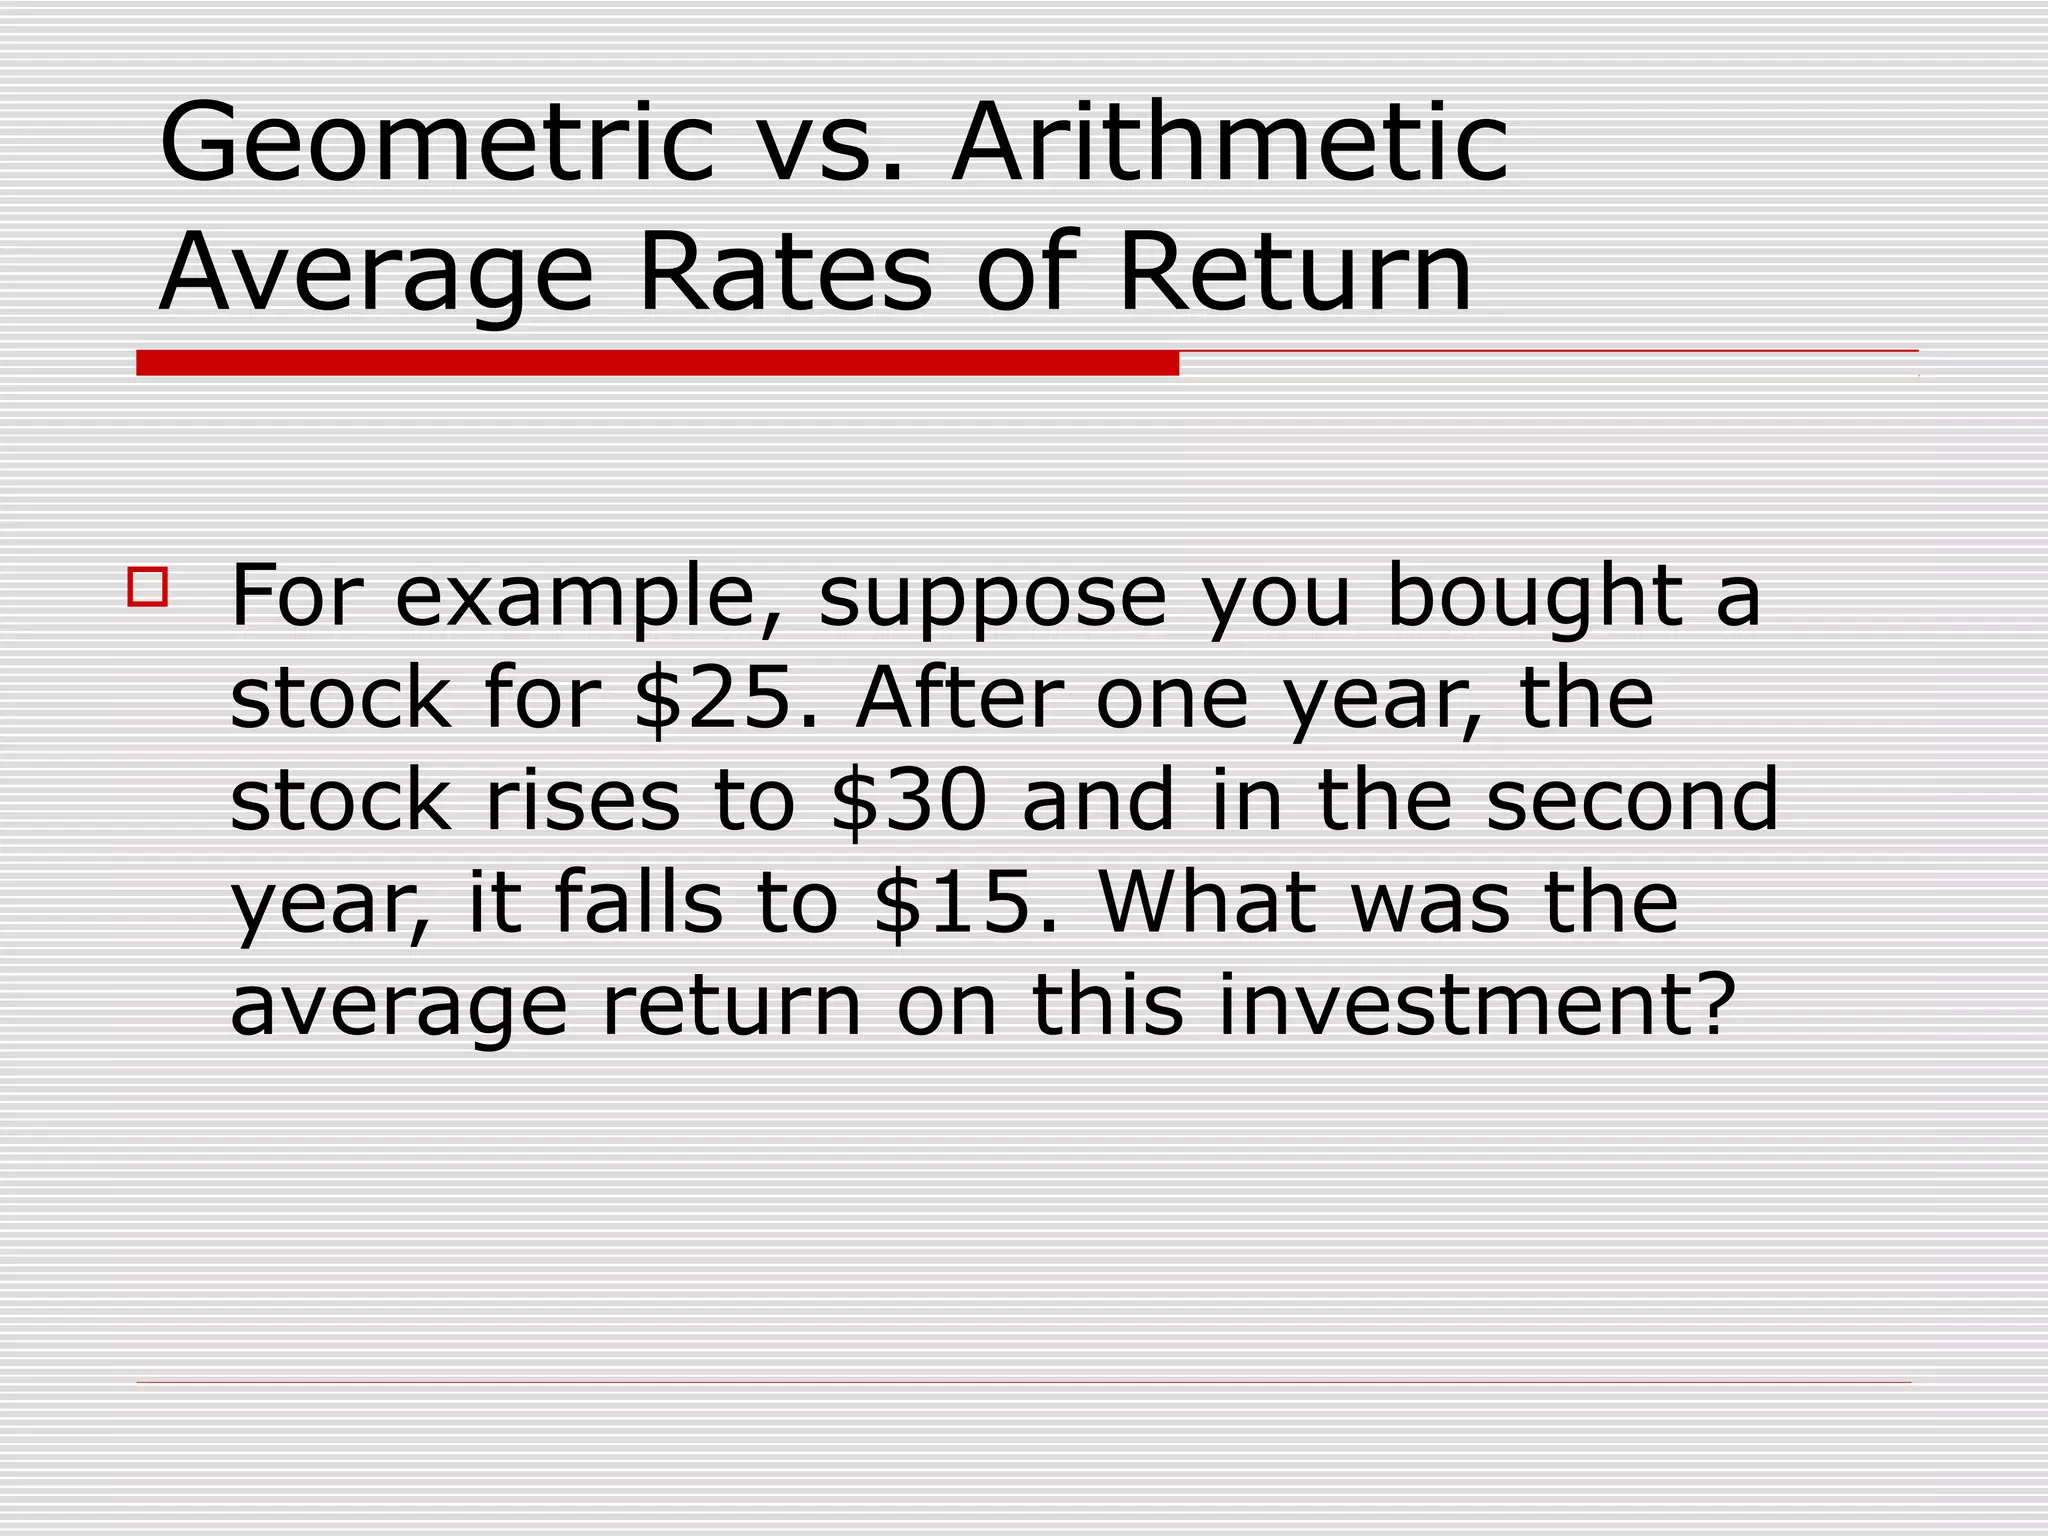
This chapter discusses risk and return in financial markets. It defines realized and expected rates of return as well as risk. Historically, riskier investments like small stocks have achieved higher average returns than less risky investments like government bonds, but also experienced greater price fluctuations. The chapter compares arithmetic and geometric average returns and explains why the geometric average best measures the compound growth rate. The efficient market hypothesis posits that market prices instantly reflect all available information.


