This document discusses sources of investment returns and how to measure risk and returns. It provides the following key points:
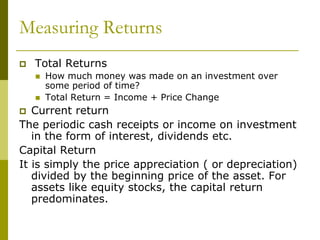
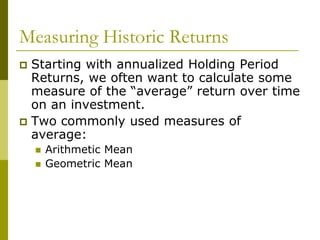
- Investments provide two basic types of returns: income returns from cash flows and returns from changes in the investment's price or value over time.
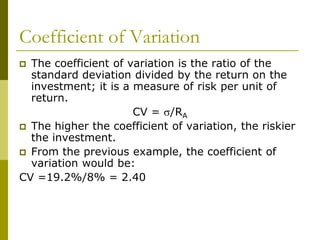
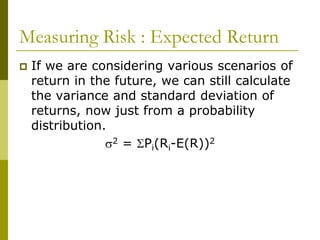
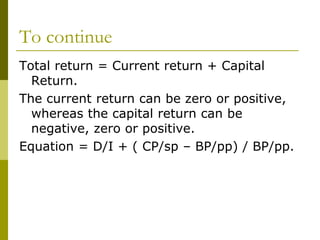
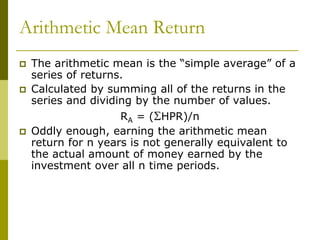
- Total return on an investment considers both income received and capital gains/losses. Various measures can quantify returns, including arithmetic mean, geometric mean, and expected rates of return.
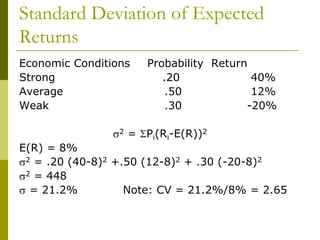
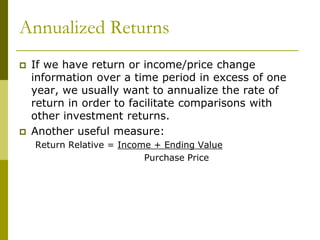
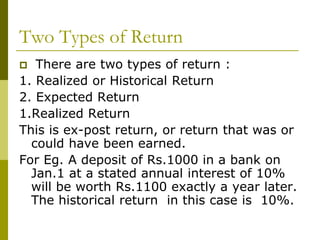
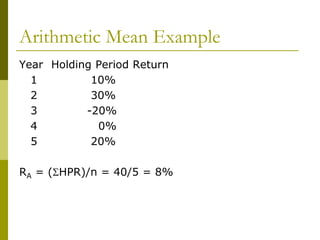
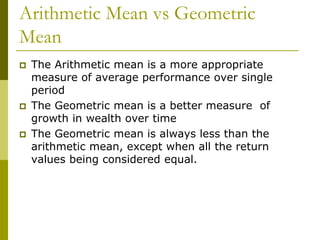
- Risk refers to the uncertainty of investment returns and is measured by the variability of possible outcomes. The total risk of an investment includes systematic and unsystematic components. Systematic risk cannot be eliminated by diversification, while unsystematic risk can be reduced through diversification


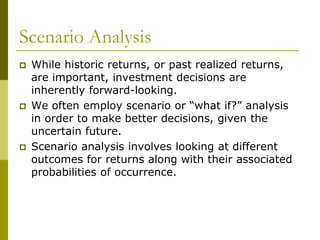
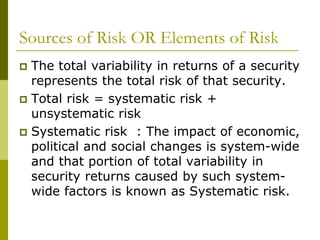
![Geometric Mean Return
The geometric mean reflects the
compound rate of growth over time.
It is calculated as the nth root of the
product of all of the n return relatives of
the investment.
RG = [P(Return Relatives)]1/n – 1
Return relative = 1 + Total Return](https://image.slidesharecdn.com/riskandreturnnew-200831175126/85/Risk-and-return-13-320.jpg)
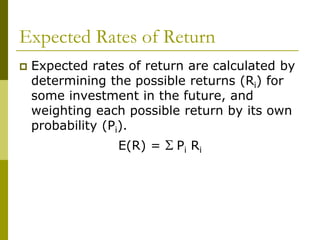
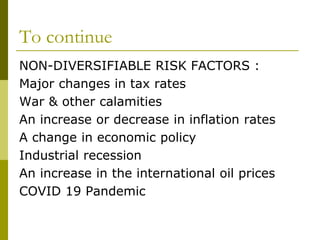
![Geometric Mean Example
Year Holding Period Return Return Relative
1 10% 1.10
2 30% 1.30
3 -20% 0.80
4 0% 1.00
5 20% 1.20
RG = [P(Return Relatives)]1/n – 1
RG = [(1.10)(1.30)(.80)(1.00)(1.20)]1/5 – 1
RG = .0654 or 6.54%](https://image.slidesharecdn.com/riskandreturnnew-200831175126/85/Risk-and-return-14-320.jpg)
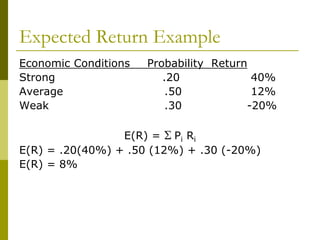
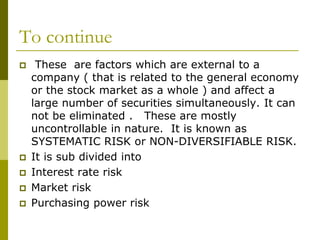

![How can we measure risk?
Since risk is related to variability and uncertainty,
we can use measures of variability to assess risk.
The variance and its positive square root, the
standard deviation, are such measures.
Measure “total risk” of an investment, the combined
effects of systematic and unsystematic risk.
Variance of Historic Returns
s2 = [S(Rt-RA)2]/n-1](https://image.slidesharecdn.com/riskandreturnnew-200831175126/85/Risk-and-return-25-320.jpg)
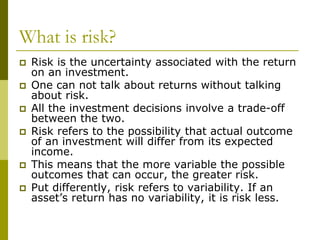
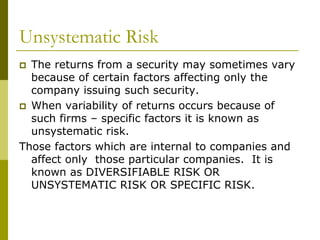
![Standard Deviation of Historic
Returns
Year Holding Period Return
1 10% RA = 8%
2 30% s2 = 370
3 -20% s = 19.2%
4 0%
5 20%
s2 = [S(Rt-RA)2]/n-1
s2 = [(10-8)2+(30-8)2+(-20-8)2+(0-8)2+(20-8)2]/4
= [4+484+784+64+144]/4
= [1480]/4](https://image.slidesharecdn.com/riskandreturnnew-200831175126/85/Risk-and-return-26-320.jpg)