Download to read offline


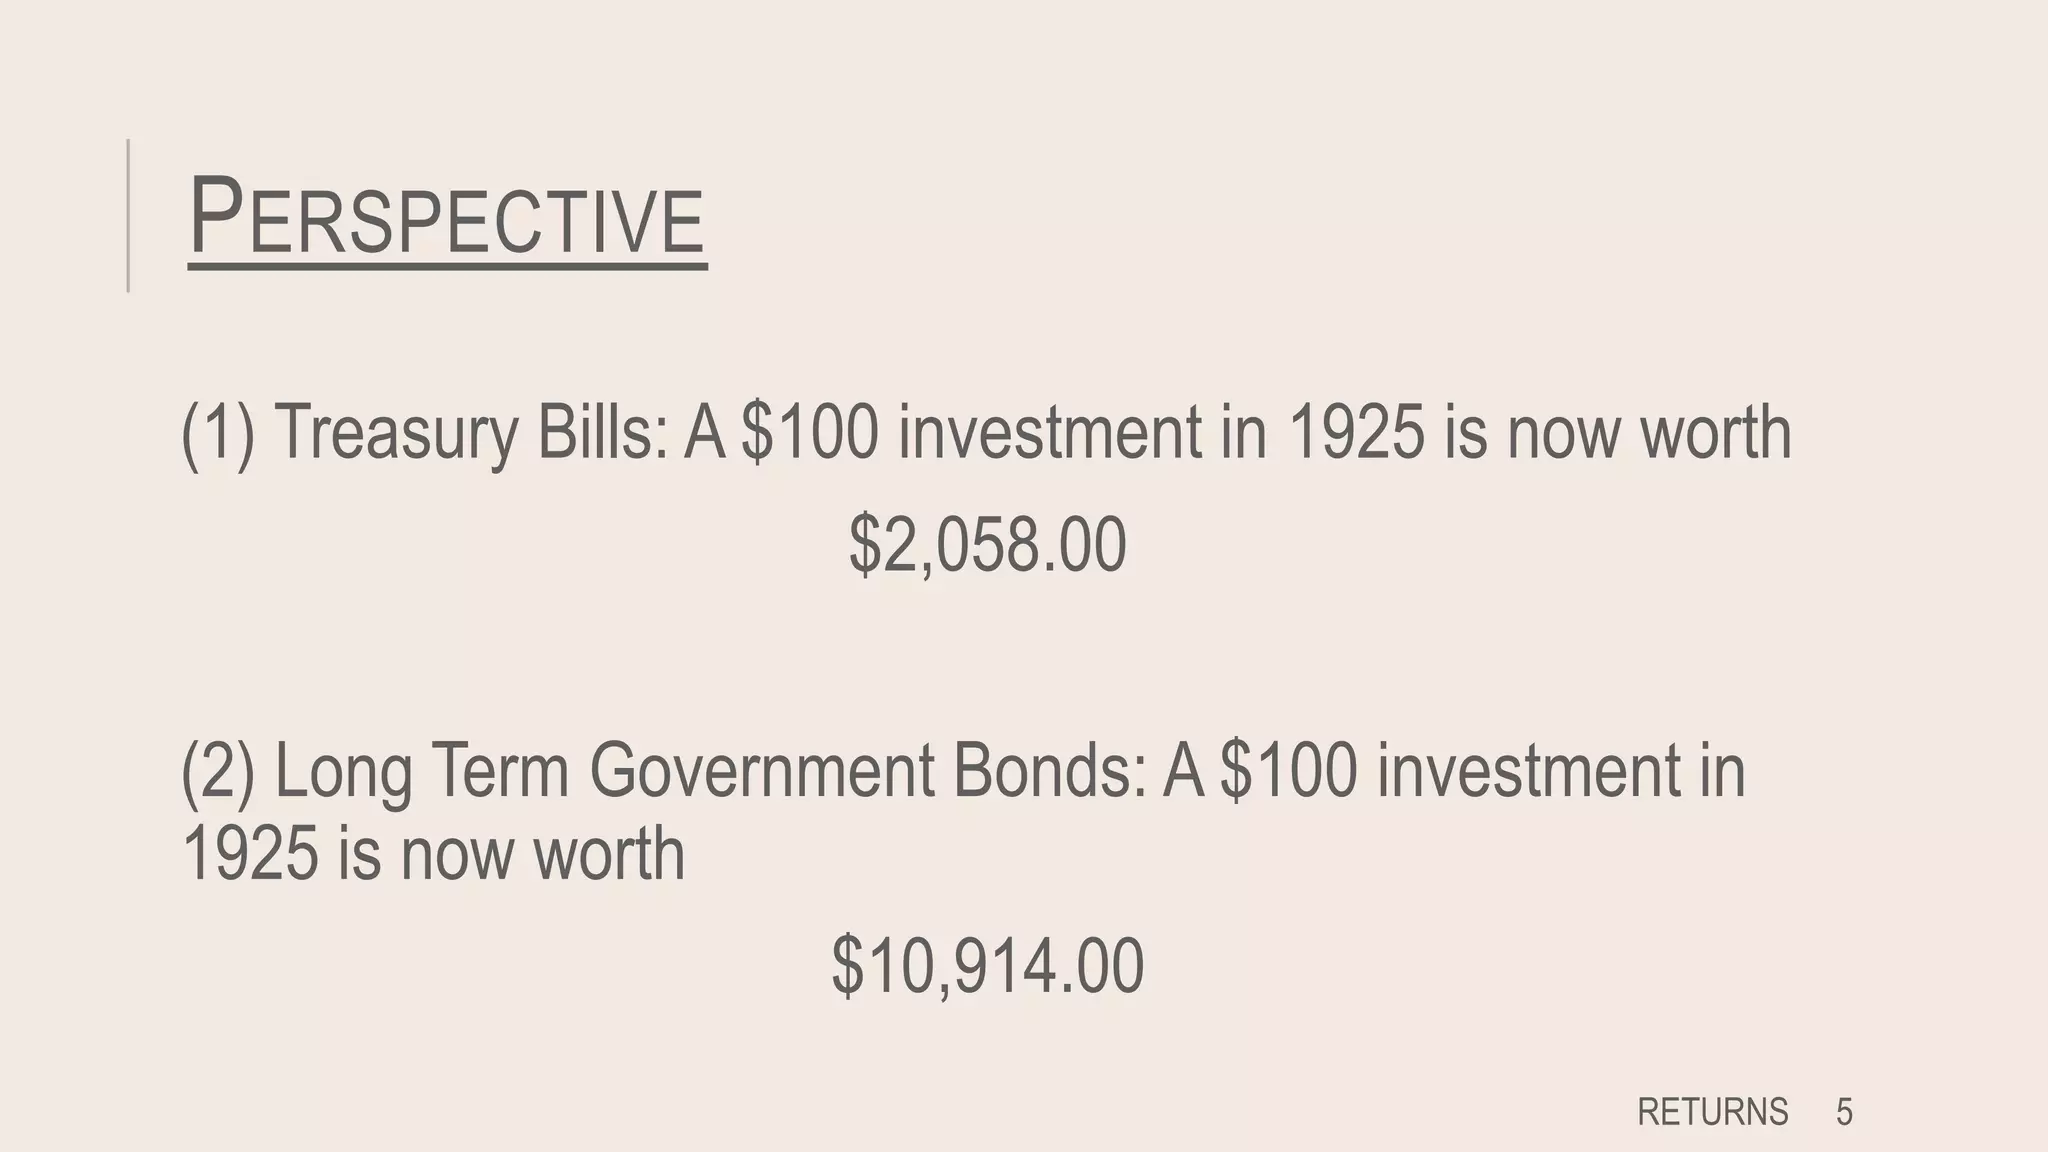


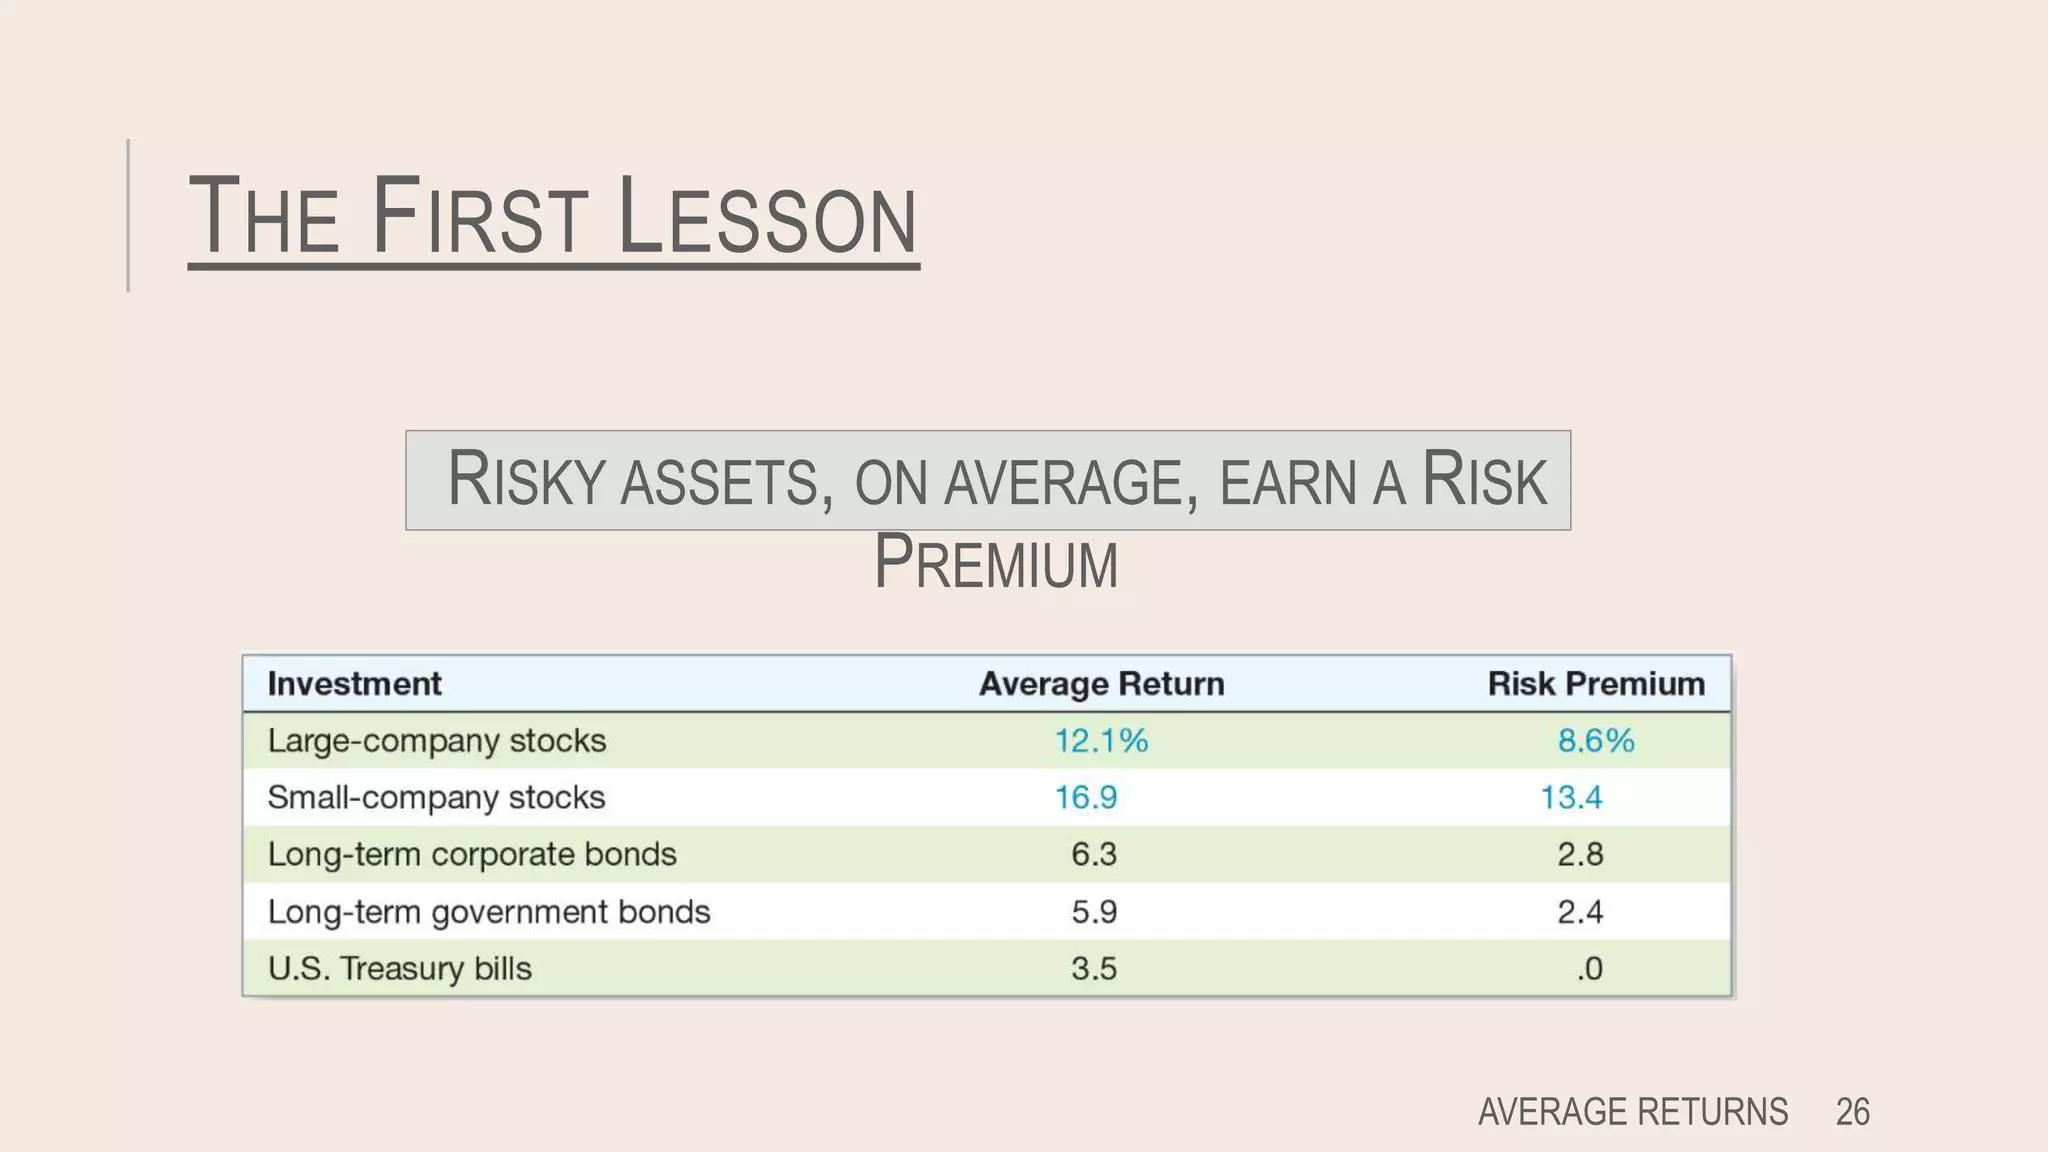


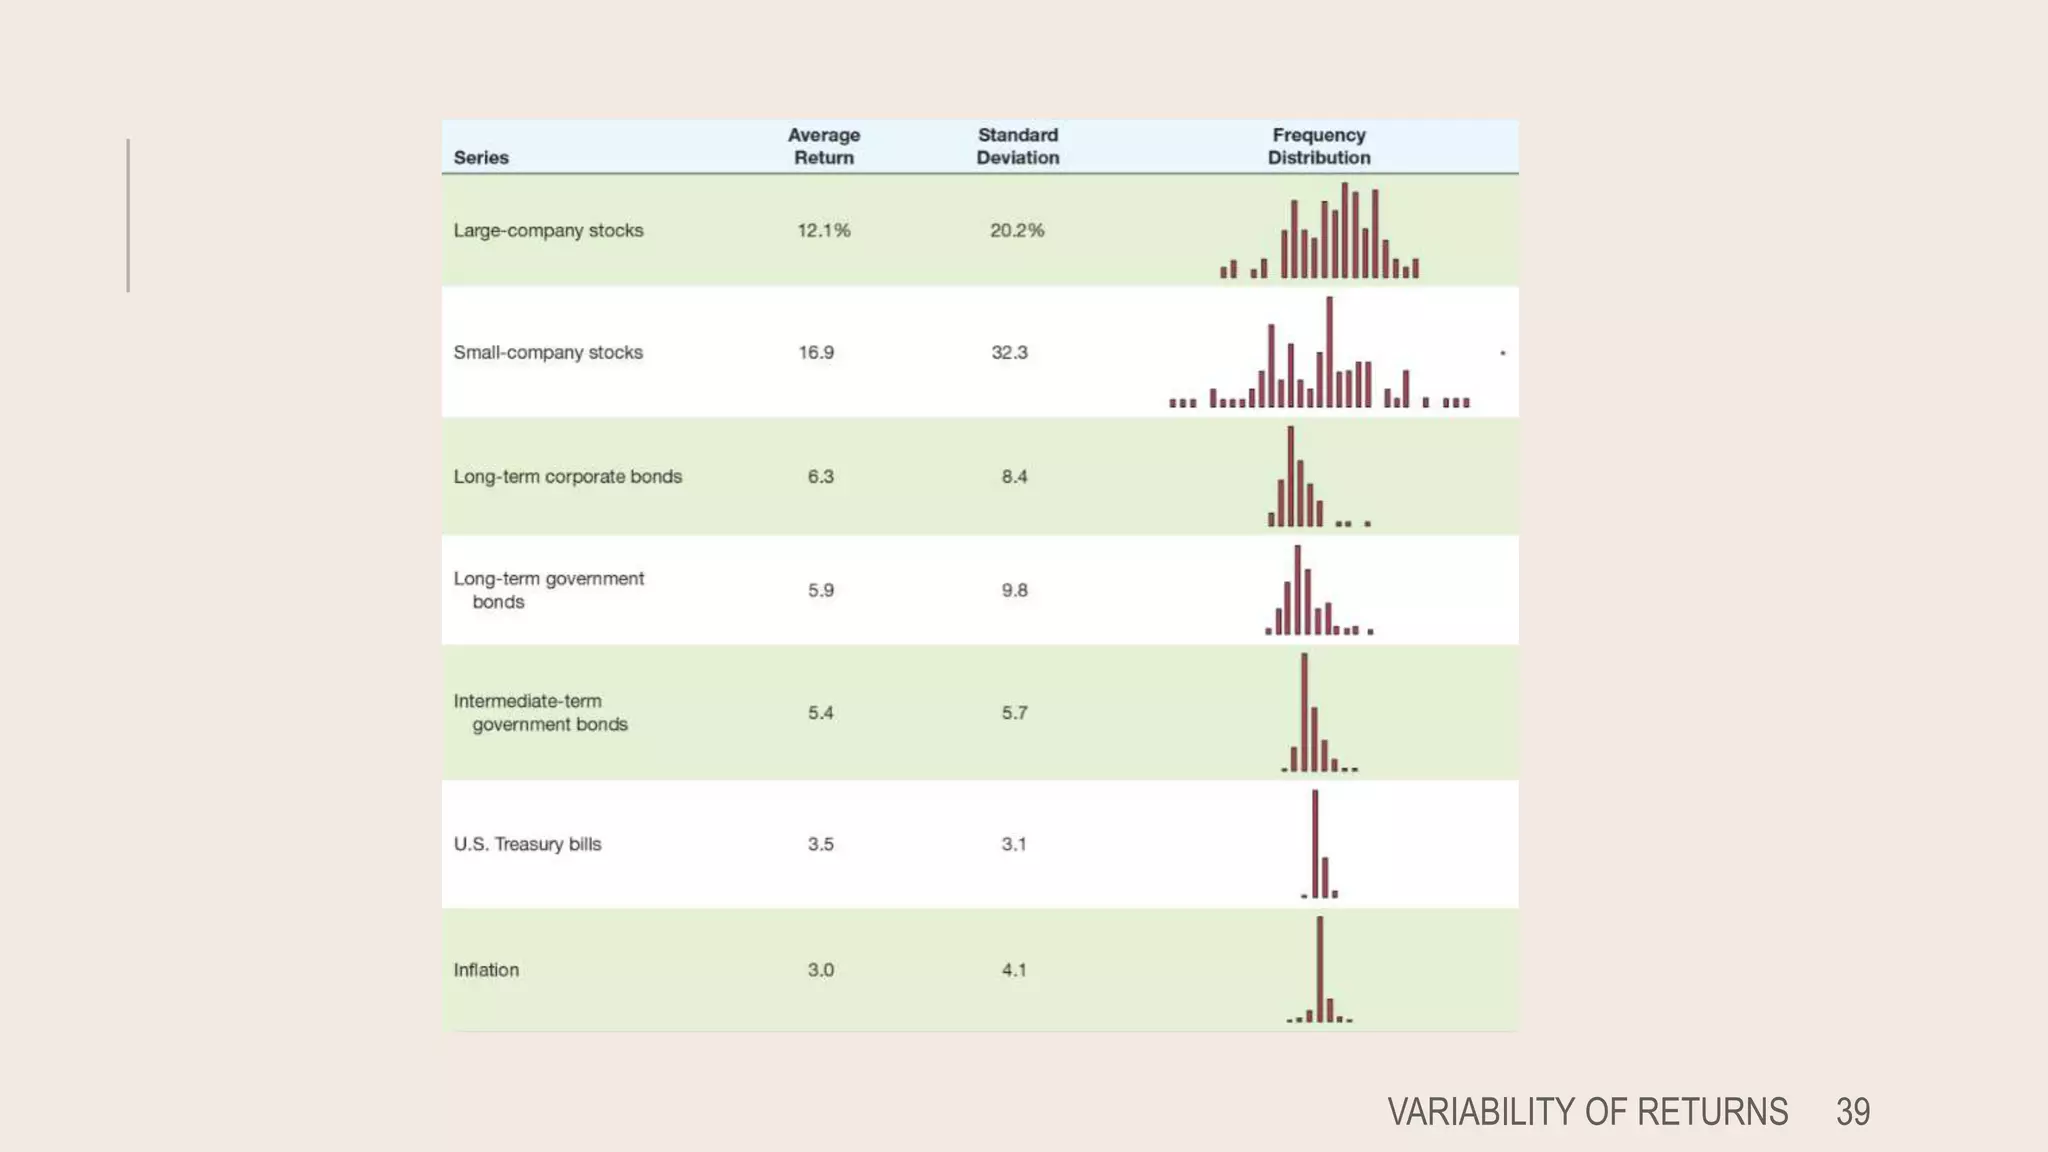

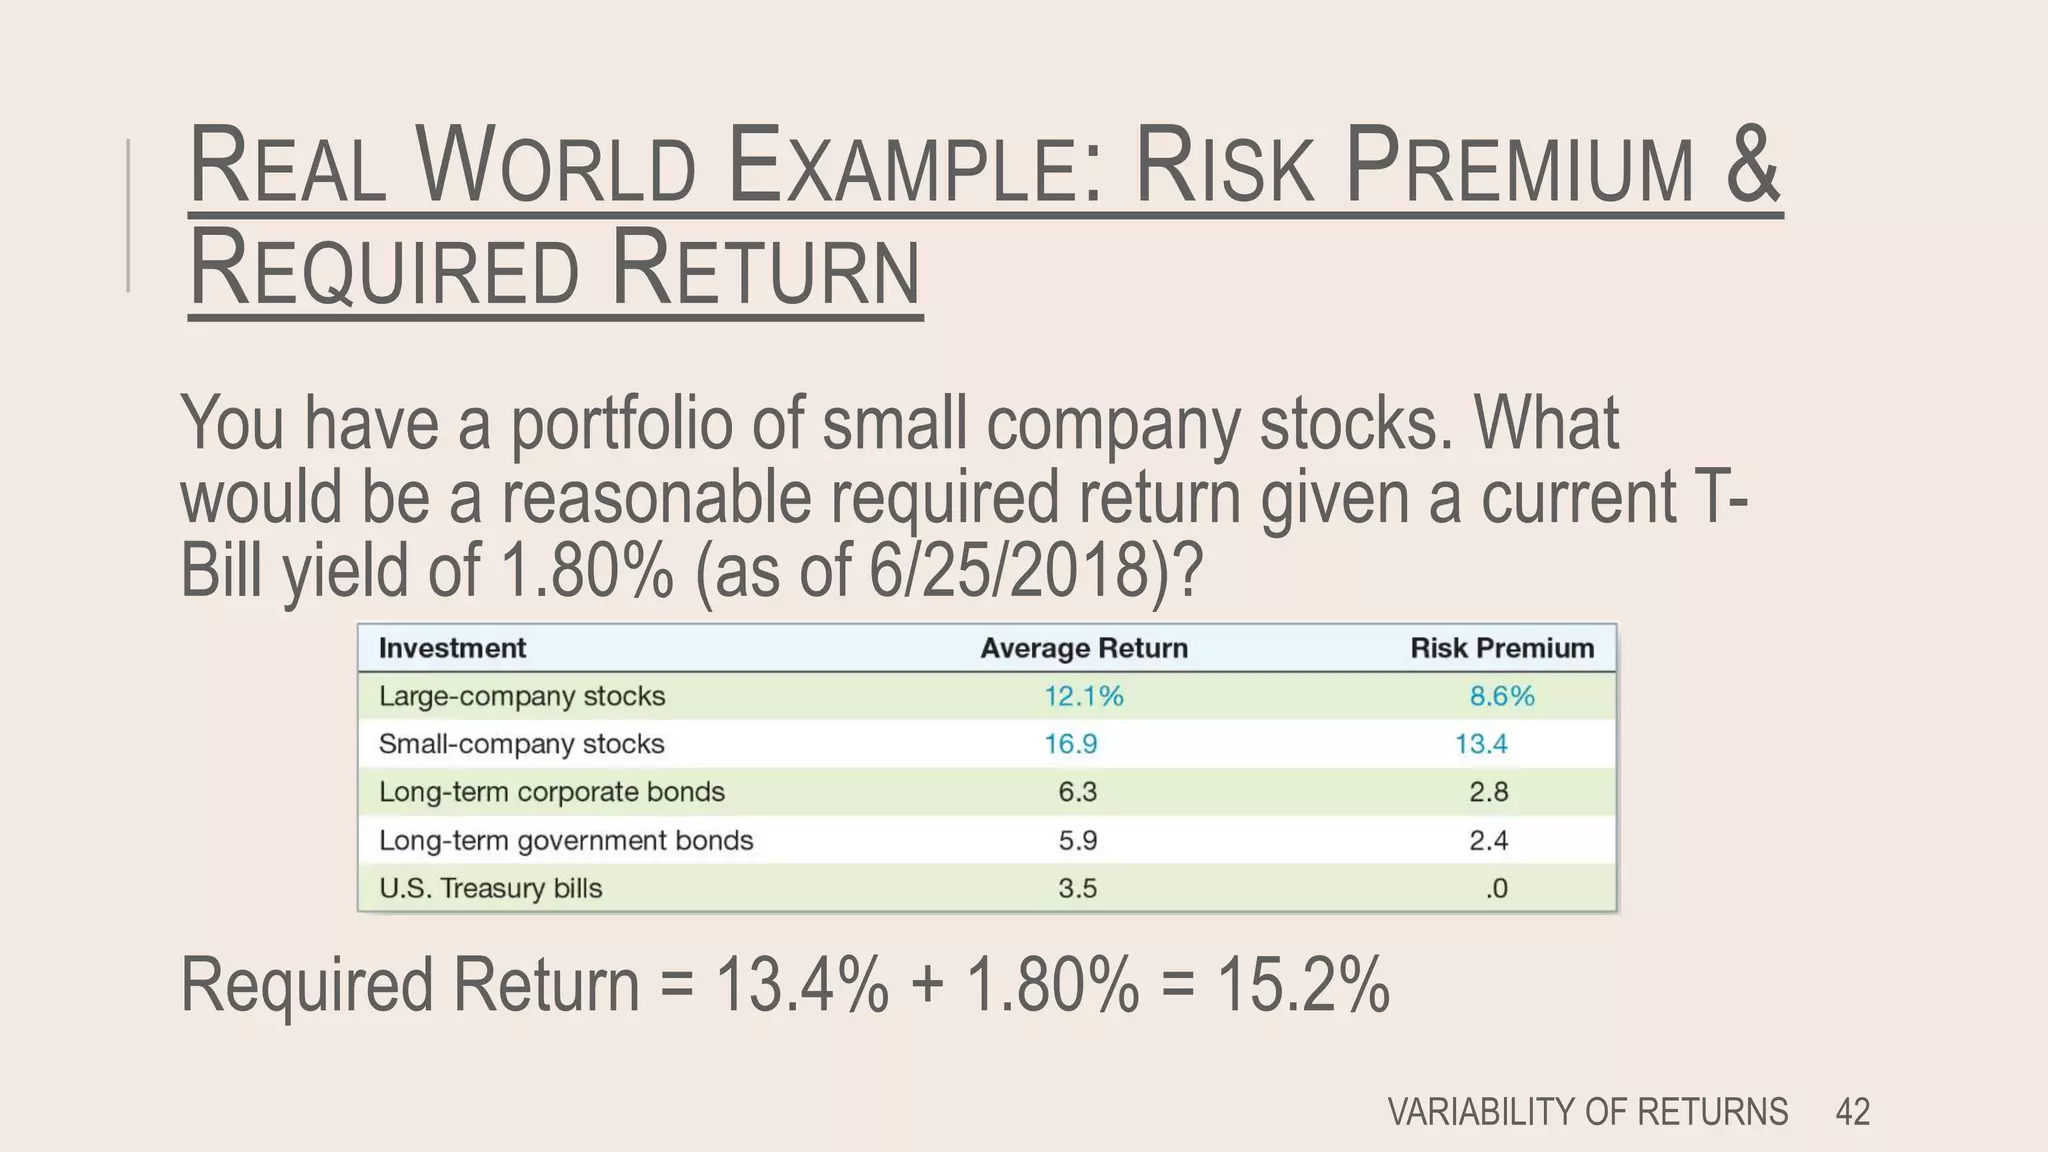


This document discusses lessons learned from capital market history. It finds that risky assets have historically earned a higher average return, known as a risk premium, compared to risk-free assets like Treasury bills. It also shows that higher risk investments have greater variability of returns, with potential for both higher gains and losses. The document contrasts arithmetic and geometric averages, noting geometric averages better account for compounding effects. Finally, it introduces the concept of market efficiency, where security prices quickly reflect all available public information.