Downloaded 13 times
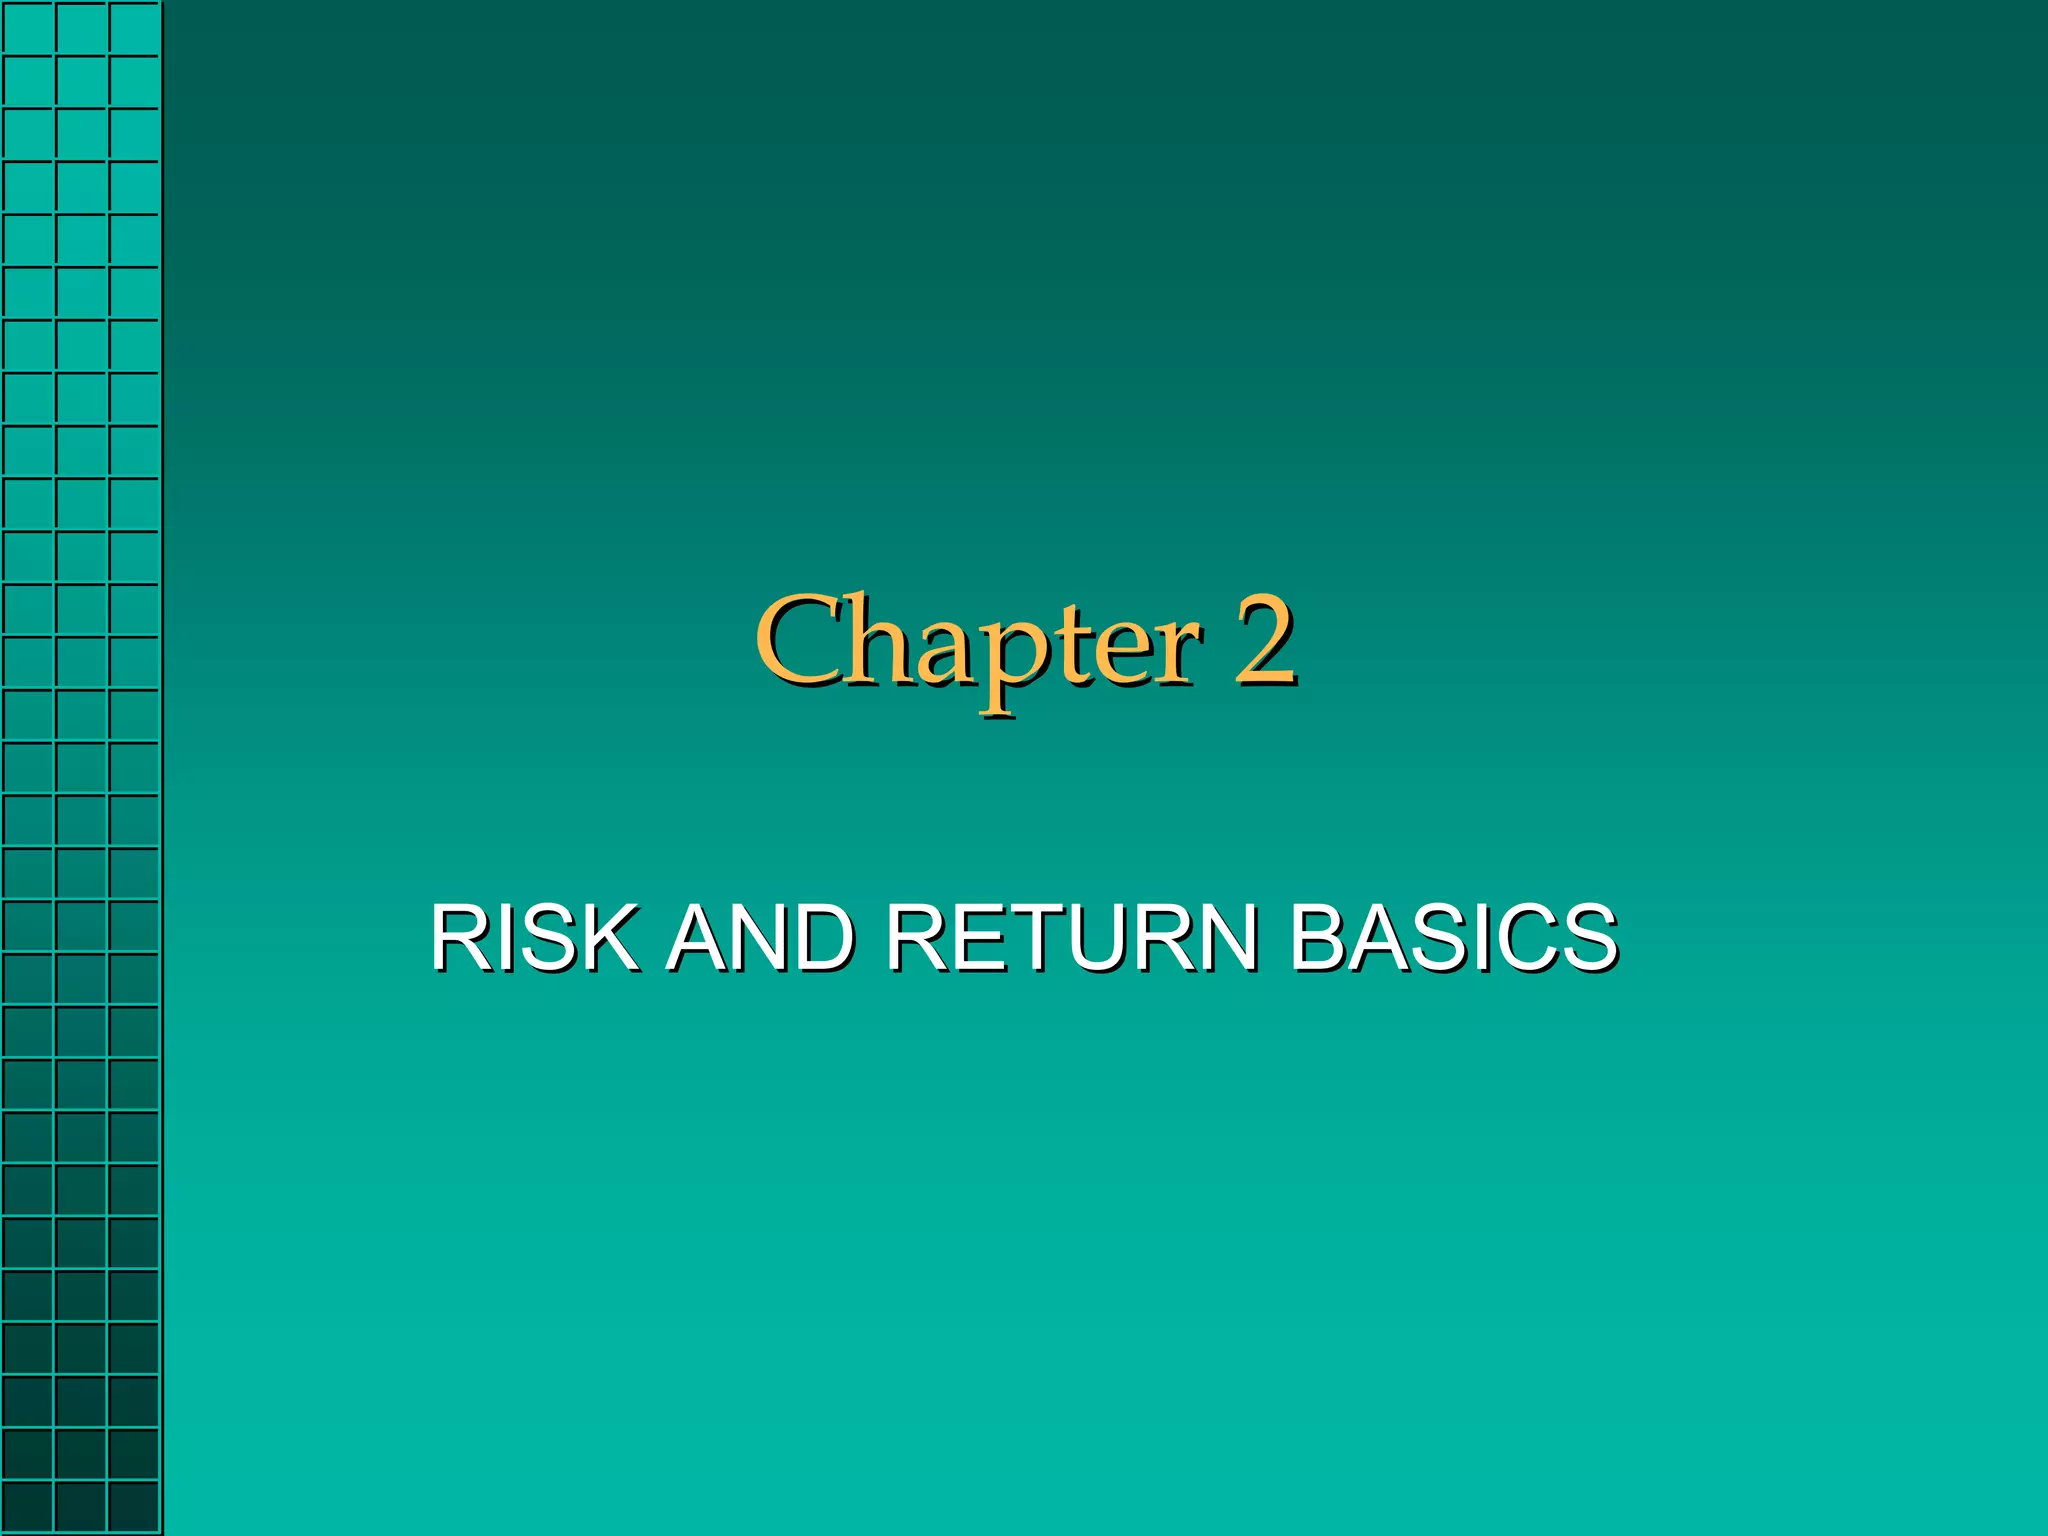
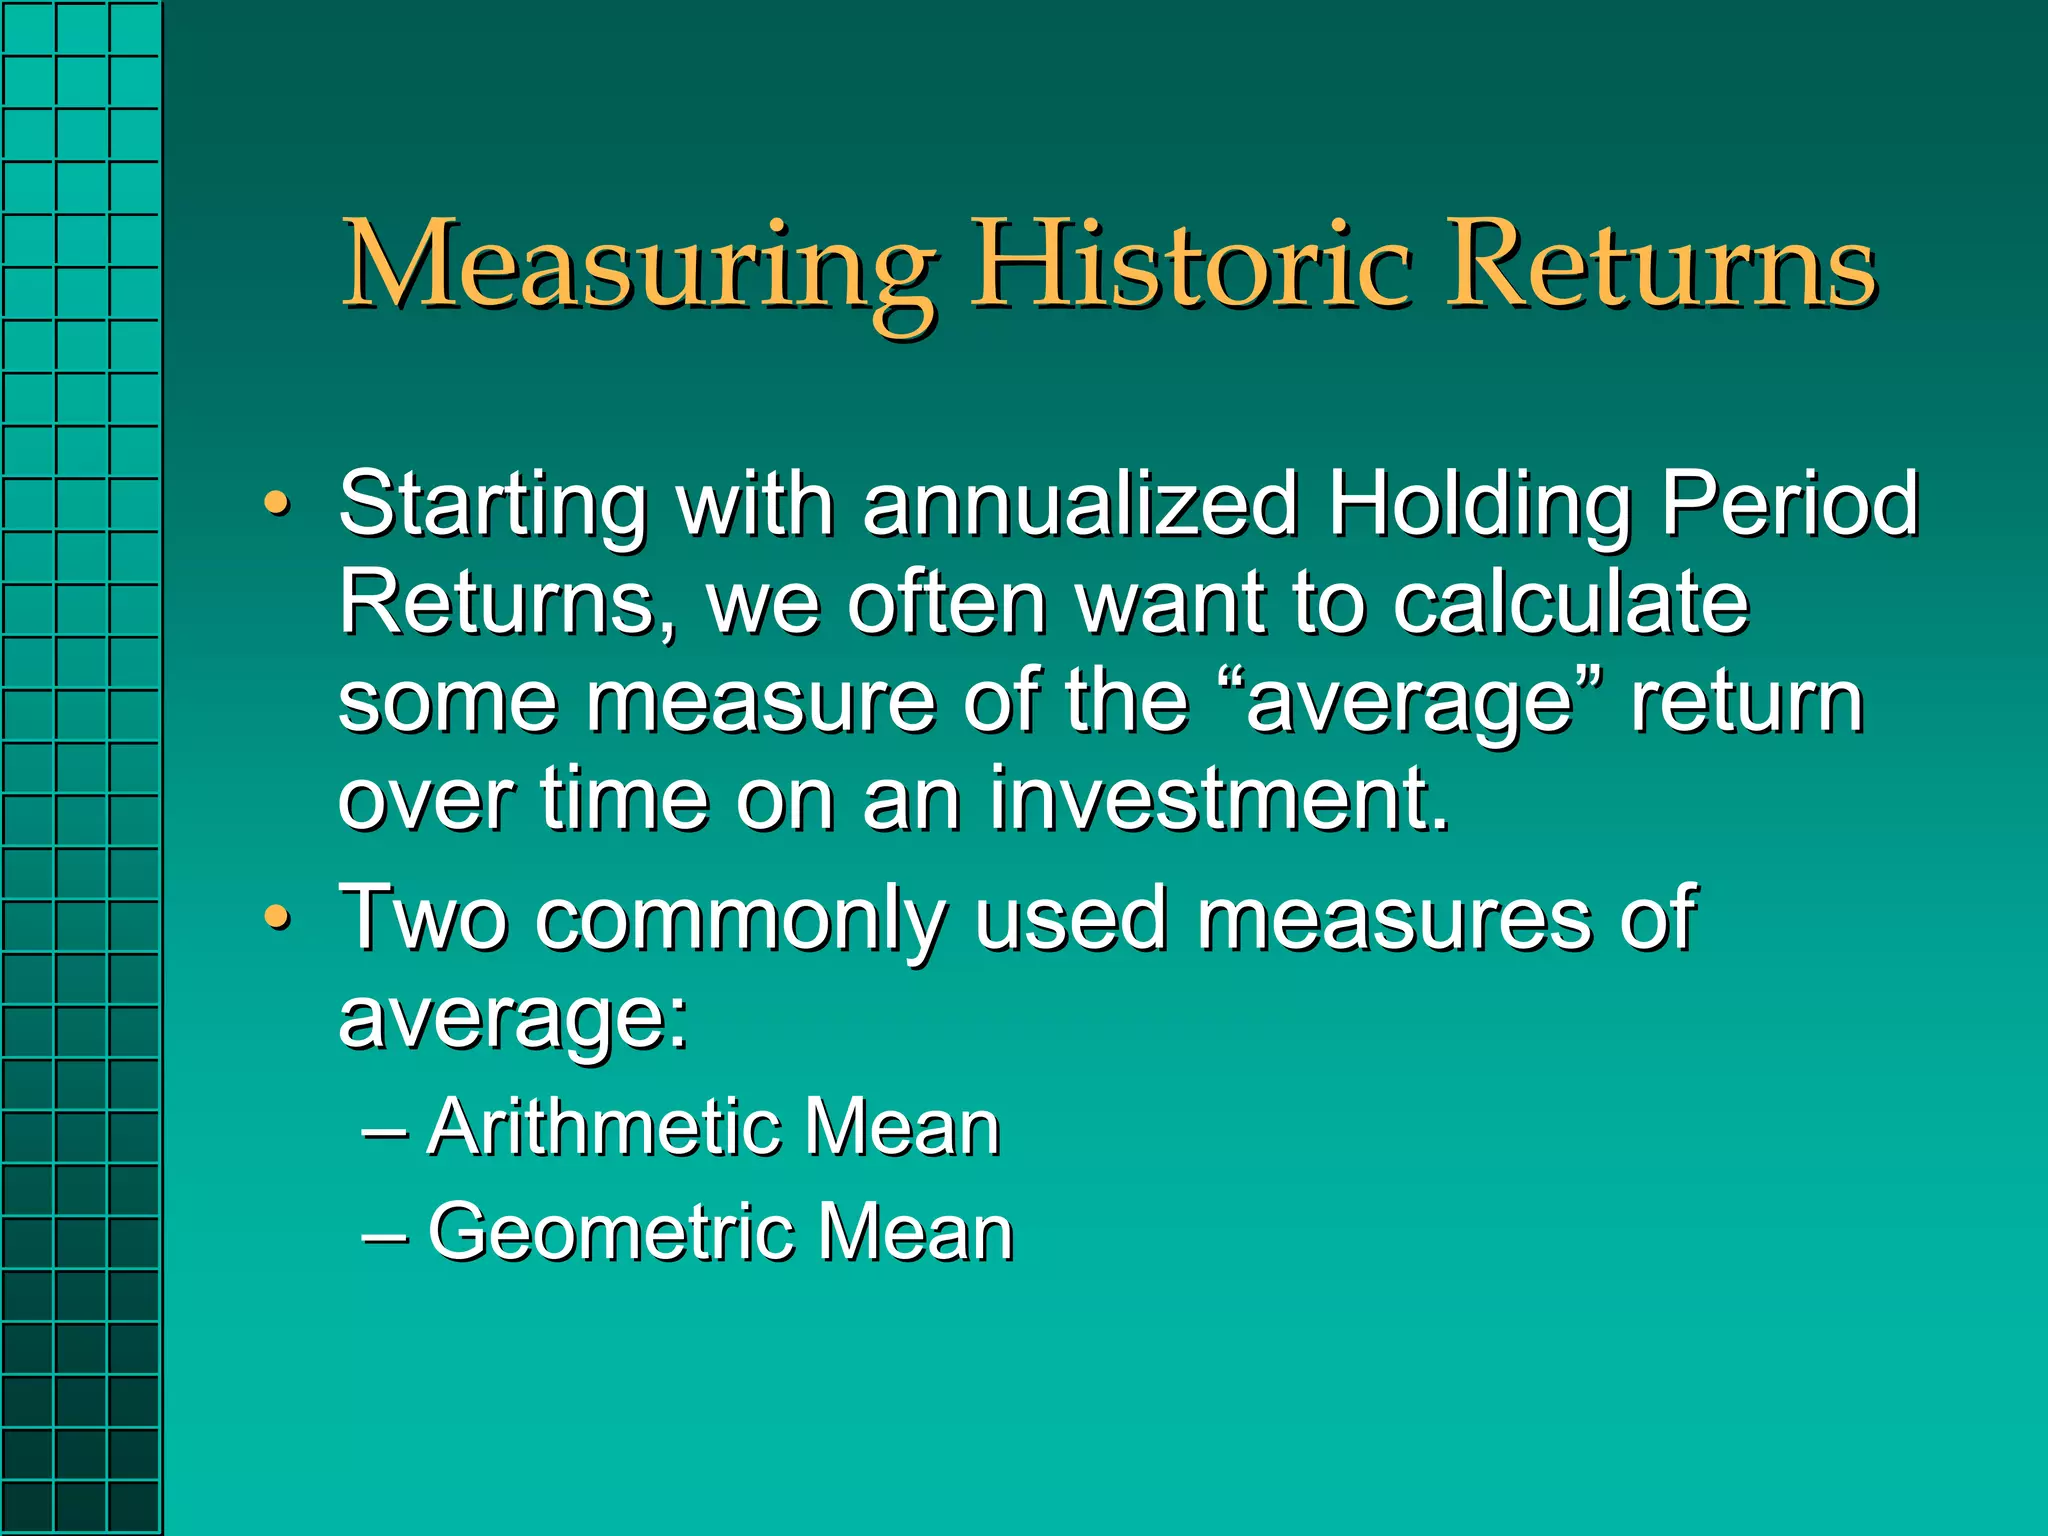
![Geometric Mean Return
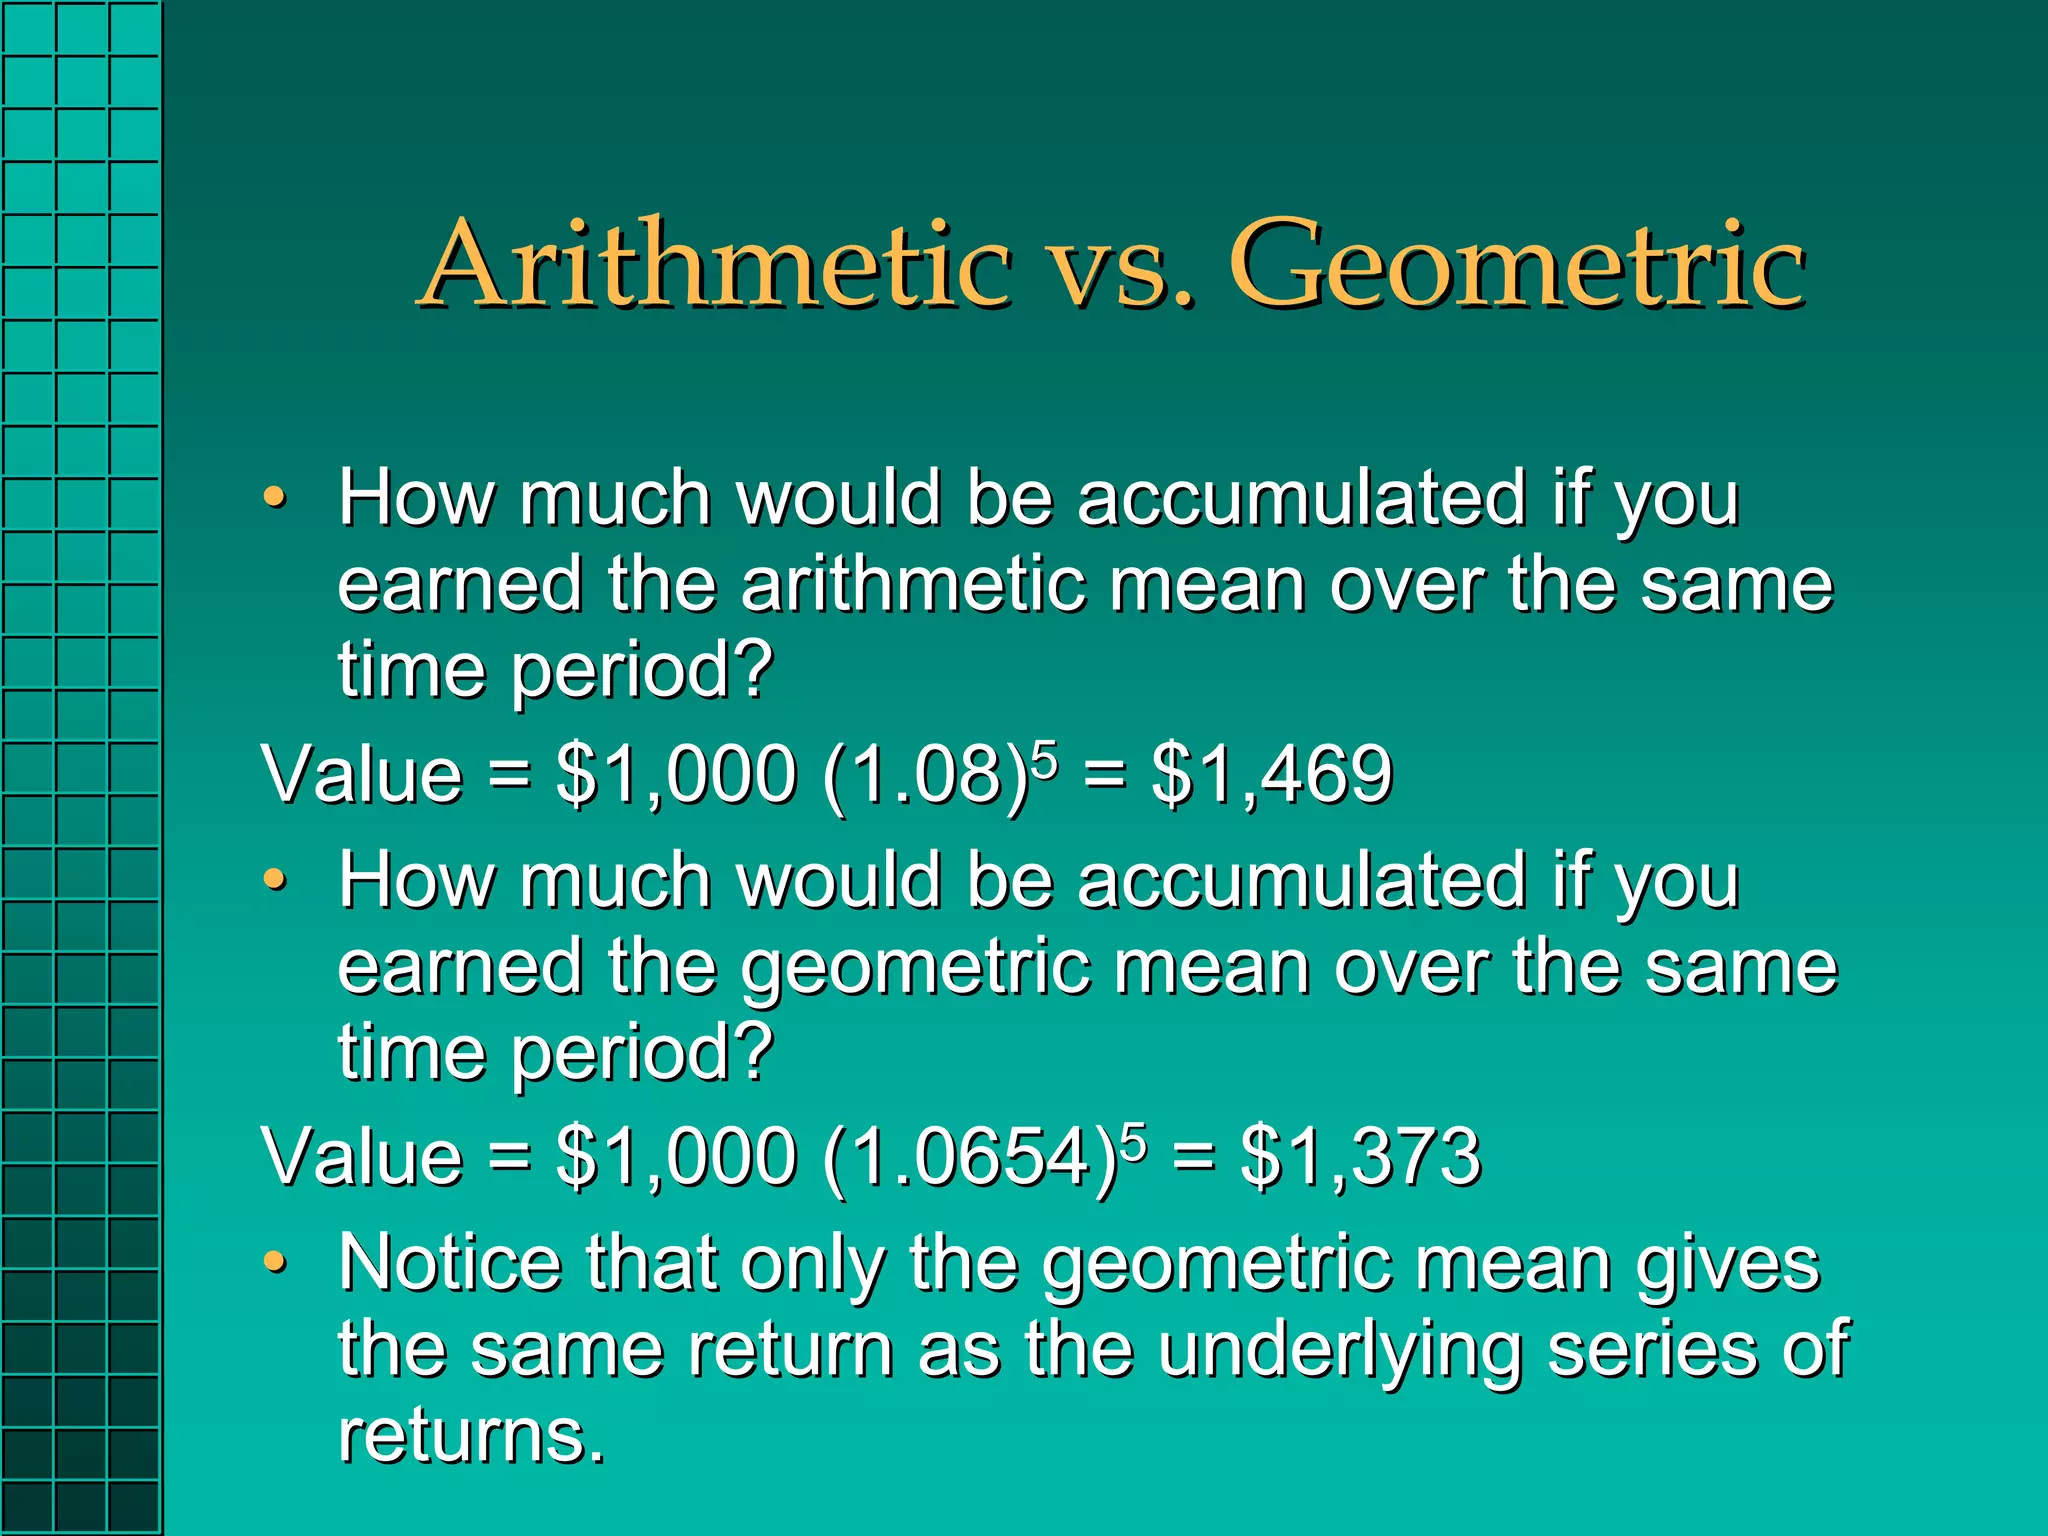
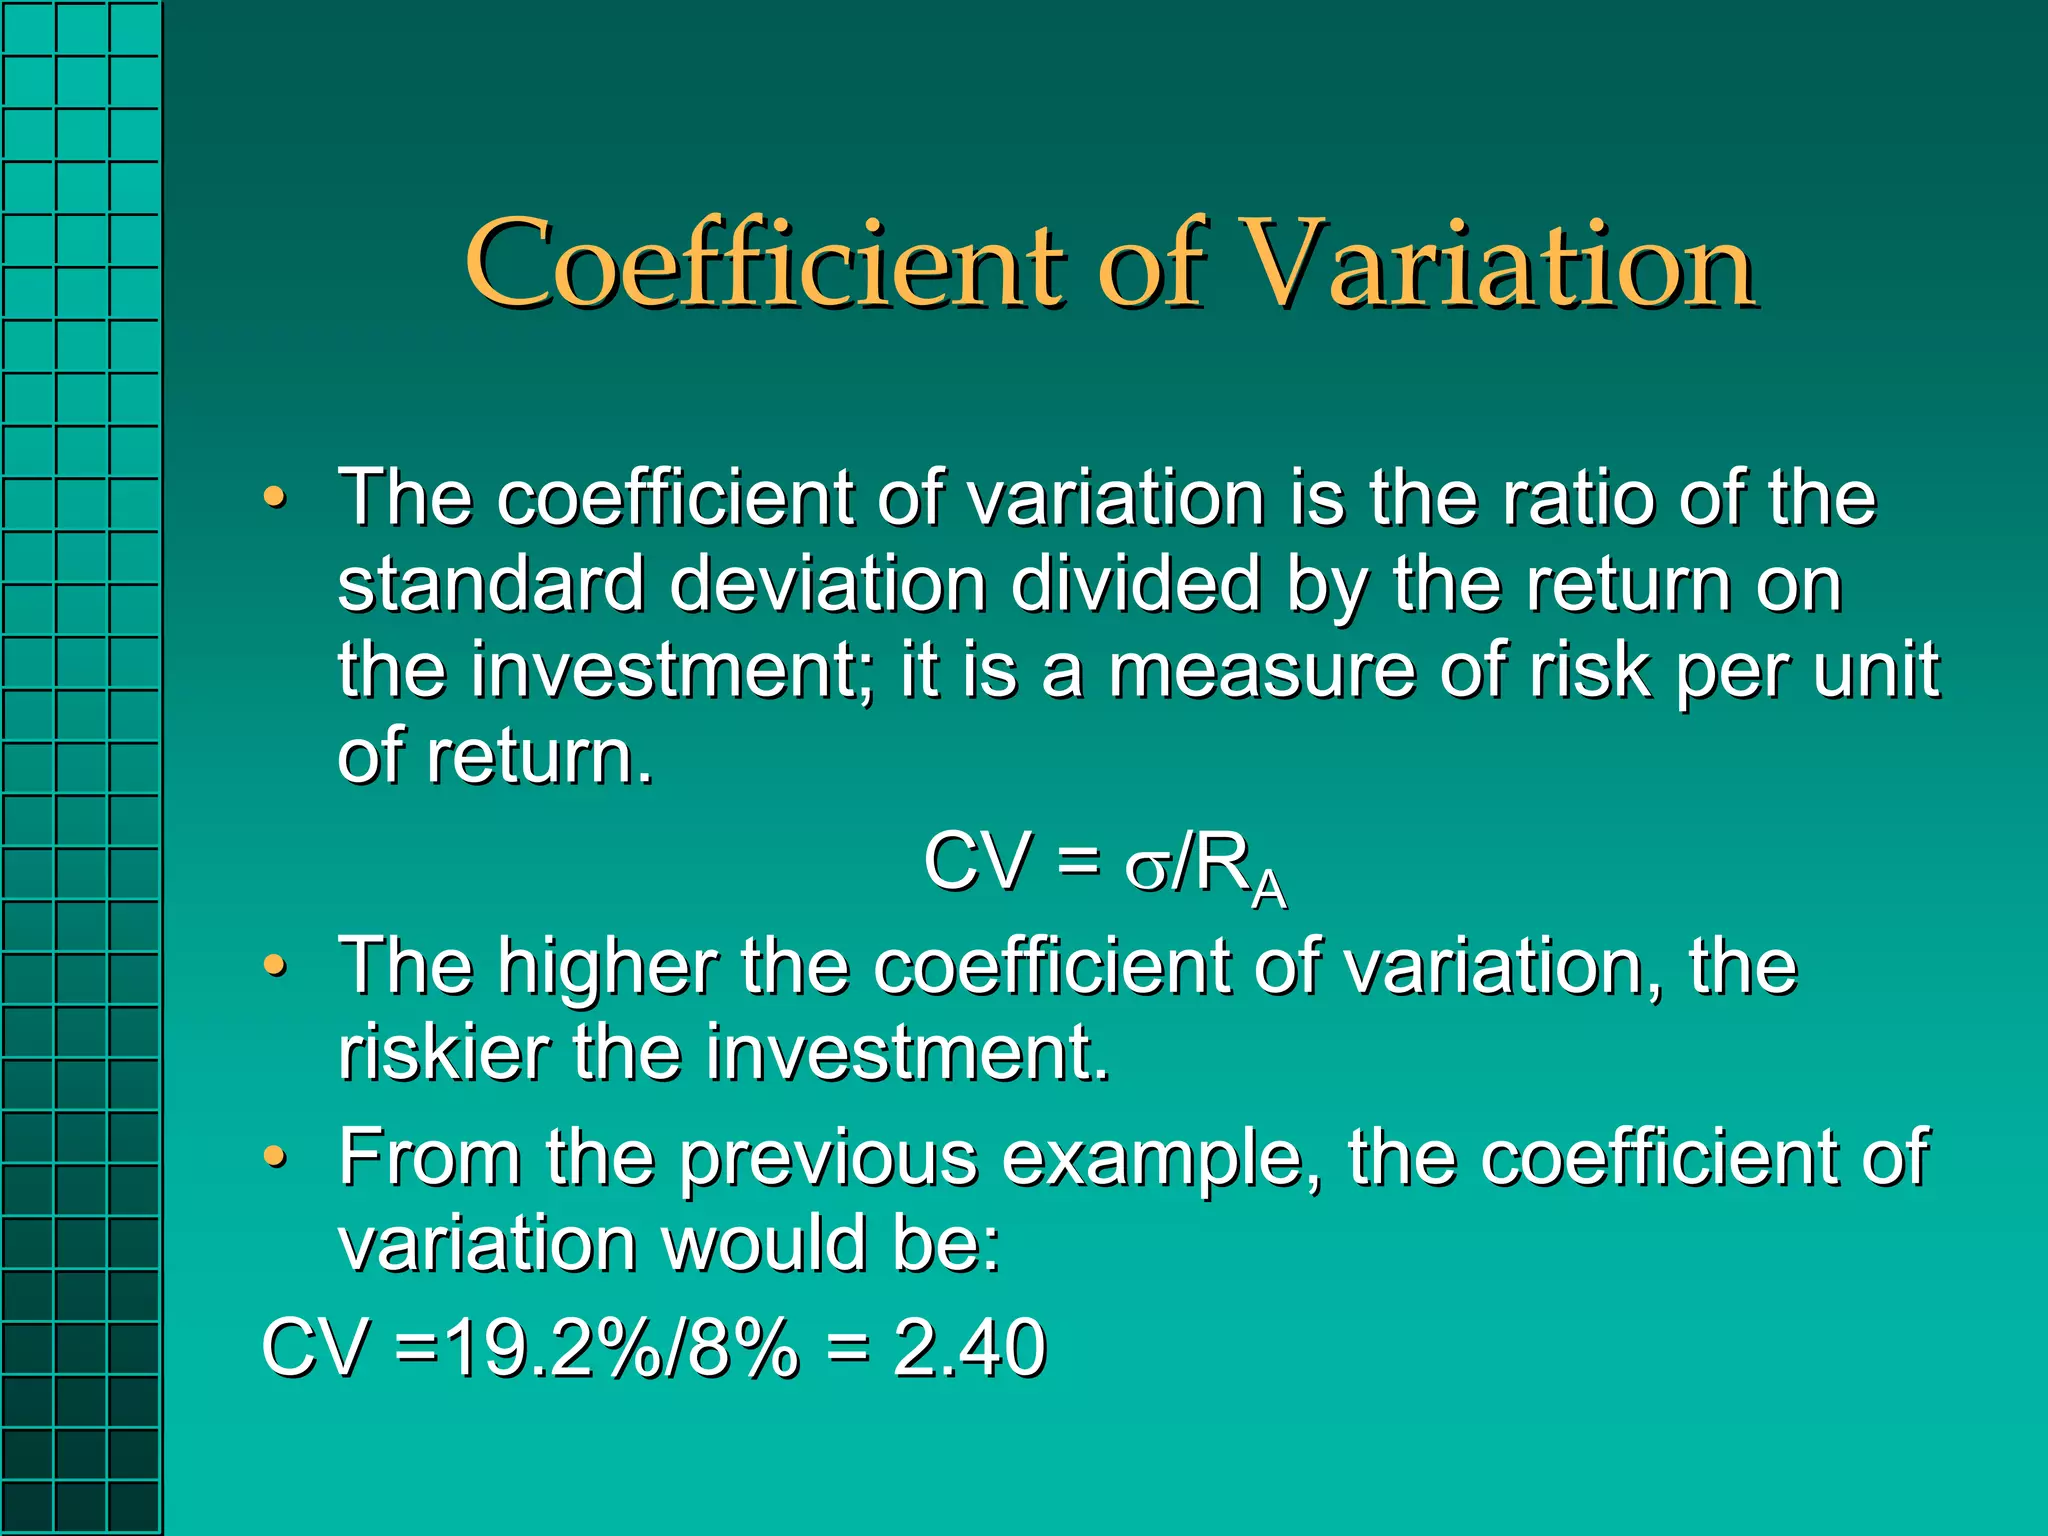
• The geometric mean is the one return that, if
earned in each of the n years of an
investment’s life, gives the same total dollar
result as the actual investment.
• It is calculated as the nth root of the product
of all of the n return relatives of the
investment.
RG = [Π(Return Relatives)]1/n – 1](https://image.slidesharecdn.com/chapter02-120313103915-phpapp01/75/417Chapter-02-12-2048.jpg)
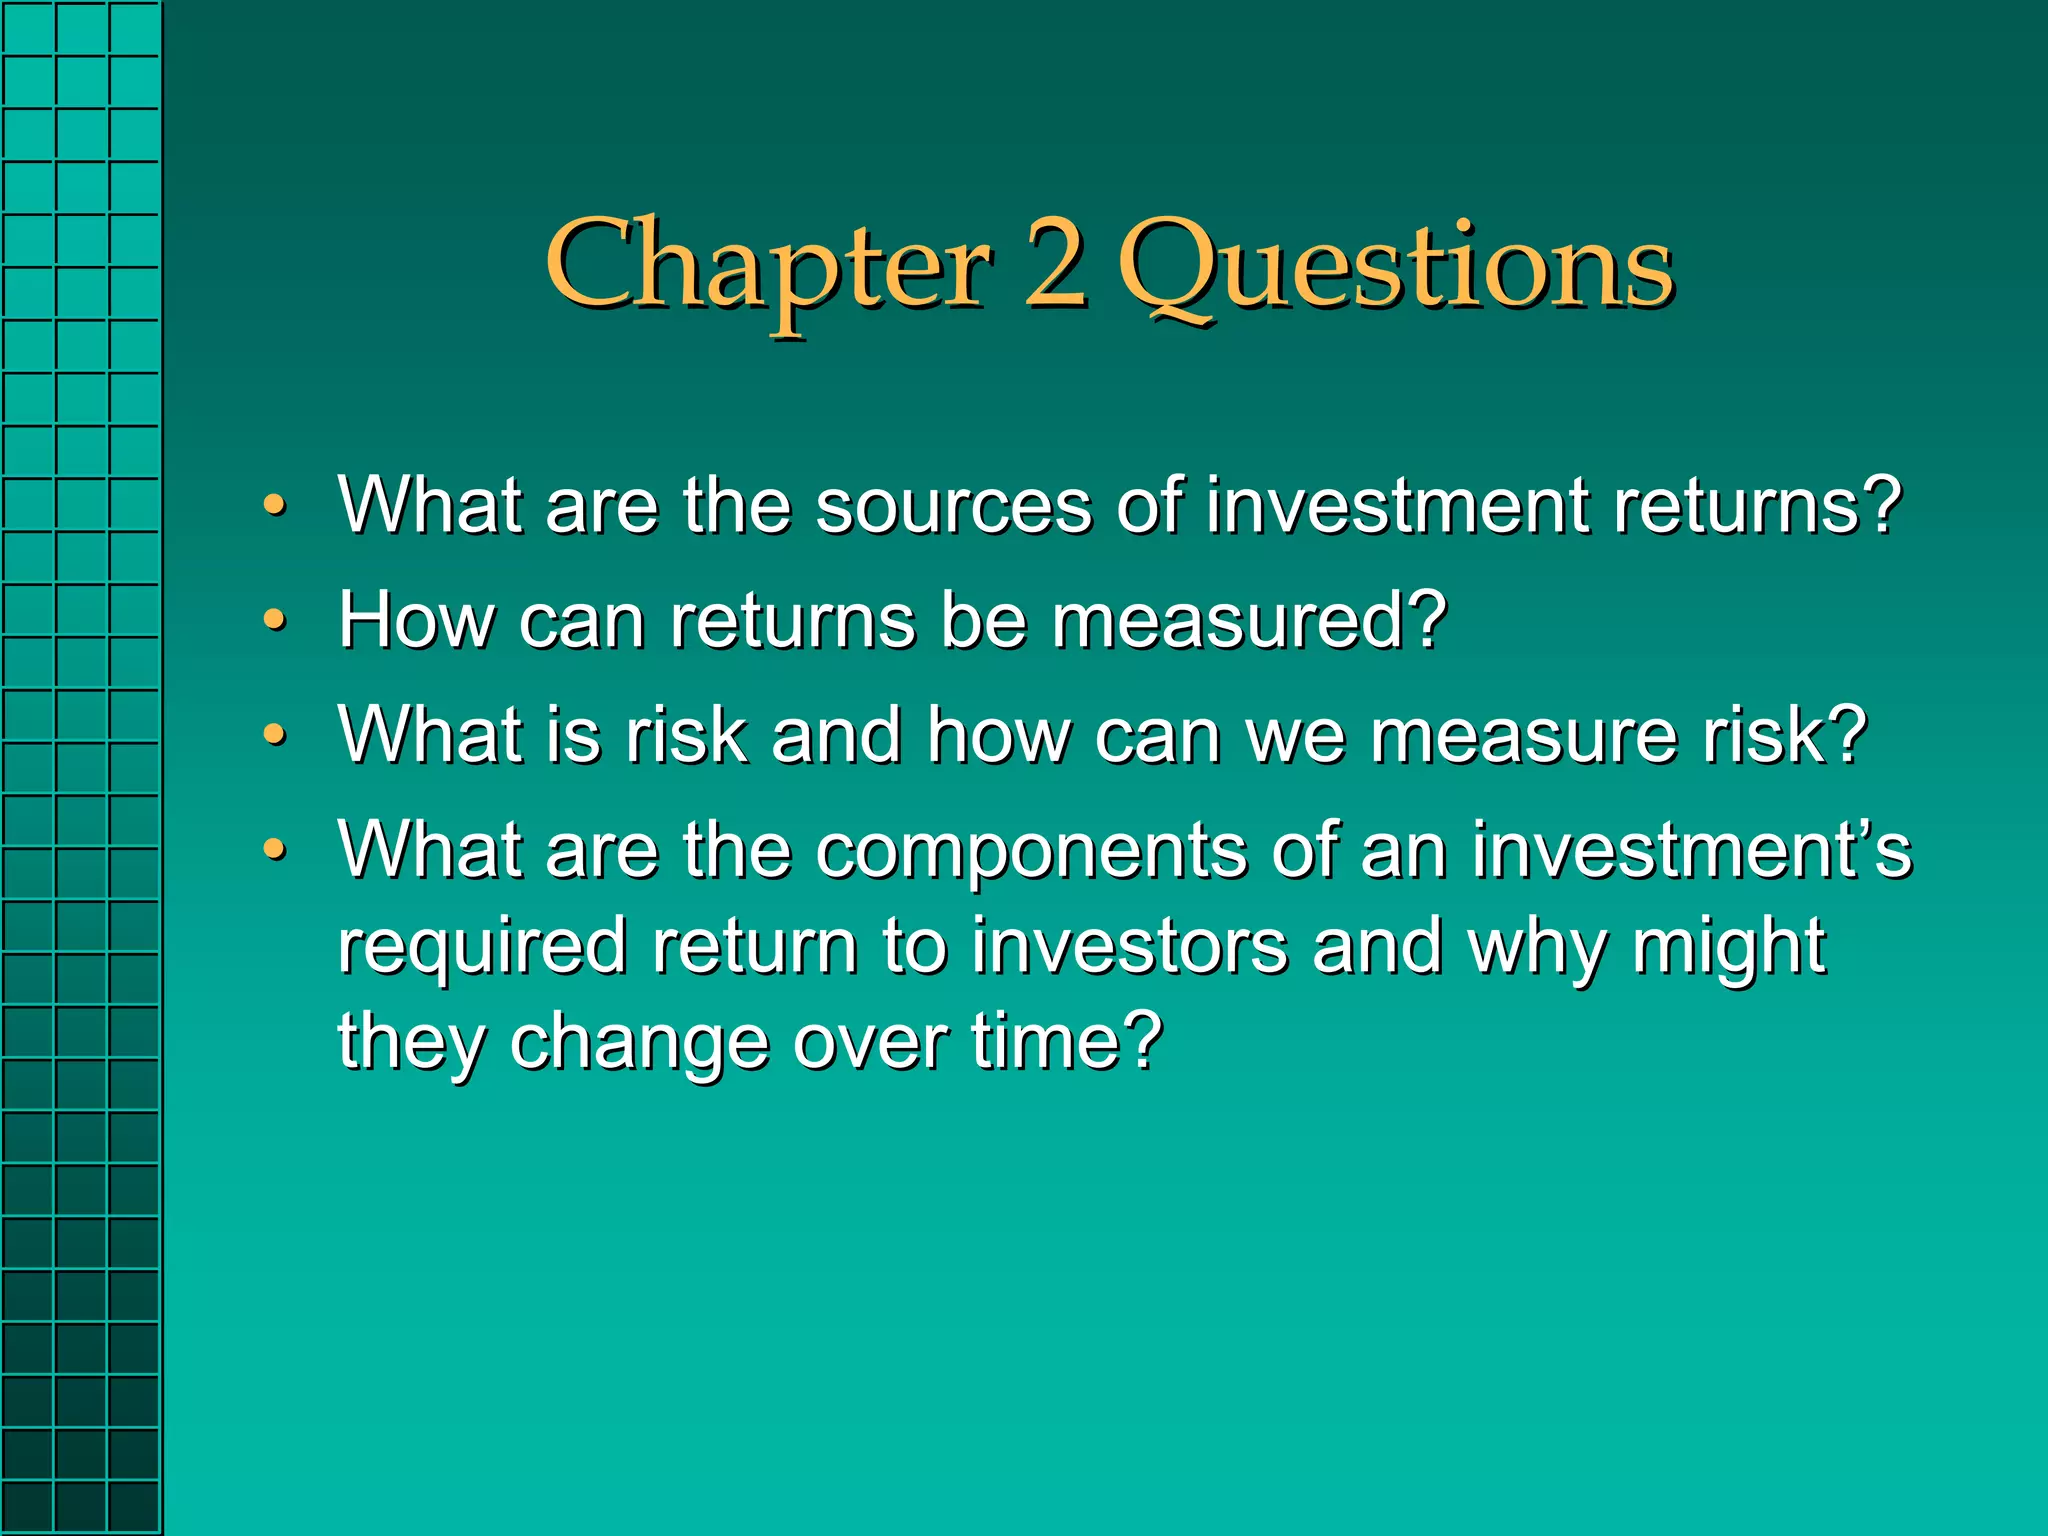
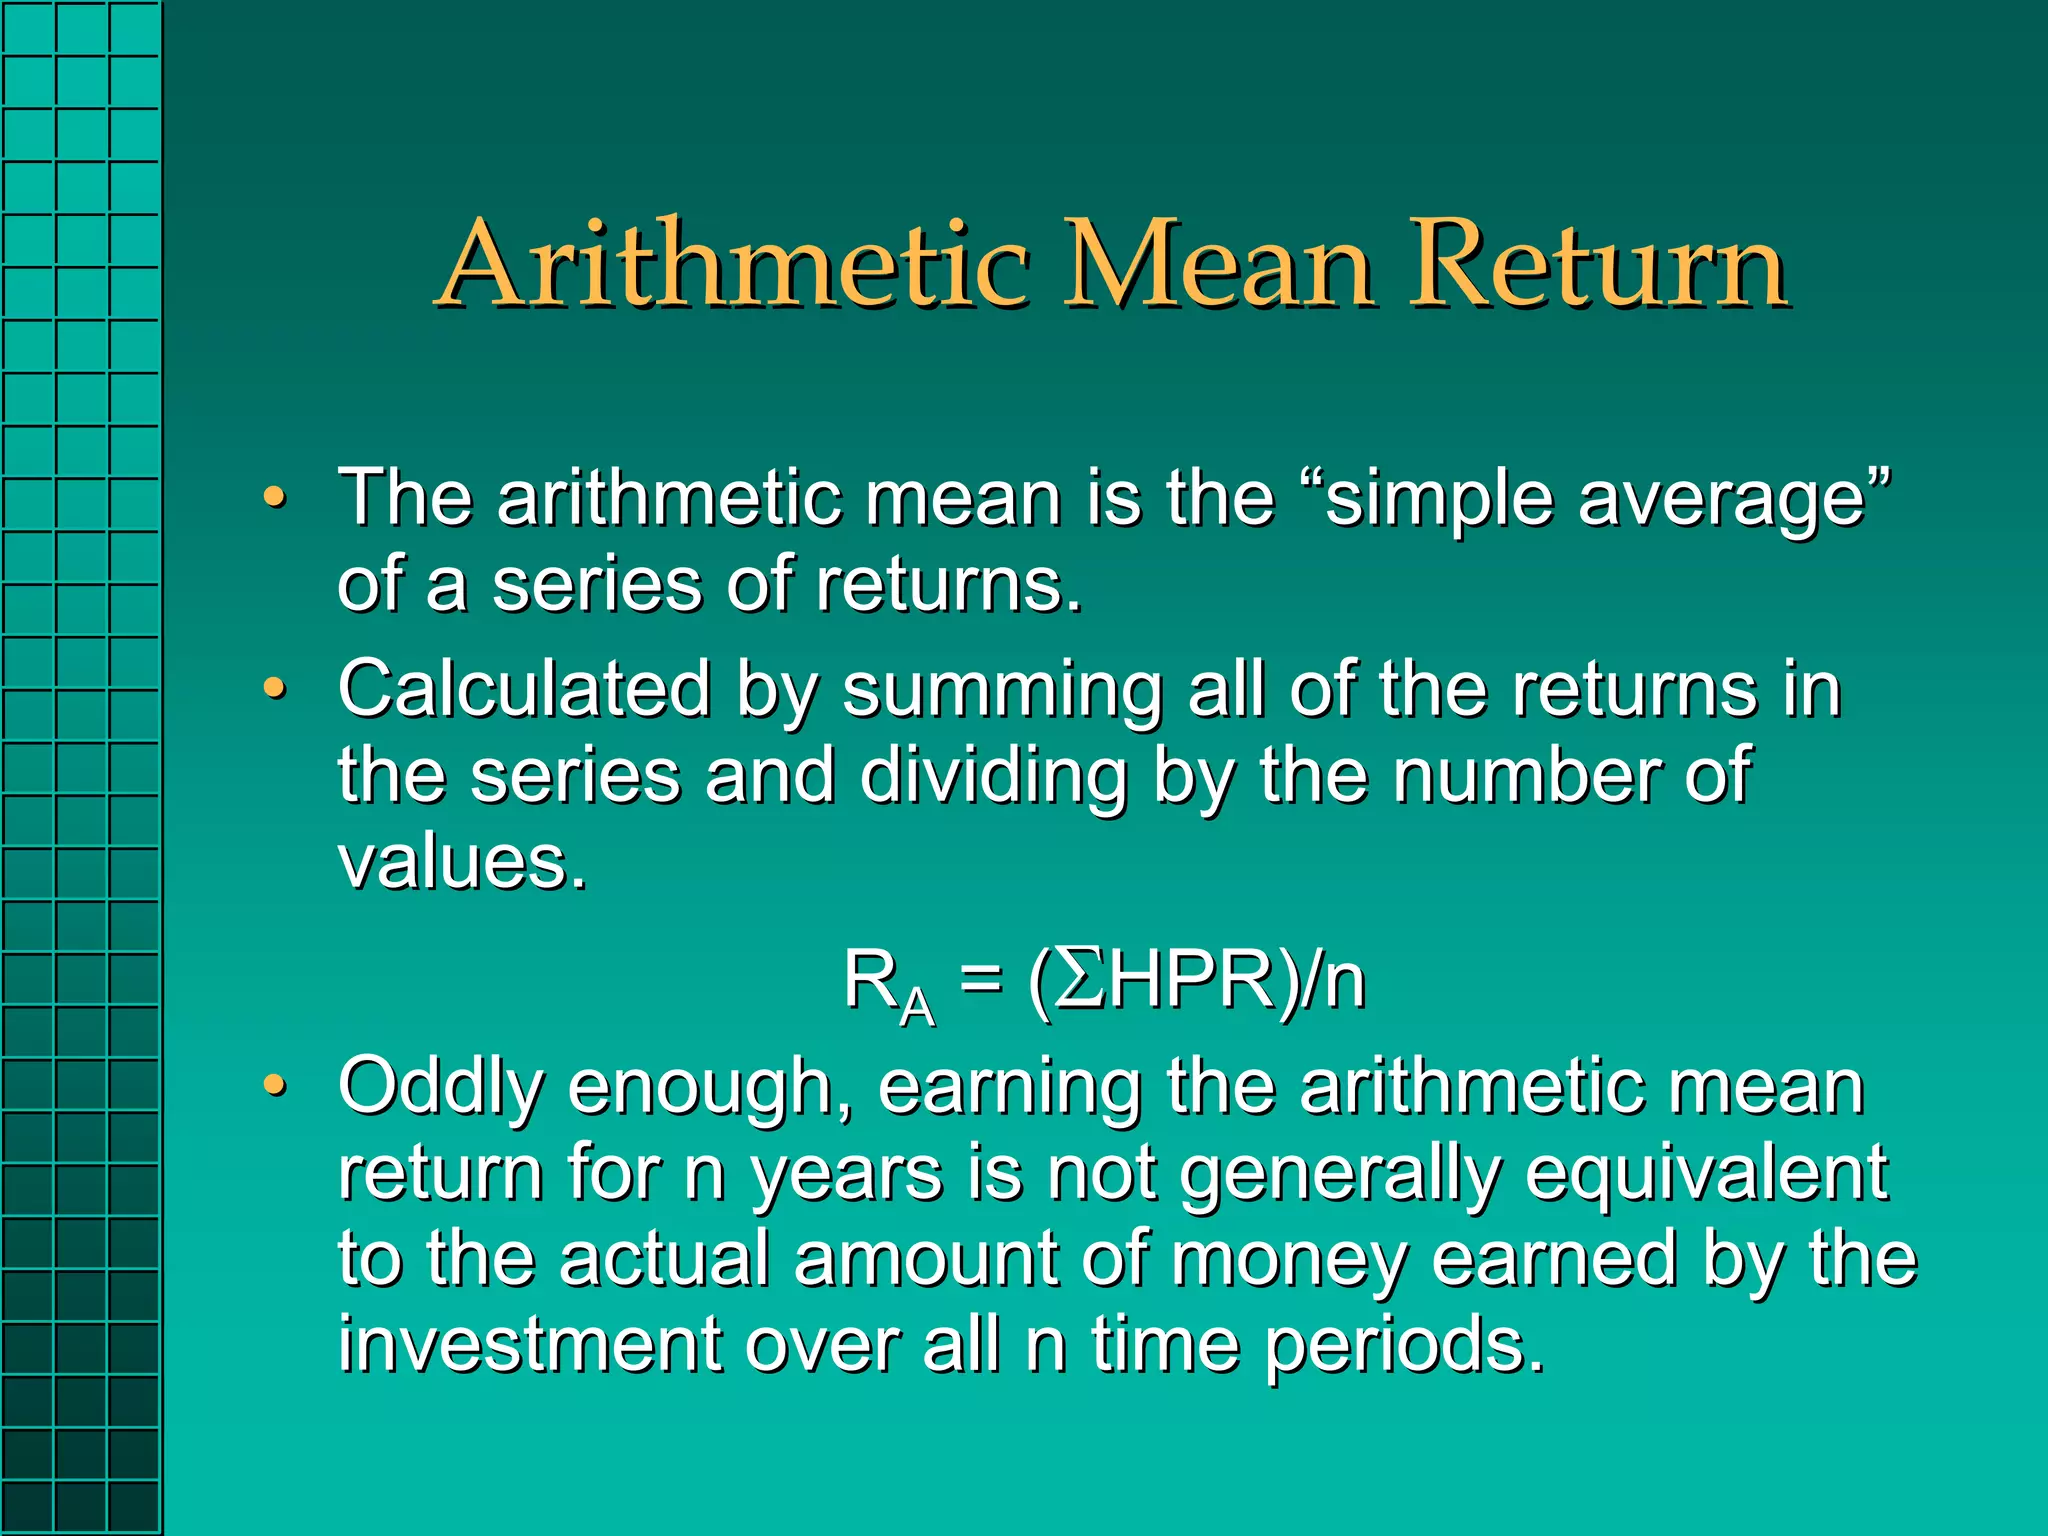
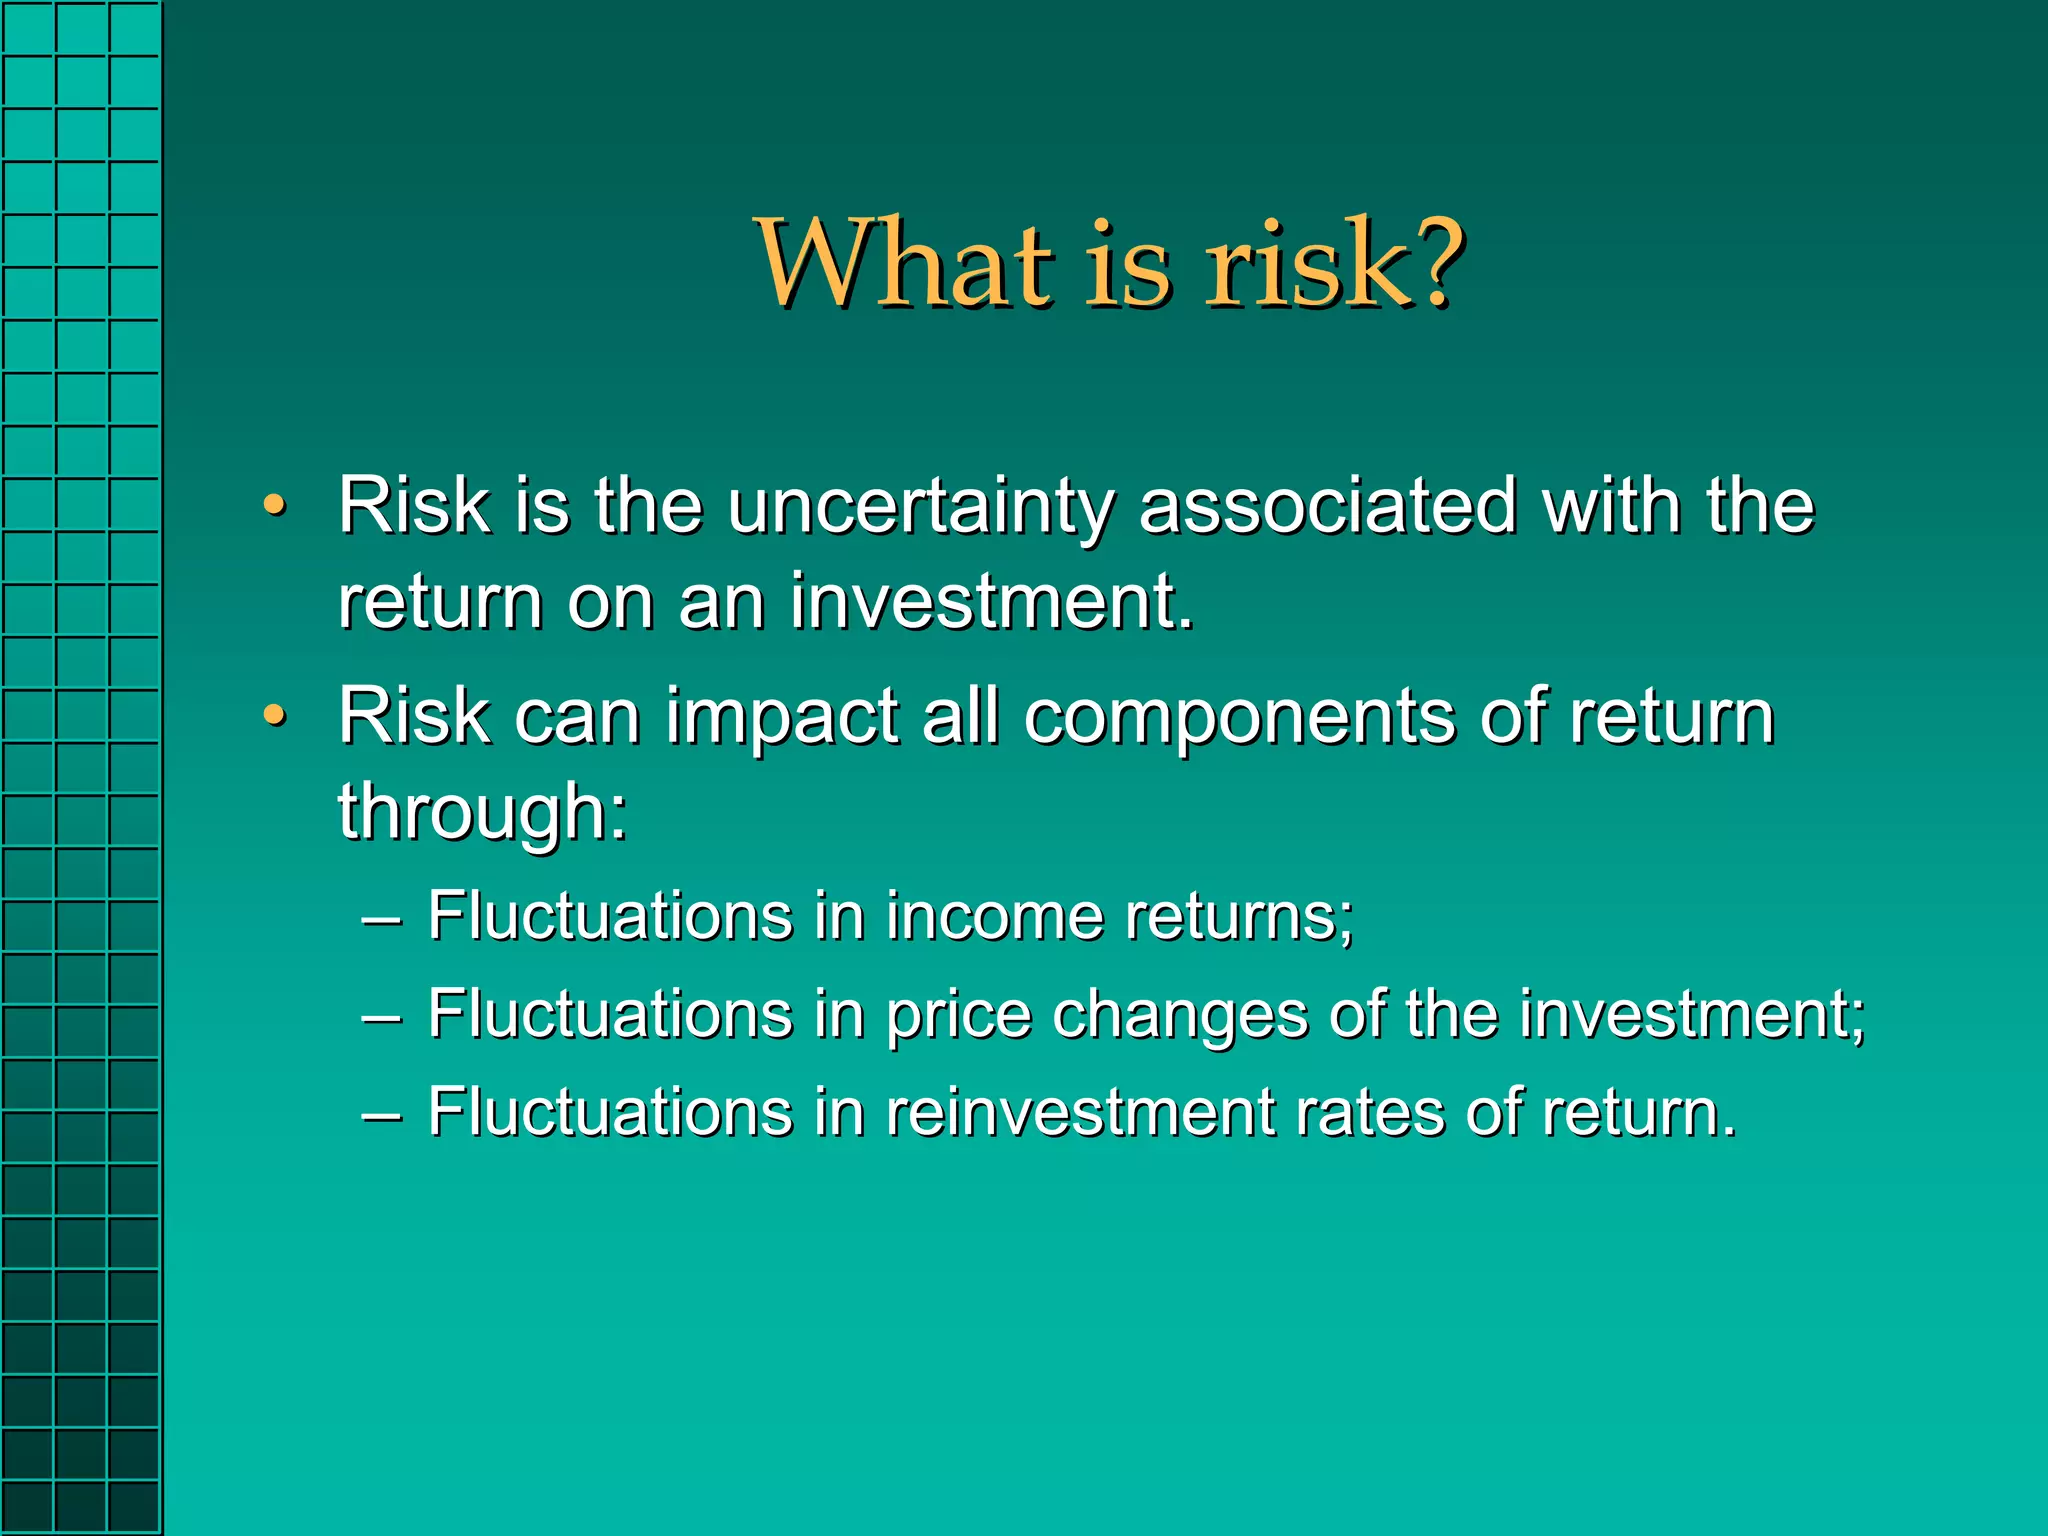
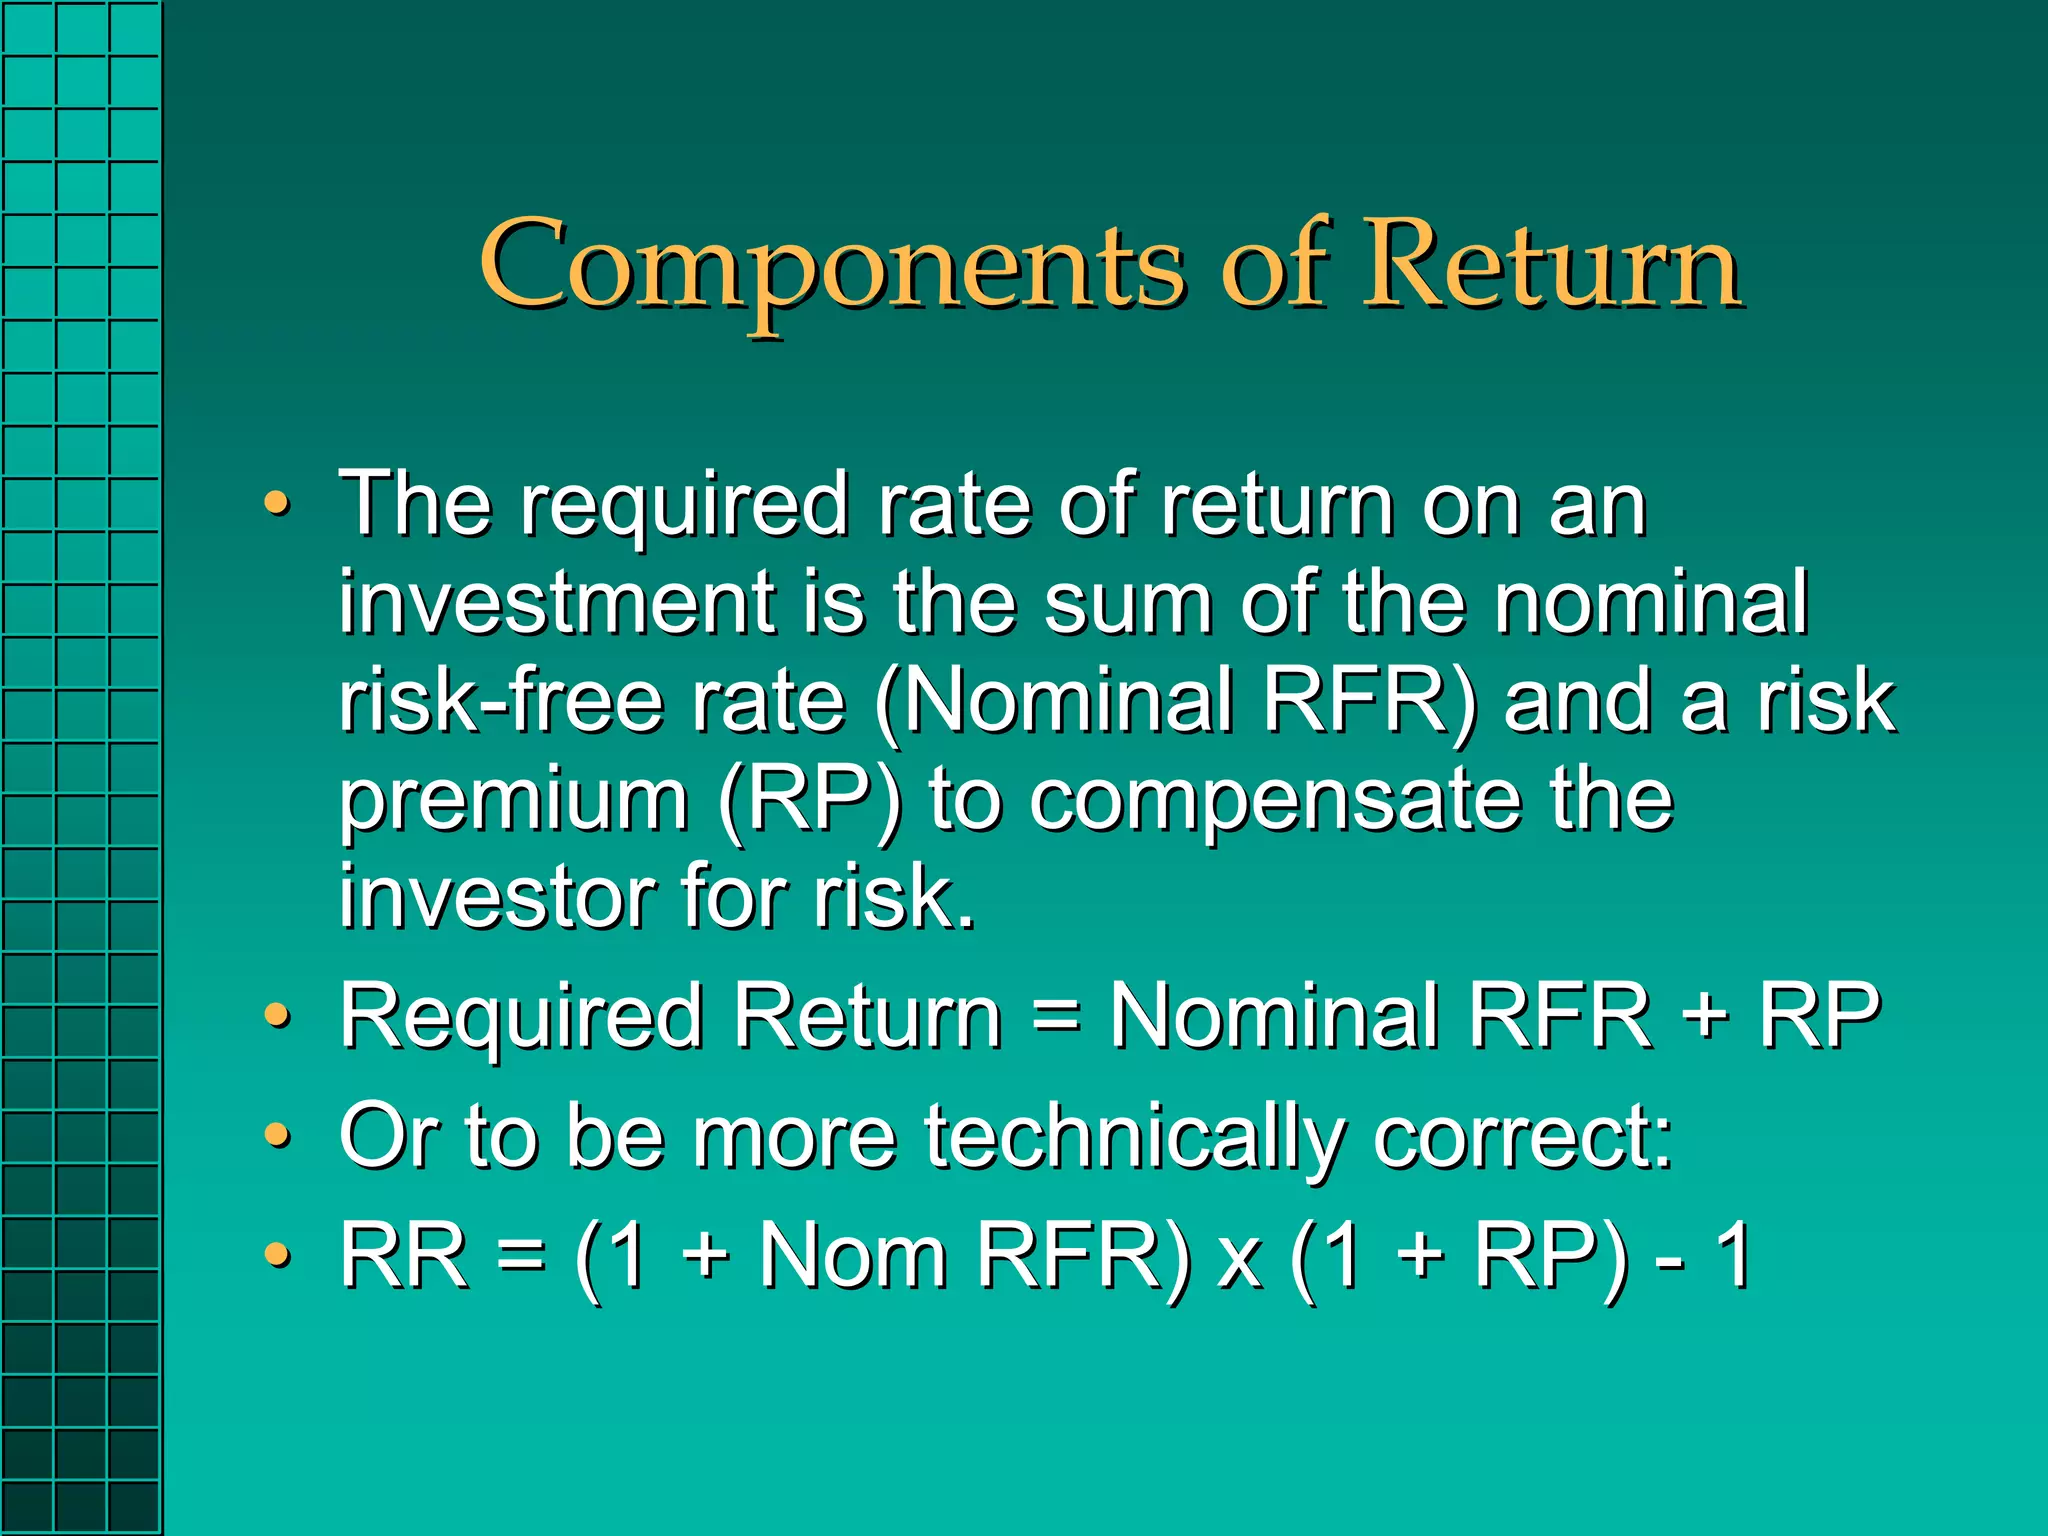
![Geometric Mean Example
Year Holding Period Return Return Relative
1 10% 1.10
2 30% 1.30
3 -20% 0.80
4 0% 1.00
5 20% 1.20
RG = [(1.10)(1.30)(.80)(1.00)(1.20)]1/5 – 1
RG = .0654 or 6.54%](https://image.slidesharecdn.com/chapter02-120313103915-phpapp01/75/417Chapter-02-13-2048.jpg)

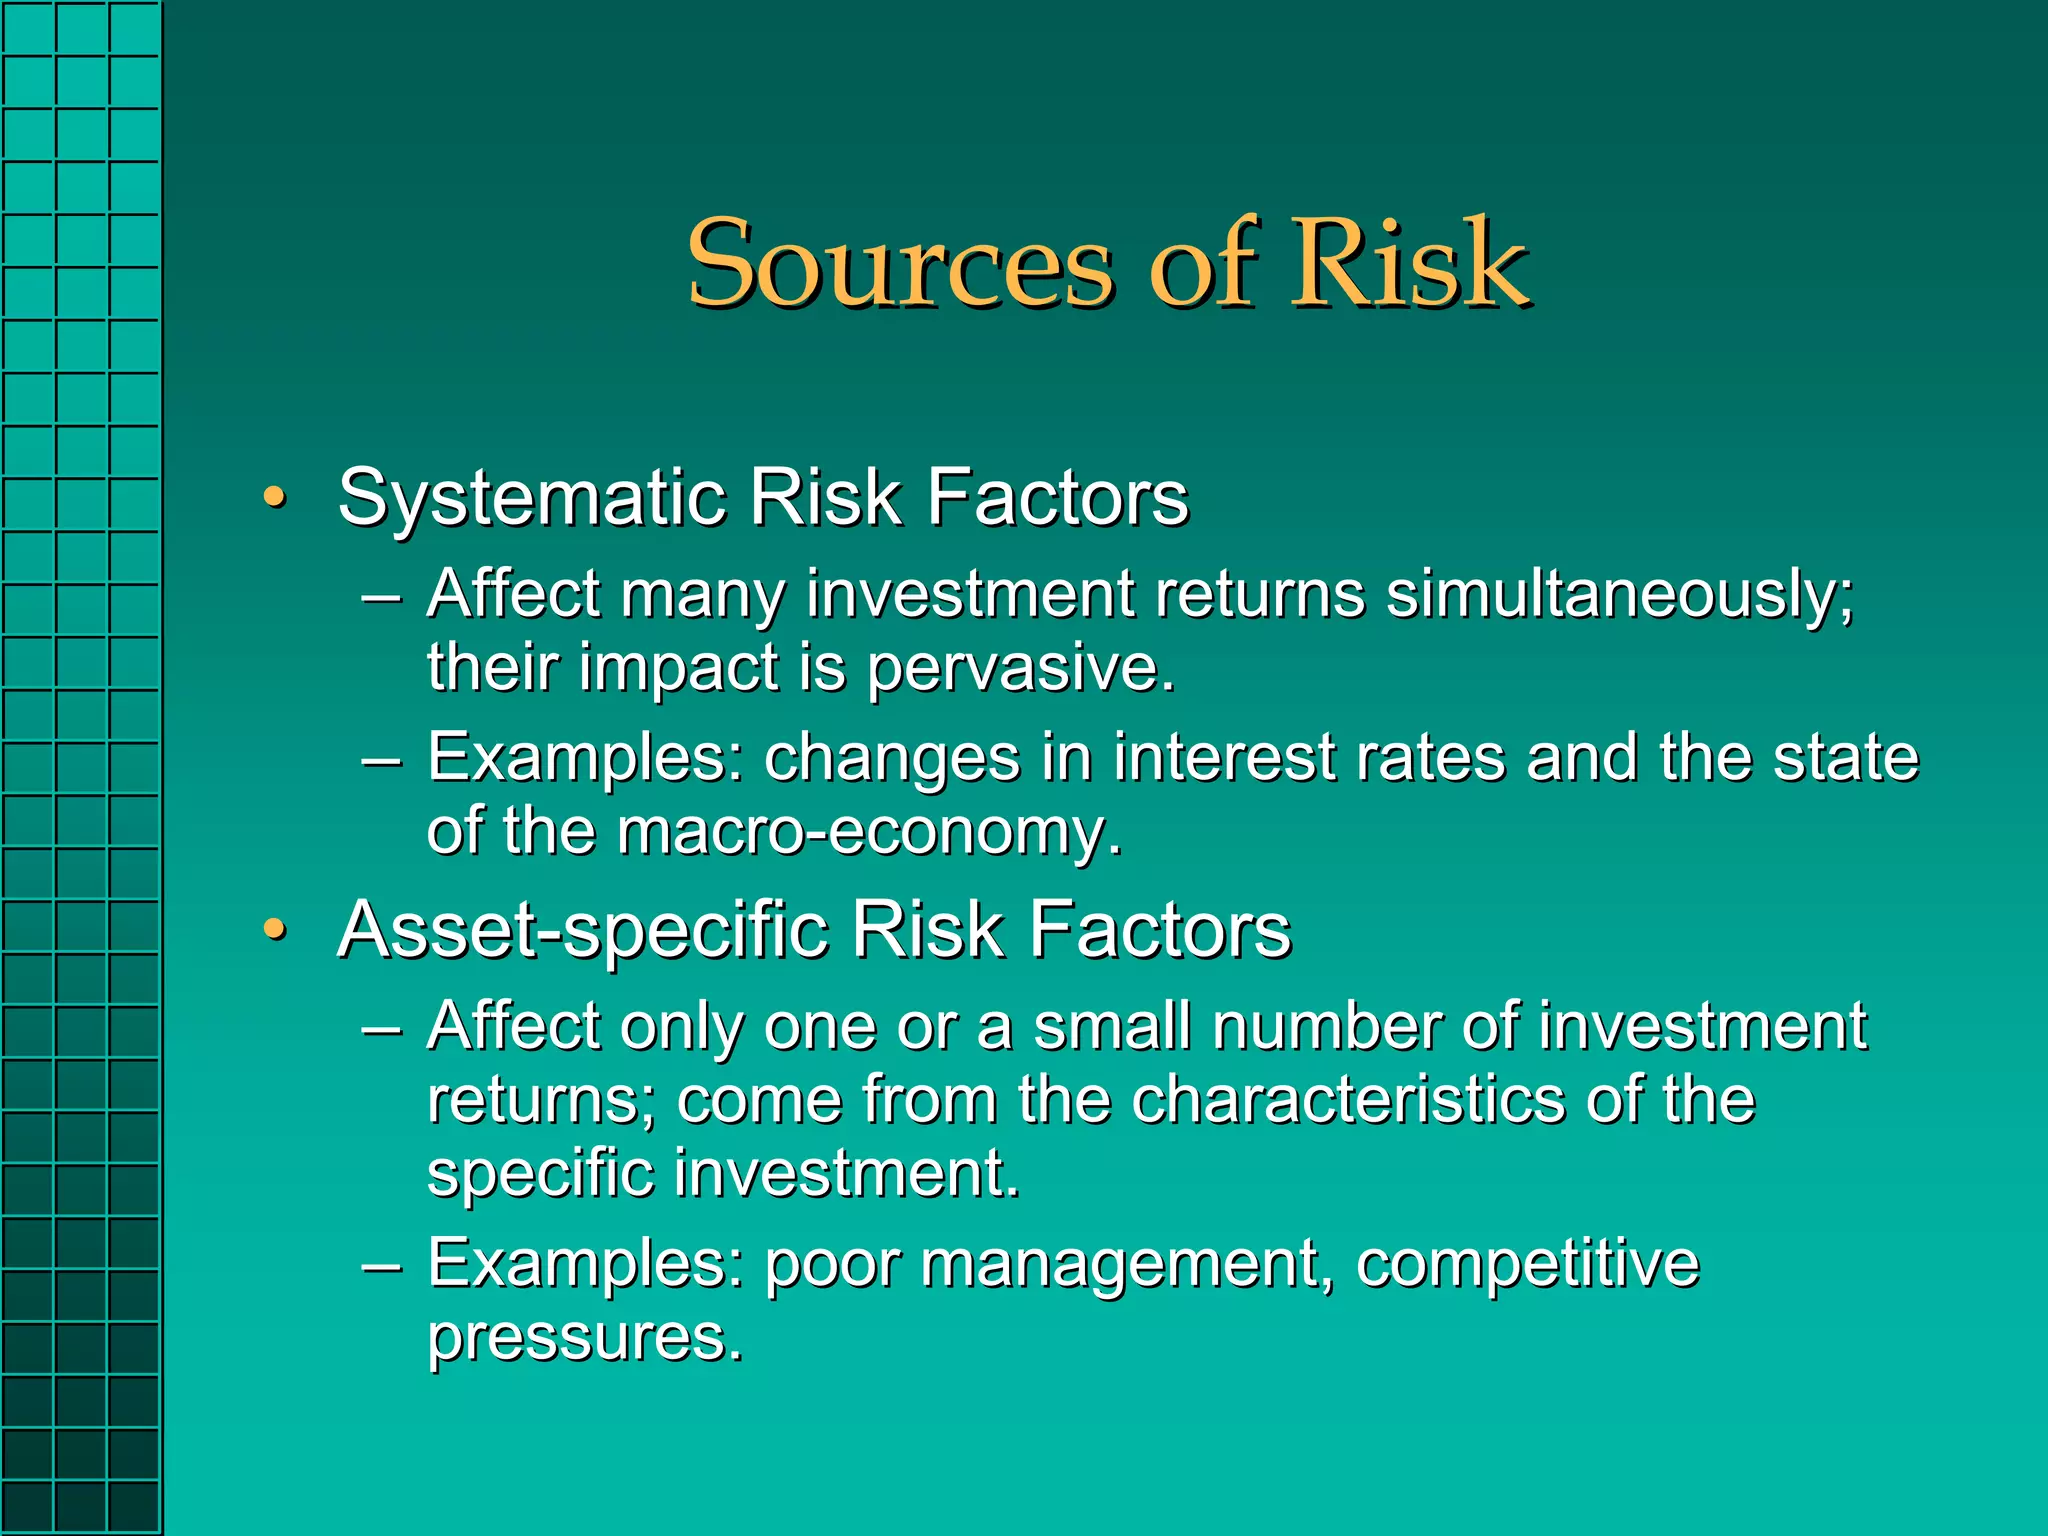
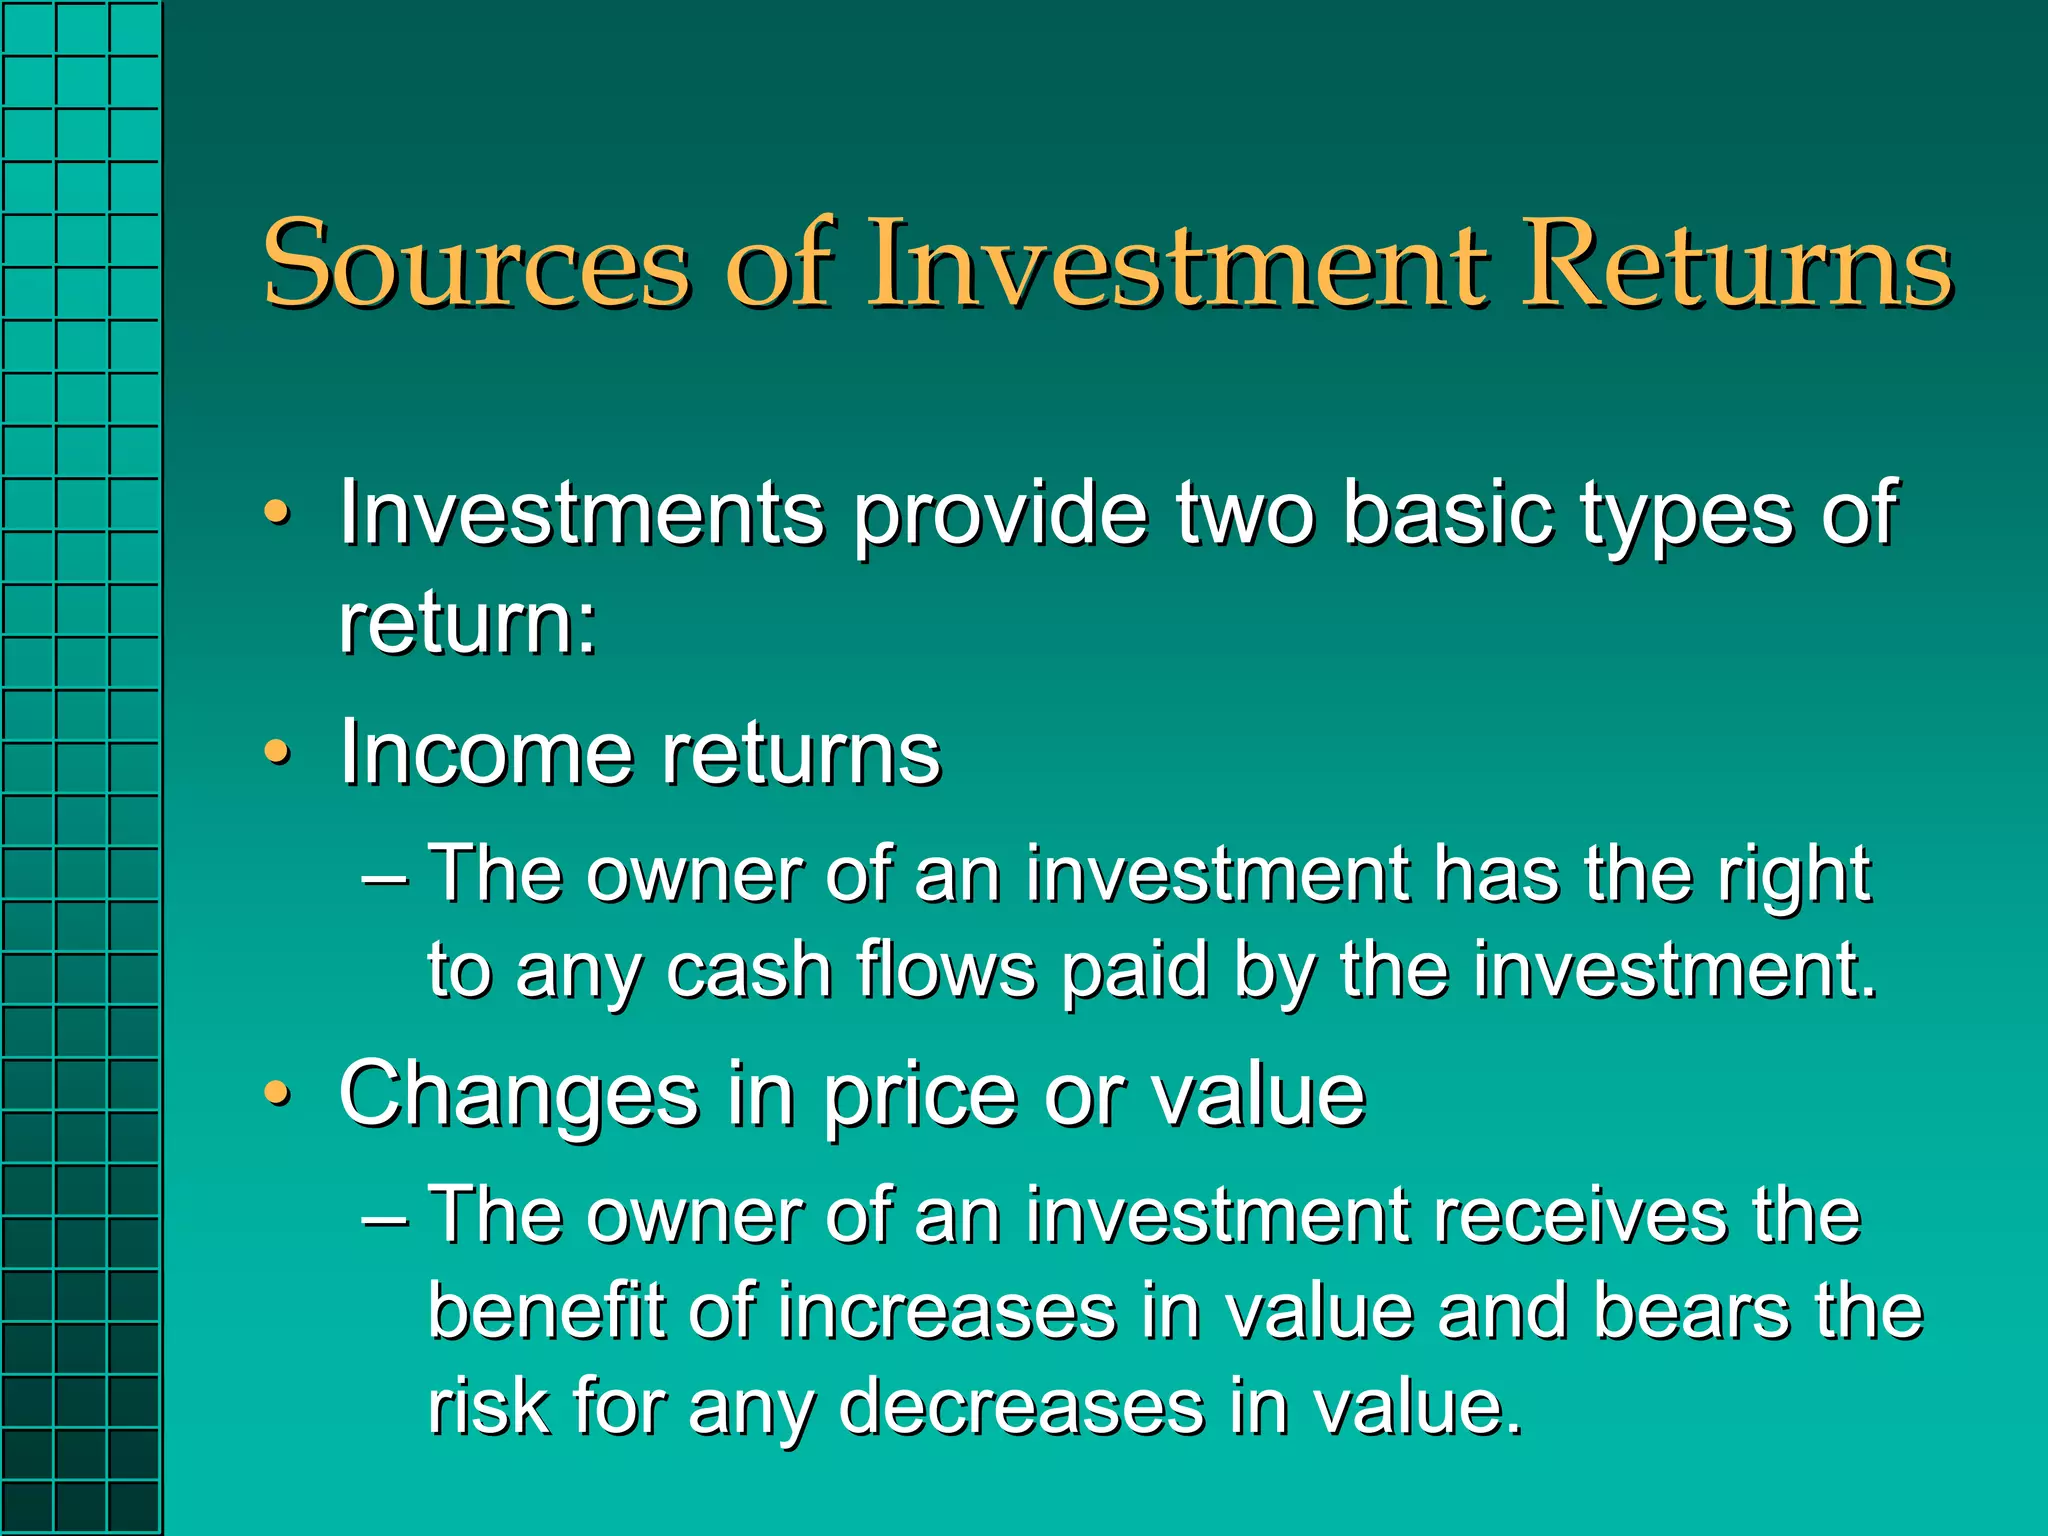
![How can we measure risk?
• Since risk is related to variability and
uncertainty, we can use measures of
variability to assess risk.
• The variance and its positive square root, the
standard deviation, are such measures.
– Measure “total risk” of an investment, the
combined effects of systematic and asset-specific
risk factors.
• Variance of Historic Returns
σ2 = [Σ(Rt-RA)2]/n-1](https://image.slidesharecdn.com/chapter02-120313103915-phpapp01/75/417Chapter-02-19-2048.jpg)
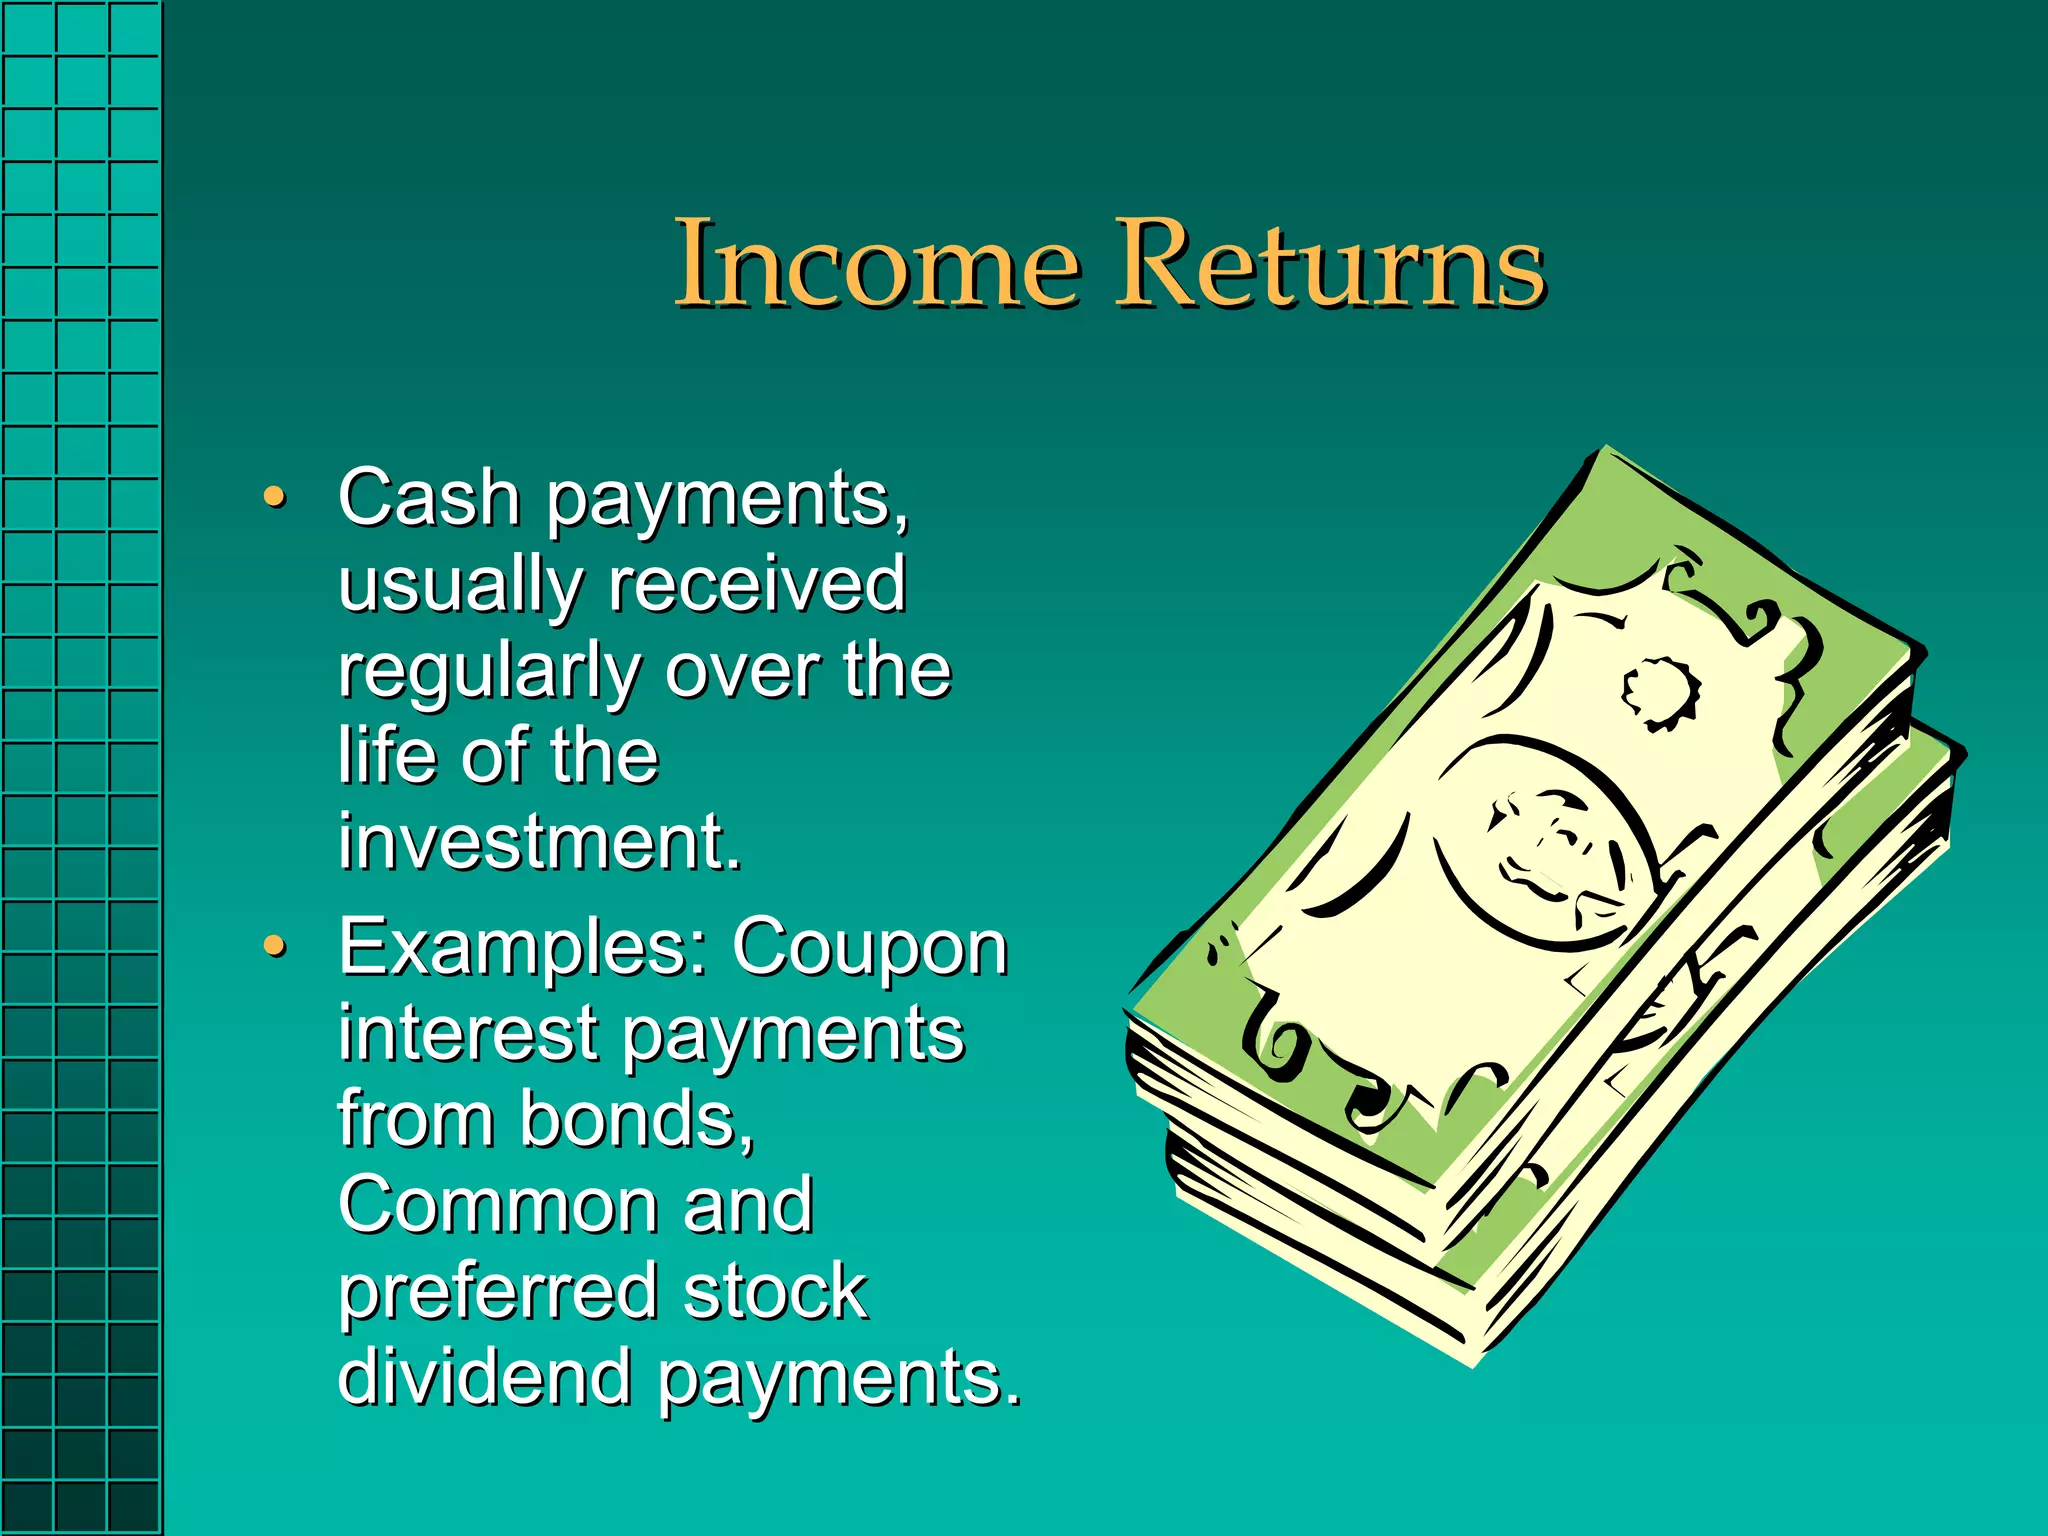
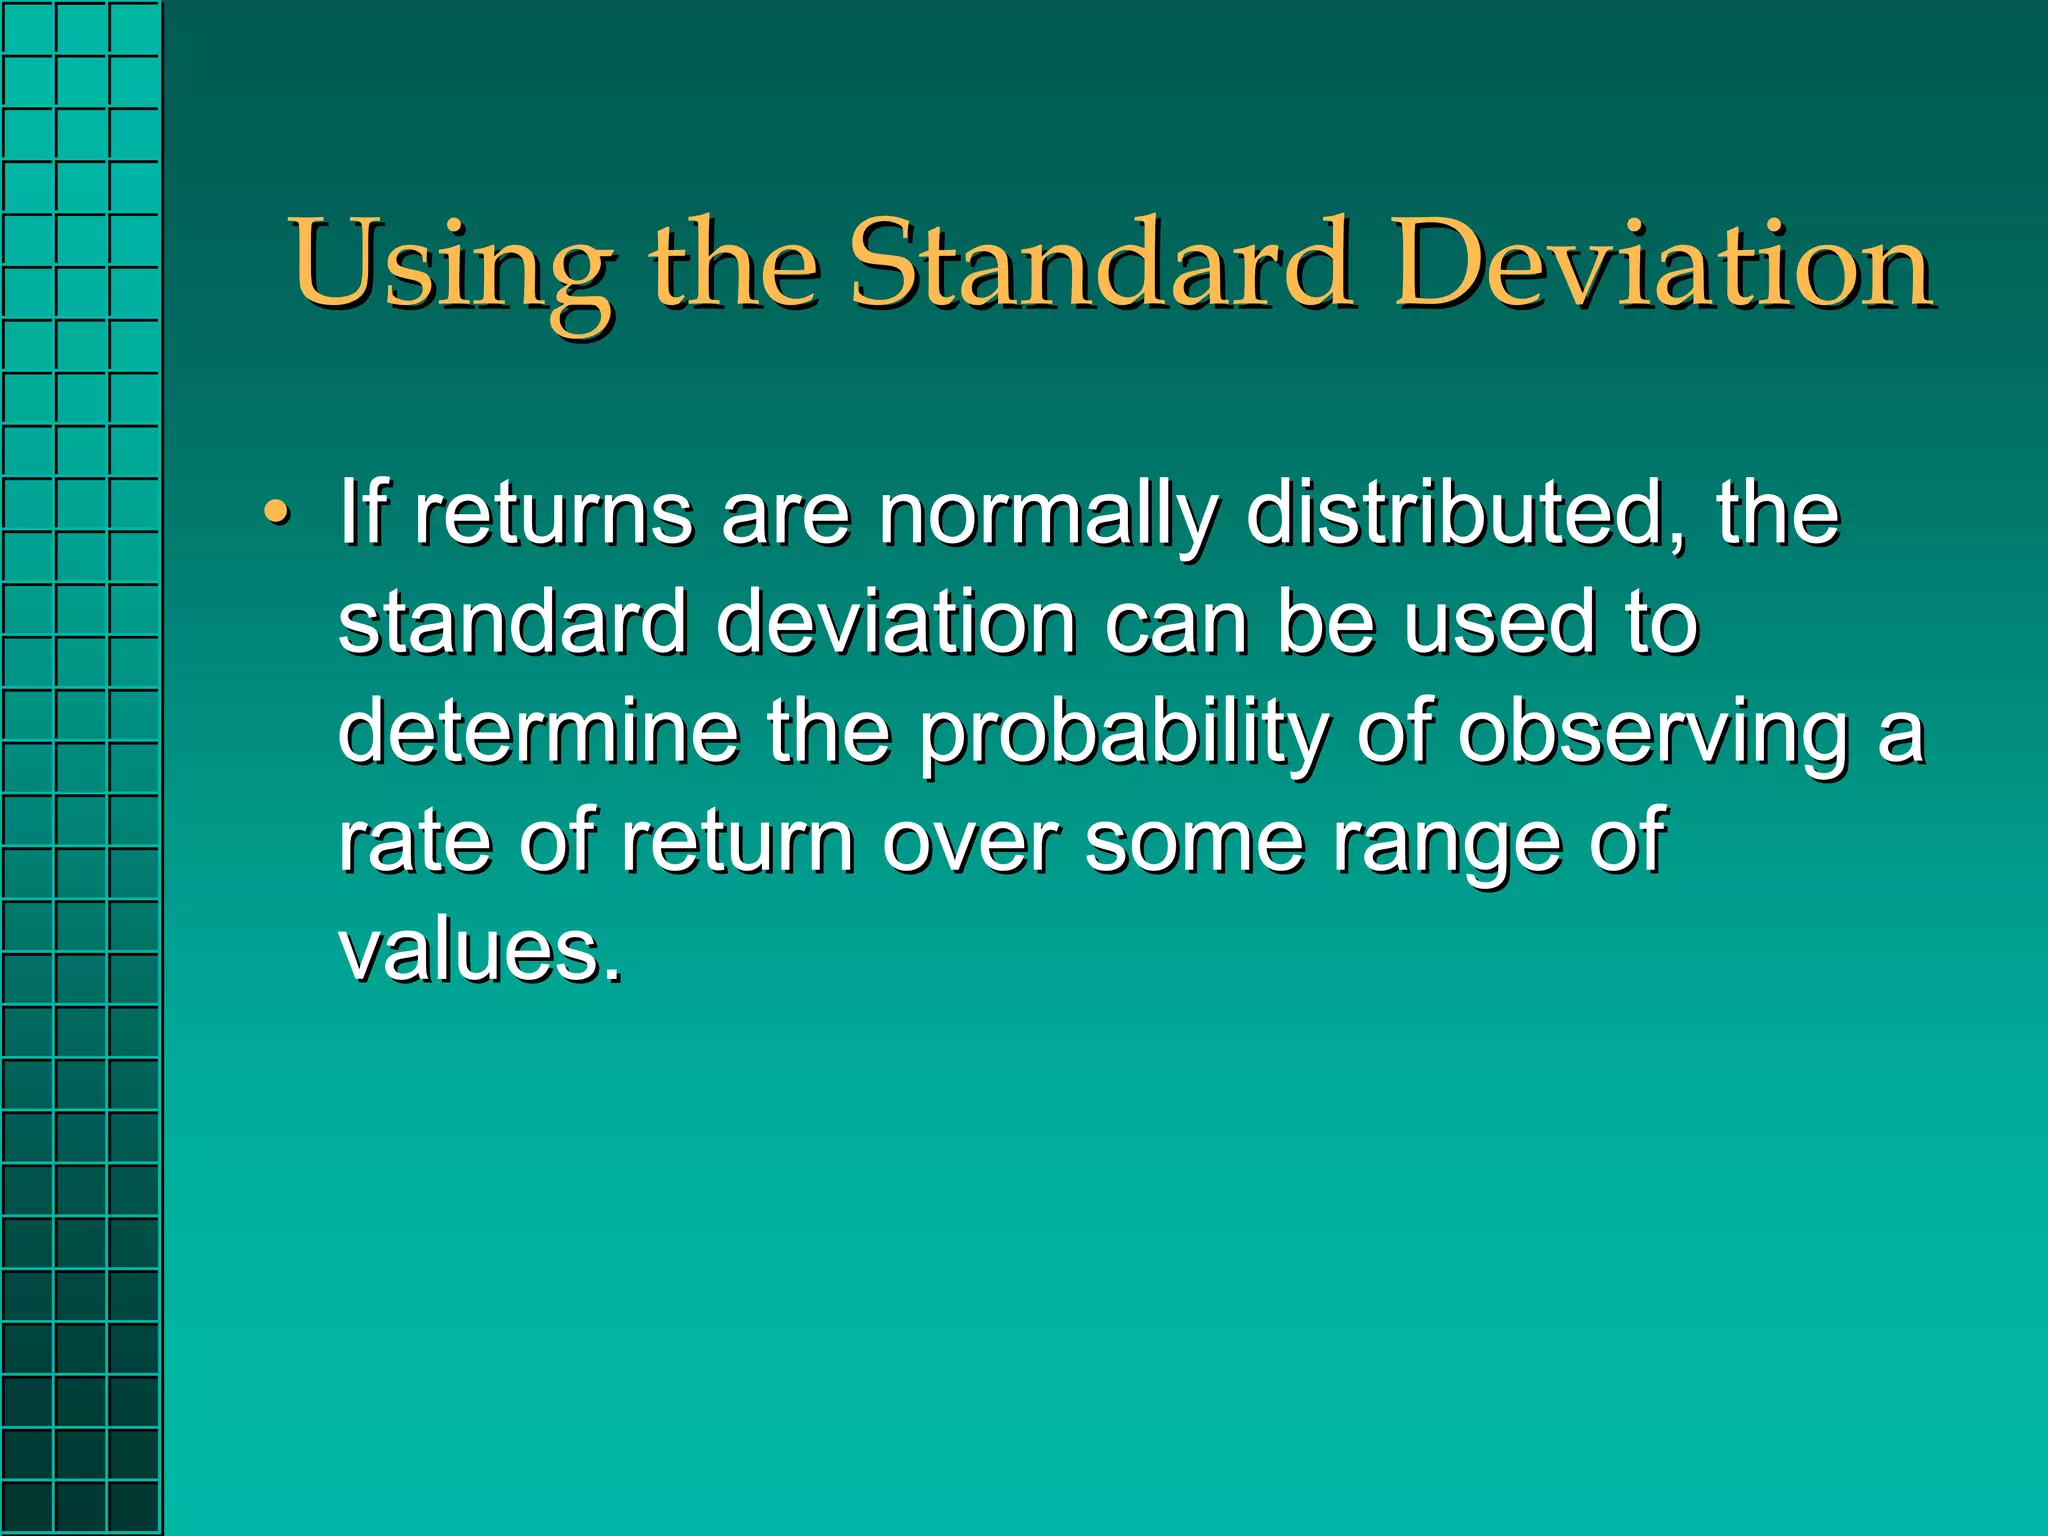
![Standard Deviation of Historic
Returns
Year Holding Period Return
1 10% RA = 8%
2 30% σ2 = 370
3 -20% σ = 19.2%
4 0%
5 20%
σ2 = [(10-8)2+(30-8)2+(-20-8)2+(0-8)2+(20-8)2]/4
= [4+484+784+64+144]/4
= [1480]/4](https://image.slidesharecdn.com/chapter02-120313103915-phpapp01/75/417Chapter-02-20-2048.jpg)

1) The chapter discusses sources of investment returns including income returns from cash flows and returns from changes in the value of investments. 2) It describes how to measure returns such as dollar returns, holding period returns, and annualized returns which allow comparisons over different time periods. 3) Risk is defined as the uncertainty of investment returns and can be measured by the variability of returns using metrics like variance and standard deviation. The higher the risk, the higher the expected return required by investors.


