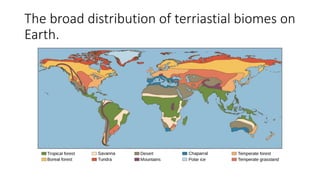
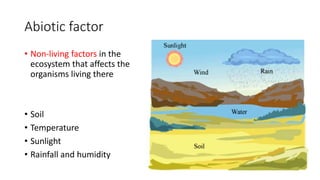
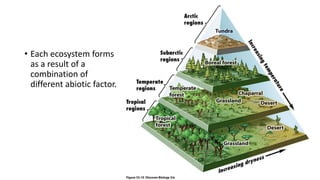
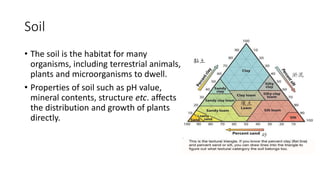
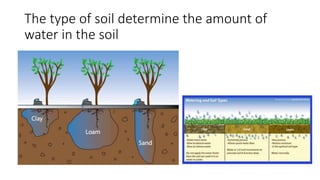
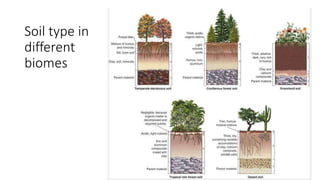
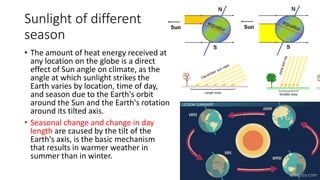
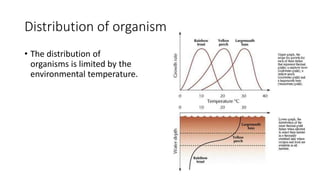
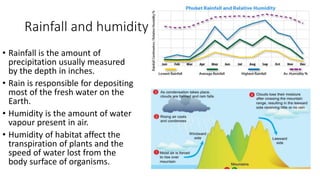
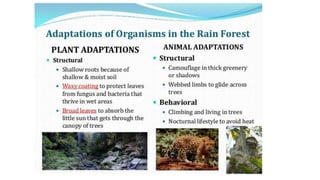
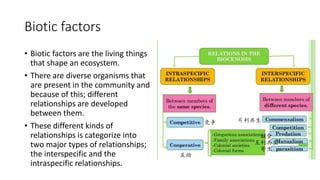
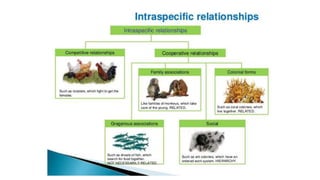
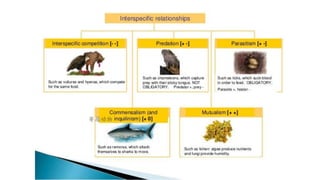
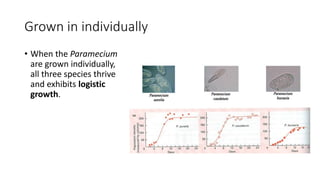
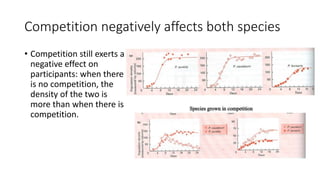
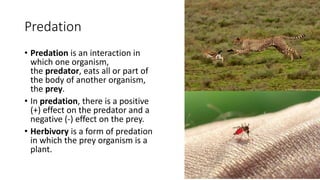
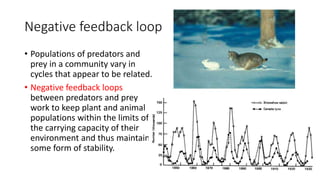
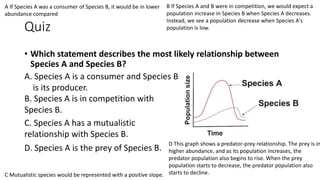
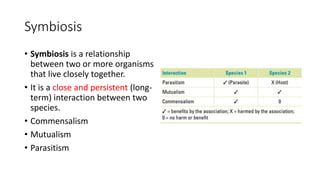
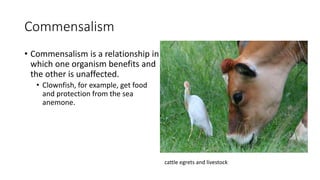
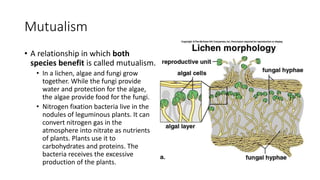
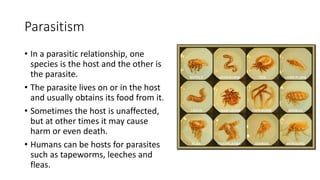
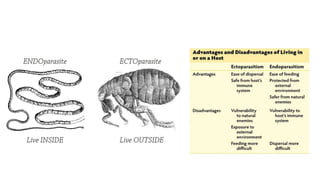
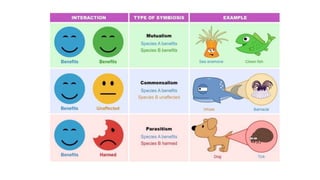
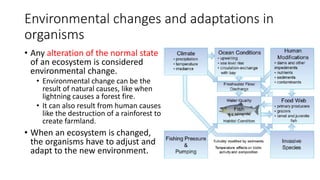
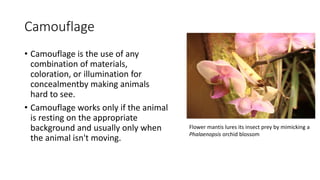
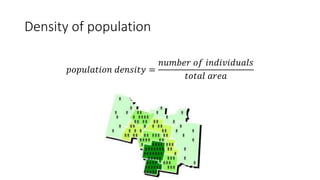
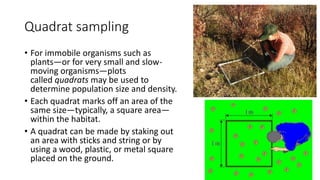
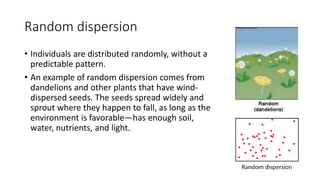
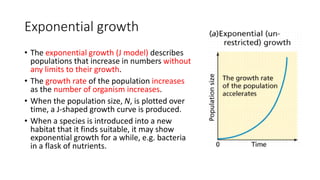
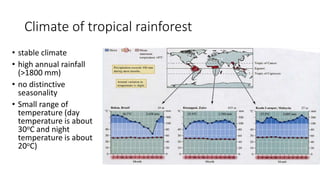
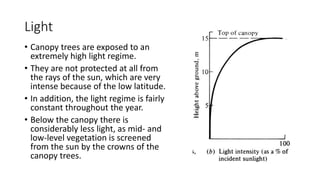
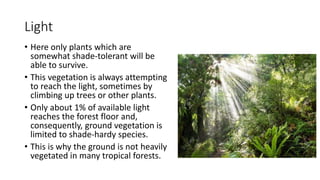
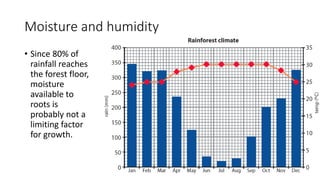
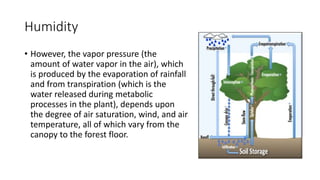
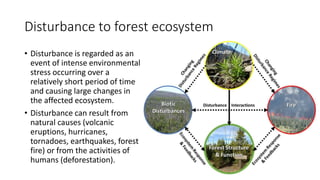
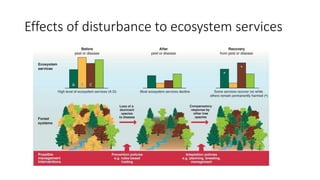
This document provides an overview of key concepts in ecology, including important terms like habitat, species, population, community, ecosystem, niche, biome, and biosphere. It discusses abiotic factors like temperature, sunlight, rainfall, and humidity and how they influence organisms and ecosystems. It also covers biotic factors and interactions between species, including competition, predation, symbiosis (commensalism, mutualism, parasitism). The document discusses how organisms adapt to environmental changes and provides examples of structural, behavioral, and physiological adaptations.
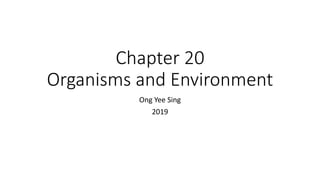
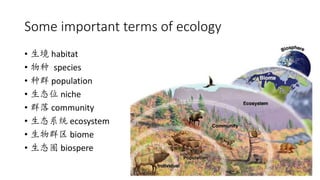
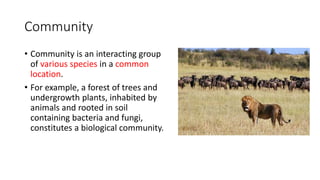
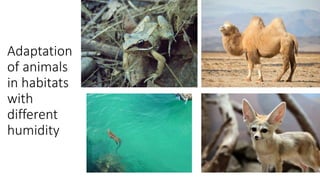
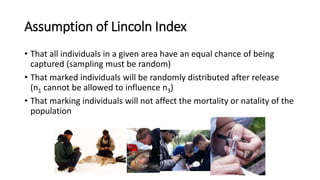
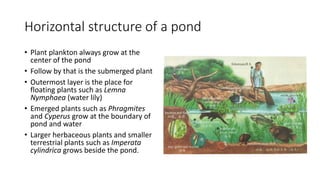
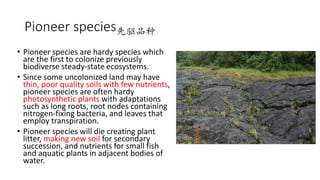
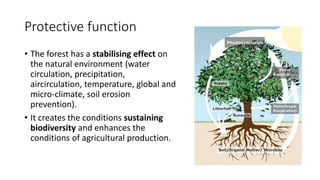
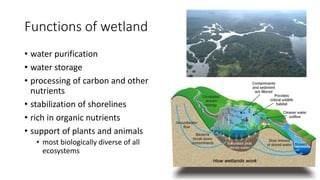
![Habitat
• The type of natural
environment in which a
particular species of organism
lives.
• A species' habitat is those
places where it can find food,
shelter, protection and mates
for reproduction.
• It is characterized by both
physical [abiotic] and biological
[biotic] features.
This coral reef in the Phoenix Islands Protected Area is a rich
habitat for sea life.](https://image.slidesharecdn.com/chapter20-190531074619/85/Chapter-20-Ecosystem-5-320.jpg)
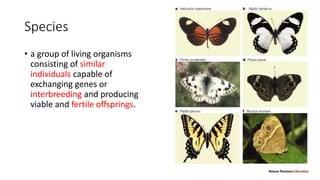
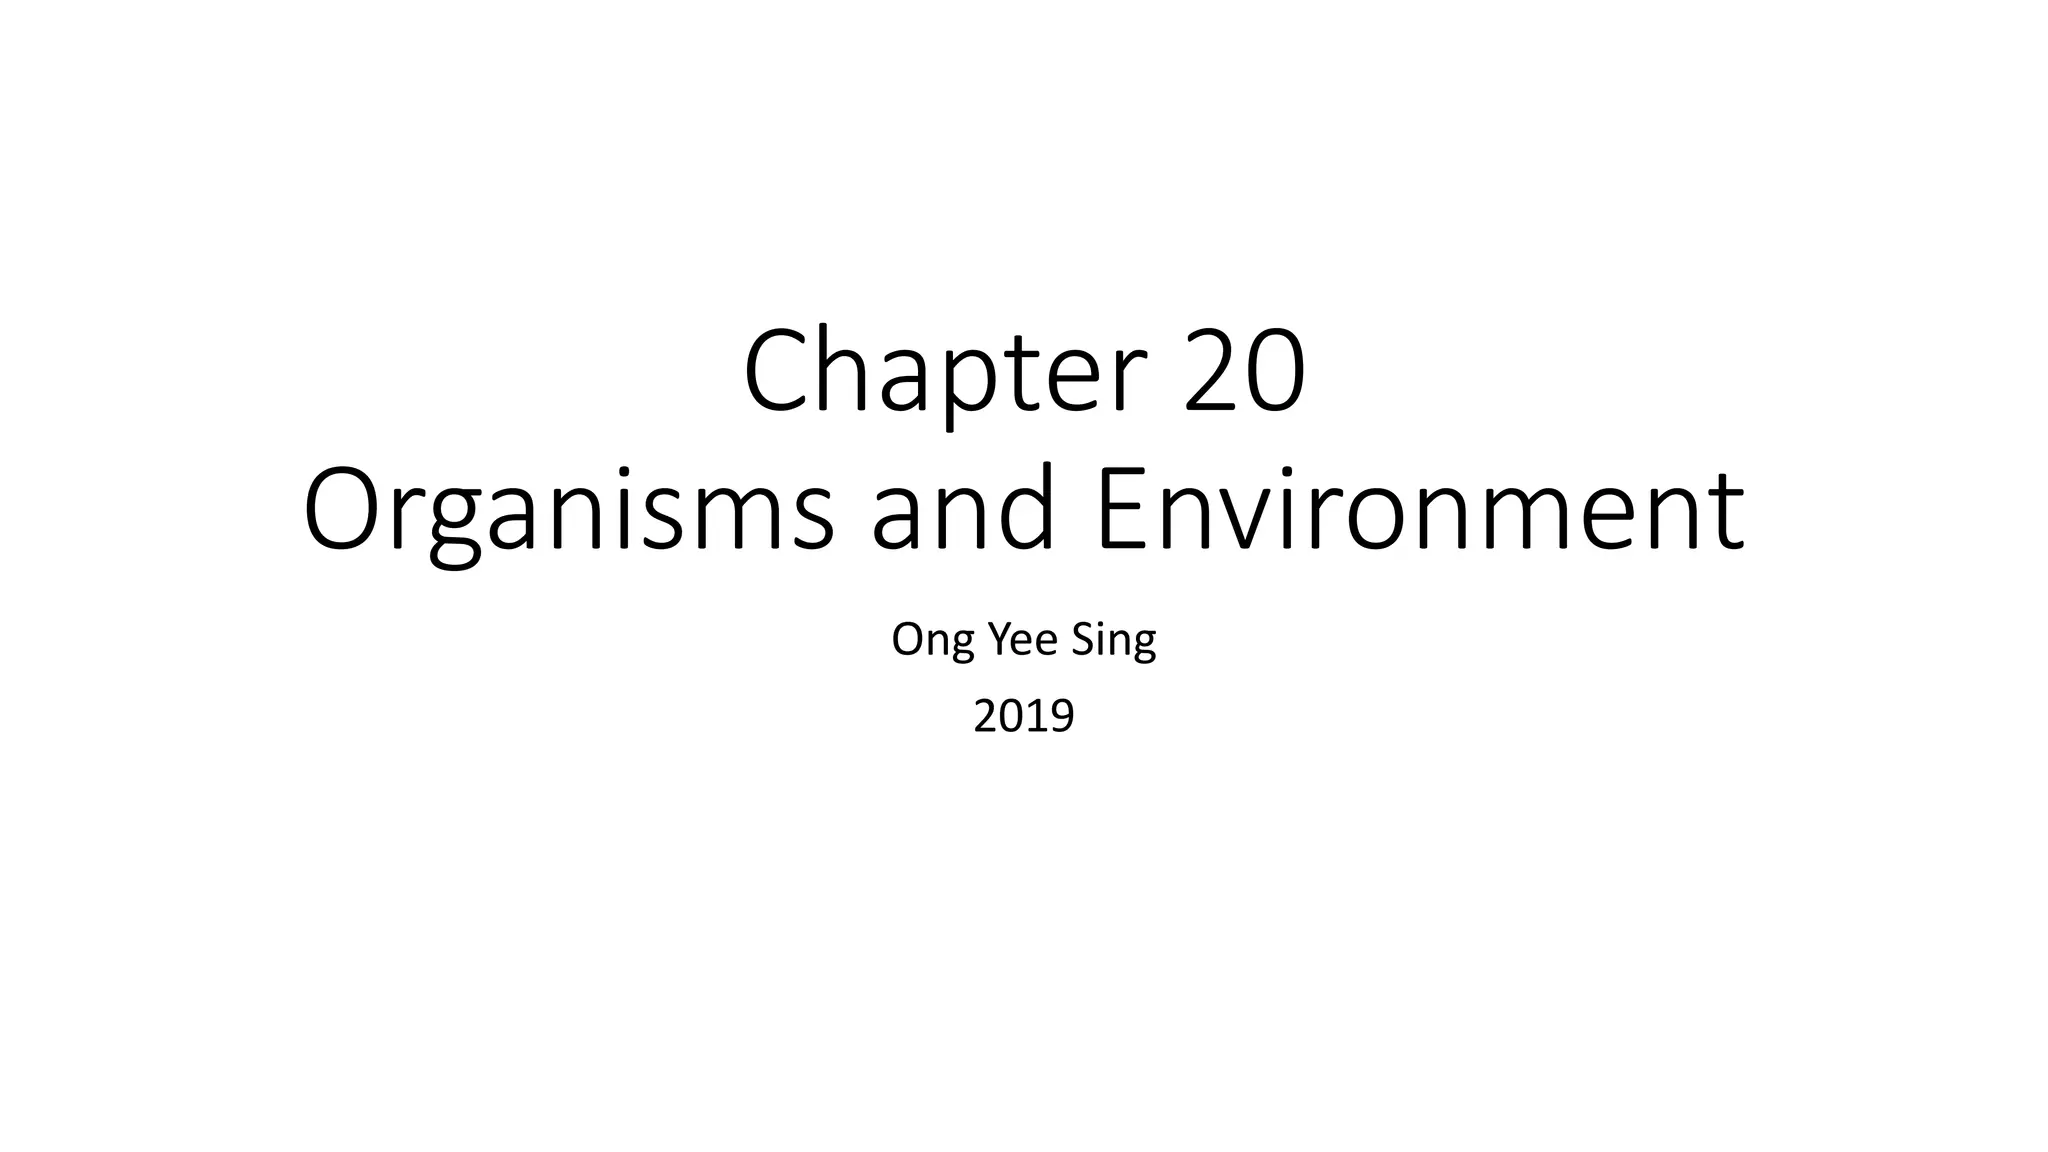
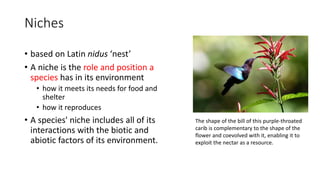
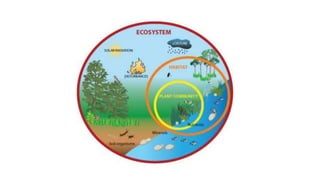
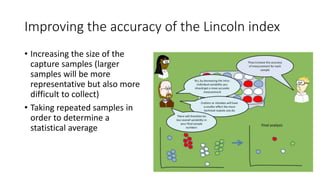
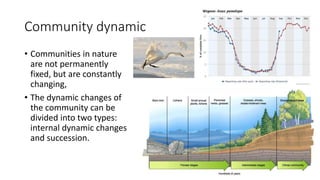
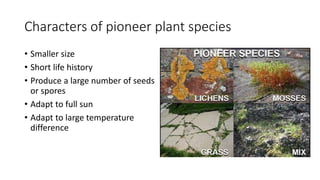
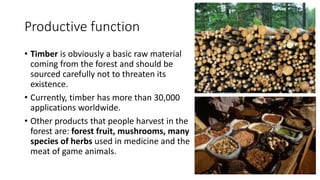
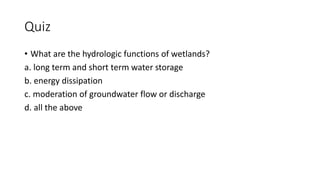
![Ecosystem
• An ecosystem is a community of living
organisms [biotic] and their shared
physical environment [abiotic] to form
a stable and equilibrium system.
• Ecosystems can be small, such as the
tide pools found near the rocky shores
of many oceans, or very large, such as
the Amazon Rainforest in South
America.](https://image.slidesharecdn.com/chapter20-190531074619/85/Chapter-20-Ecosystem-10-320.jpg)
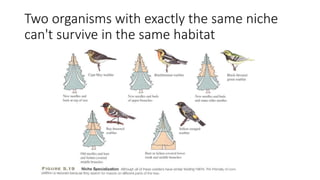

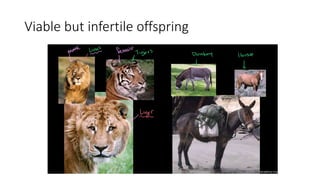
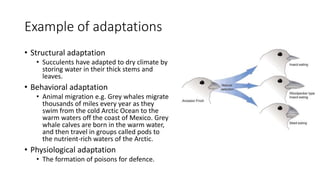
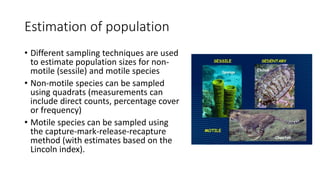
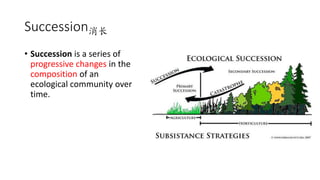
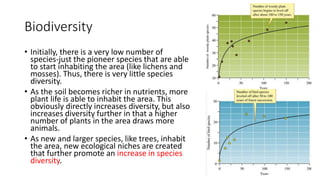
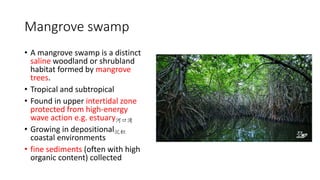
![Definition of adaptation
1. Adaptation is the evolutionary process whereby
an organism becomes better able to live in its
habitat or habitats.
2. Adaptedness is the state of being adapted: the
degree to which an organism is able to live and
reproduce in a given set of habitats.
3. An adaptive trait [physical features of an
organism] is an aspect of the developmental
pattern of the organism which enables or
enhances the probability of that organism
surviving and reproducing. Theodosius Dobzhansky](https://image.slidesharecdn.com/chapter20-190531074619/85/Chapter-20-Ecosystem-69-320.jpg)


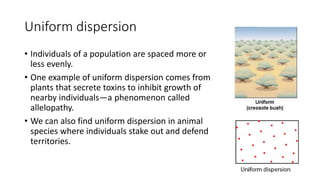
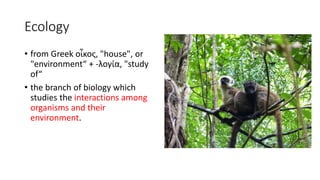
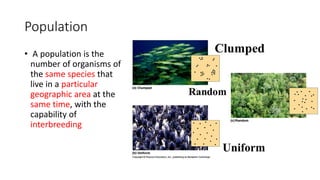
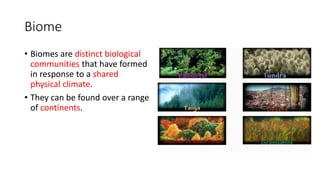
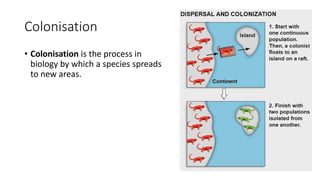
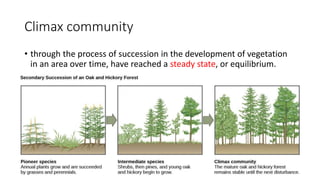
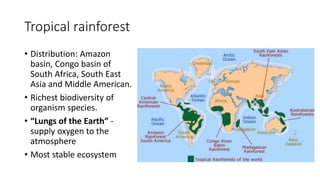
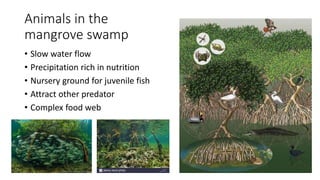
![Internal dynamics动态变化
• The internal dynamics of the
community (including dayly,
seasonal and interannual
changes)
• Limited to short-term reversible
changes within the community,
without the replacement of the
community.
• Fluctuations of the population
size due to environmental
conditions (wet years and dry
years, sudden catastrophes, and
annual cycle of the climate), and
the activity cycle of the organism
itself (outbreaks of pests and
diseases, migration, activity
patters).
Many small freshwater planktonic animals move vertically
during the daily cycle of illumination somewhat as shown here
(widths of bands represent the density of animals at a given
depth at a particular time). [After Cowles and Brambel 1936].](https://image.slidesharecdn.com/chapter20-190531074619/85/Chapter-20-Ecosystem-120-320.jpg)


![Polymer [ बहुलक ] Chemistry Notes PDF - Irfanullah Mehar - JJ Sir Chemistry.pdf](https://cdn.slidesharecdn.com/ss_thumbnails/polymerchemistrynotespdf-irfanullahmehar-jjsirchemistry-260210172118-3f9b37f7-thumbnail.jpg?width=640&height=640&fit=bounds)


