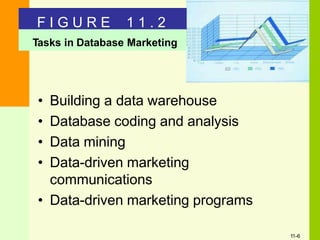
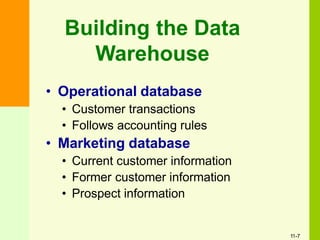
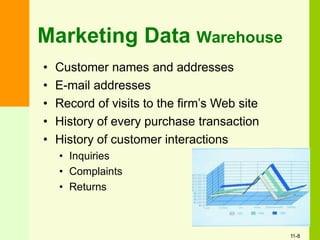
Prof. (Dr.) Kao Kveng Hong, PhD, D.Litt
11-1
18 Chapter-18
Database
and
Direct Response Marketing
Levi Strauss
• 1853, Bavarian immigrant
• Four principles
• Empathy
• Originality
• Integrity
• Courage
• Primary brands
• Levi’s, Dockers, Levi Strauss Signature
• Dominant brand  brand erosion
• Database marketing program
• 100,000 consumers - questionnaire
• Five target groups – promotions offered
• Online shoppers – fashion messages
18
11-2
Database and
Direct Response Marketing
Chapter Overview
• Database marketing
• Building a data warehouse
• Database coding and analysis
• Data mining
• Database-driven marketing
• Communications
• Programs
• Customer relationship management
• Direct response marketing
18
11-3
Developing Loyal Customers
The 3 R’s
• Recognition
• Relationship
• Rewards
11-4
Database Marketing
Database
Analytics
Direct Response
Marketing
Database
Identifying customersBuilding relationships
Data-Driven
Communications
Data-Driven
Programs
11-5
Tasks in Database Marketing
11-6
F I G U R E 1 1 . 2
• Building a data warehouse
• Database coding and analysis
• Data mining
• Data-driven marketing
communications
• Data-driven marketing programs
Building the Data
Warehouse
• Operational database
• Customer transactions
• Follows accounting rules
• Marketing database
• Current customer information
• Former customer information
• Prospect information
11-7
Marketing Data Warehouse
• Customer names and addresses
• E-mail addresses
• Record of visits to the firm’s Web site
• History of every purchase transaction
• History of customer interactions
• Inquiries
• Complaints
• Returns
11-8
Marketing Data Warehouse
(continued)
• Customer survey results
• Preferences and profiles supplied by the customer
• Response history from marketing campaigns
• Appended data
• Demographic and psychographic data
(Knowledge Base Marketing or Claritas)
• Geocoding
(CACI Coder Plus)
• Database coding through customer analyses
• Lifetime value
• Customer segment cluster
• RFM (recency, frequency, monetary) analysis
11-9
Trade Area Draw Analysis
Sample CACI Report for a Proposed Store Site
Based on a customer profile presented to CACI, 50% of the firm’s target
customers live within 2.32 miles of the proposed retail site. Of the 14,803
customers who live within 2.32 miles, only 985 (or 6.7%) are currently
customers of this firm.
11-10
Percentile
25%
# of Customers
492
Distance
0.99
# of Households
1,992
Penetration Rate
24.7%
50% 985 2.32 14,803 6.7%
75% 1,477 4.28 45,390 3.3%
90% 1,772 8.48 97,382 1.8%
99% 1,949 27.92 3,064,490 0.1%
• Personalized communications
• Marketing campaigns
• Common forms of coding
• Lifetime value analysis
• RFM analysis
Database Coding and Analysis
11-11
Represents the profit revenue of a customer
throughout the lifetime of the relationship
• Individual lifetime value
• Customer segment lifetime value
• Key figures
• Revenue and costs
• Retention rate
• Visits or purchases per time period
11-12
Lifetime Value Analysis
Lifetime Value for Lilly Fashions
F I G U R E 1 1 . 3
11-13
Year 1 Year 2 Year 3
Customers 3,200 1,600 960
Retention rate 50% 60% 70%
Visits/Year 4 5 6
Sales/Visit $78.00 $94.00 $110.00
Total Revenue $998,400 $752,000 $633,600
Variable costs % 60% 60% 60%
Variable costs $ $599,040 $451,200 $380,160
Acquisition costs ($72) $230,400
Database costs ($3) $9,600 $4,800 $2,880
Total costs $839,040 $456,000 $383,040
Gross Profit $159,360 $296,000 $250,560
Cumulative Gross Profit $159,360 $455,360 $705,920
Lifetime Value/customer $49.80 $142.30 $220.60
•Recency
•Frequency
•Monetary
RFM Analysis
Used to predict future customer behaviors.
11-14
• Recency
• Divide database into 5 equal parts based on date of last
purchase.
• Code 5 to 1 with 5 the last 20% to purchase.
• Frequency
• Divide into 5 equal parts.
• Code 5 to 1 with 5 being the most frequent
• Monetary
• Divide into 5 equal parts
• Code 5 to 1 with 5 being the highest expenditures
• Codes range from 555 to 111.
RFM Analysis Procedure
11-15
• Code of 235
• 2 indicates has not made a recent purchase
• 3 indicates has made an average number of purchases
• 5 indicates the total monetary value of the purchases
were among the top 20% of the firm’s customers
• Recency has most impact on future purchases
• Frequency has second most impact
• Monetary has least impact
RFM Analysis Results
11-16
Data Mining
• Building profiles of customer groups
• Preparing models that predict future
purchase behavior
• Examples
• First Horizon – profiles best prospects
• American Eagle – price markdowns
• Goody’s – shopper baskets
• Staples – profiles of best customers
11-17
Executives from
Unica, a maker of
marketing automation
software, discuss the
importance and use of
data mining and
management.
Click picture to view video.
11-18
Data Mining and Data Coding
• Marketing communications
• Marketing programs
Drives 
11-19
Why the Internet is Important in Customer Communications
• Low cost
• Available 24/7.
• Metric analysis
• If the message was read
• Time it was read
• How much time was spent
• Customers access to additional information
• Build a bond with customers.
11-20
F I G U R E 1 1 . 4
Why build a data warehouse?
Why code data?
Why mine the data?
11-21
Database-Driven Communications
• Identification codes
• Customer IDs/passwords
• Personalized greetings
• After-sale communications
• Customer profile information
• In-bound telemarketing
• Trawling
11-22
F I G U R E 1 1 . 5
Segmenting Customers by Lifetime Value
Gold
Silver
Bronze
Mass Customers
Losers
11-23
LifetimeValue
Database-Driven
Marketing Programs
• Permission marketing
• Frequency/loyalty programs
• Customer relationship
management
11-24
• Obtain permission
• Offer a curriculum over time
• Reinforce incentives to continue the relationship
• Increase level of permission
• Leverage the permission to benefit both parties
Source: Based on Seth Godin, “Permission Marketing: The Way to Make Advertising WorkAgain, Direct
Marketing, (May 1999), Vol. 62, No. 1, pp. 41-43.
Steps in Building a Permission Marketing Program
11-25
F I G U R E 1 1 . 6
Successful Permission Marketing
• Ensure recipients have granted permission
• Make e-mails relevant
• Customize program by tracking member activity
Empowerment
Reciprocity
11-26
Reasons Consumers Opt into an E-mail Permission Program
F I G U R E 1 1 . 7
24%
Source: Based on Joseph Gatt, “Most Consumers Have Reached Permission E-mail Threshold,” Direct
Marketing (December 2003), pp. 1-2.
11-27
40%
38%
37%
41%
0% 5% 10% 15% 20% 25% 30%
Percent of Respondents
35% 40% 45%
Friend recommended
Already customer
E-mail required to
access content
Found site randomly
Sweepstakes or
chance to win
Reasons Customers Remain Loyal to a Permissions Relationship
F I G U R E 1 1 . 8
27%
Source: Based on Joseph Gatt, “Most Consumers Have Reached Permission E-mail Threshold,” Direct
Marketing (December 2003), pp. 1-2.
11-28
34%
34%
35%
36%
0% 5% 10% 15% 20% 25%
Percent of Respondents
30% 35% 40%
Entertaining
Price bargains
Contests and
sweepstakes
Account status updates
Interesting content
Frequency Program Objectives
• Maintain sales, margins, or profits
• Increase loyalty of existing customers
• Induce cross-selling to existing customers
• Differentiate a parity brand
• Preempt the entry of a new brand
• Preempt or match a competitor’s program
11-29
Source: Grahame R. Dowling and Mark Uncles, “Do Customer Loyalty Programs Really Work?” Sloan
Management Review, (Summer 1997), Vol. 38, No. 4, pp. 71-82.
F I G U R E 1 1 . 9
Goals of Frequency Programs
•
•
•
Develop customer loyalty
Matching or preempting the competition
Target higher income households
• Incomes of $125,000 plus - 92% enrolled
• Incomes below $125,000 – 51% enrolled
11-30
Principles
Frequency Programs
• Design the program to enhance the value of the product.
• Calculate the full cost of the program.
• Design a program that maximizes the customer’s motivation
to make the next purchase.
Sent letter to 4,000 offering $5 discount on dinner.
• Average visits increased
• From 25 to 42 during promotion
• From 25 to 29 after promotion
• Card holders visits increased
• Incremental sales increased
•$17,100 during promotion
•$4,700 after promotion
11-31
Customer Relationship
Management
• Database technology
• Customize products
• Customize communications
• Many CRM programs failed
• Built on two primary metrics
• Lifetime value
• Share of customer
11-32
Customer Relationship Management
Steps to Develop
• Identify the company’s customers
• Differentiate customers in terms of
needs and value
• Lifetime value
• Share of customer
• Interact with customers
• Improve cost efficiency
• Enhance effectiveness of interaction
• Customize goods or services
11-33
Share of a Customer
• Company A - $ 27,000
• Company B - $ 18,000
• Company C - $ 15,000
• Total expenditures -$60,000.
• Share of customer
• Company A  45%
• Company B  30%
• Company C  25%
11-34
Customer Relationship Management
Reasons for Failure
• Implemented before a solid customer strategy is created
• Rolling out a CRM program before changing the organization to
match the CRM program
• Becoming technology driven rather than customer driven
• Customers feel like they are being stalked instead of being wooed
11-35
Direct Response Marketing
• Direct Marketing Association
• Prospecting 60%
• Customer retention  40%
• Dell Computers
• Catalog
• TV and radio ads
• FSI ads
• Web site
11-36
Methods of Direct Marketing
F I G U R E 1 1 . 1 0
11-37
77%
73%
0% 10% 20% 30% 40% 50% 60%
% of Companies Using Particular DMMethodology
70% 80% 90%
Source: Based on Richard H. Levy, “Prospects Look Good,” Direct, Vol. 16 (December 1, 2004), pp. 1-5.
Direct mail to customers
Direct mail to prospects
Statement stuffers
16%
Catalogs 24%
Direct response-promotions 21%
Direct response-radio 10%
Direct response-TV
Direct response-Internet
8% 29%
Search engine marketing 22%
Search engine optimization
E-mail to customers
17% 55%
E-mail to prospects 46%
Inbound telemarketing 16%
Outbound telemarketing 24%
Direct Mail
• Most common form of direct marketing
• Types of lists
• Response list
• Compiled list
• Advantages
• Target mailings (consumer, b-to-b)
• Measurable
• Driver of online sales
• Disadvantages
• Clutter
• Costs
• Digital direct-to-press
Copyright © 2010 Pearson Education, Inc. publishing as Prentice Hall 11-38
Catalogs
• Long-term impact
• Low-pressure sales tactics
• First stage in buying cycle
• Database
• Specialty catalogs
• Business-to-business
11-39
Direct Response Media
• Television
• Radio
• Magazines
• Newspapers
11-40
Internet
• Direct response to ads
• Cost-effective
• Builds relationships
• Personalization of communication
• Customization of offer
• Search engine ads
11-41
Alternative Media
•
•
•
• Package insert programs (PIPs)
Ride-a-longs
Statement stuffers
Card packs
11-42
Telemarketing
• Inbound telemarketing
• Cross-selling
• Outbound telemarketing
• Cold calling
• Database
• Prospects
11-43
International Implications
• Differences in technology
• Laws and regulations
• Local customs
• Infrastructure
11-44

Chapter 18 database and direct response marketing

  • 1.
    Prof. (Dr.) KaoKveng Hong, PhD, D.Litt 11-1 18 Chapter-18 Database and Direct Response Marketing
  • 2.
    Levi Strauss • 1853,Bavarian immigrant • Four principles • Empathy • Originality • Integrity • Courage • Primary brands • Levi’s, Dockers, Levi Strauss Signature • Dominant brand  brand erosion • Database marketing program • 100,000 consumers - questionnaire • Five target groups – promotions offered • Online shoppers – fashion messages 18 11-2
  • 3.
    Database and Direct ResponseMarketing Chapter Overview • Database marketing • Building a data warehouse • Database coding and analysis • Data mining • Database-driven marketing • Communications • Programs • Customer relationship management • Direct response marketing 18 11-3
  • 4.
    Developing Loyal Customers The3 R’s • Recognition • Relationship • Rewards 11-4
  • 5.
    Database Marketing Database Analytics Direct Response Marketing Database IdentifyingcustomersBuilding relationships Data-Driven Communications Data-Driven Programs 11-5
  • 6.
    Tasks in DatabaseMarketing 11-6 F I G U R E 1 1 . 2 • Building a data warehouse • Database coding and analysis • Data mining • Data-driven marketing communications • Data-driven marketing programs
  • 7.
    Building the Data Warehouse •Operational database • Customer transactions • Follows accounting rules • Marketing database • Current customer information • Former customer information • Prospect information 11-7
  • 8.
    Marketing Data Warehouse •Customer names and addresses • E-mail addresses • Record of visits to the firm’s Web site • History of every purchase transaction • History of customer interactions • Inquiries • Complaints • Returns 11-8
  • 9.
    Marketing Data Warehouse (continued) •Customer survey results • Preferences and profiles supplied by the customer • Response history from marketing campaigns • Appended data • Demographic and psychographic data (Knowledge Base Marketing or Claritas) • Geocoding (CACI Coder Plus) • Database coding through customer analyses • Lifetime value • Customer segment cluster • RFM (recency, frequency, monetary) analysis 11-9
  • 10.
    Trade Area DrawAnalysis Sample CACI Report for a Proposed Store Site Based on a customer profile presented to CACI, 50% of the firm’s target customers live within 2.32 miles of the proposed retail site. Of the 14,803 customers who live within 2.32 miles, only 985 (or 6.7%) are currently customers of this firm. 11-10 Percentile 25% # of Customers 492 Distance 0.99 # of Households 1,992 Penetration Rate 24.7% 50% 985 2.32 14,803 6.7% 75% 1,477 4.28 45,390 3.3% 90% 1,772 8.48 97,382 1.8% 99% 1,949 27.92 3,064,490 0.1%
  • 11.
    • Personalized communications •Marketing campaigns • Common forms of coding • Lifetime value analysis • RFM analysis Database Coding and Analysis 11-11
  • 12.
    Represents the profitrevenue of a customer throughout the lifetime of the relationship • Individual lifetime value • Customer segment lifetime value • Key figures • Revenue and costs • Retention rate • Visits or purchases per time period 11-12 Lifetime Value Analysis
  • 13.
    Lifetime Value forLilly Fashions F I G U R E 1 1 . 3 11-13 Year 1 Year 2 Year 3 Customers 3,200 1,600 960 Retention rate 50% 60% 70% Visits/Year 4 5 6 Sales/Visit $78.00 $94.00 $110.00 Total Revenue $998,400 $752,000 $633,600 Variable costs % 60% 60% 60% Variable costs $ $599,040 $451,200 $380,160 Acquisition costs ($72) $230,400 Database costs ($3) $9,600 $4,800 $2,880 Total costs $839,040 $456,000 $383,040 Gross Profit $159,360 $296,000 $250,560 Cumulative Gross Profit $159,360 $455,360 $705,920 Lifetime Value/customer $49.80 $142.30 $220.60
  • 14.
    •Recency •Frequency •Monetary RFM Analysis Used topredict future customer behaviors. 11-14
  • 15.
    • Recency • Dividedatabase into 5 equal parts based on date of last purchase. • Code 5 to 1 with 5 the last 20% to purchase. • Frequency • Divide into 5 equal parts. • Code 5 to 1 with 5 being the most frequent • Monetary • Divide into 5 equal parts • Code 5 to 1 with 5 being the highest expenditures • Codes range from 555 to 111. RFM Analysis Procedure 11-15
  • 16.
    • Code of235 • 2 indicates has not made a recent purchase • 3 indicates has made an average number of purchases • 5 indicates the total monetary value of the purchases were among the top 20% of the firm’s customers • Recency has most impact on future purchases • Frequency has second most impact • Monetary has least impact RFM Analysis Results 11-16
  • 17.
    Data Mining • Buildingprofiles of customer groups • Preparing models that predict future purchase behavior • Examples • First Horizon – profiles best prospects • American Eagle – price markdowns • Goody’s – shopper baskets • Staples – profiles of best customers 11-17
  • 18.
    Executives from Unica, amaker of marketing automation software, discuss the importance and use of data mining and management. Click picture to view video. 11-18
  • 19.
    Data Mining andData Coding • Marketing communications • Marketing programs Drives  11-19
  • 20.
    Why the Internetis Important in Customer Communications • Low cost • Available 24/7. • Metric analysis • If the message was read • Time it was read • How much time was spent • Customers access to additional information • Build a bond with customers. 11-20 F I G U R E 1 1 . 4
  • 21.
    Why build adata warehouse? Why code data? Why mine the data? 11-21
  • 22.
    Database-Driven Communications • Identificationcodes • Customer IDs/passwords • Personalized greetings • After-sale communications • Customer profile information • In-bound telemarketing • Trawling 11-22
  • 23.
    F I GU R E 1 1 . 5 Segmenting Customers by Lifetime Value Gold Silver Bronze Mass Customers Losers 11-23 LifetimeValue
  • 24.
    Database-Driven Marketing Programs • Permissionmarketing • Frequency/loyalty programs • Customer relationship management 11-24
  • 25.
    • Obtain permission •Offer a curriculum over time • Reinforce incentives to continue the relationship • Increase level of permission • Leverage the permission to benefit both parties Source: Based on Seth Godin, “Permission Marketing: The Way to Make Advertising WorkAgain, Direct Marketing, (May 1999), Vol. 62, No. 1, pp. 41-43. Steps in Building a Permission Marketing Program 11-25 F I G U R E 1 1 . 6
  • 26.
    Successful Permission Marketing •Ensure recipients have granted permission • Make e-mails relevant • Customize program by tracking member activity Empowerment Reciprocity 11-26
  • 27.
    Reasons Consumers Optinto an E-mail Permission Program F I G U R E 1 1 . 7 24% Source: Based on Joseph Gatt, “Most Consumers Have Reached Permission E-mail Threshold,” Direct Marketing (December 2003), pp. 1-2. 11-27 40% 38% 37% 41% 0% 5% 10% 15% 20% 25% 30% Percent of Respondents 35% 40% 45% Friend recommended Already customer E-mail required to access content Found site randomly Sweepstakes or chance to win
  • 28.
    Reasons Customers RemainLoyal to a Permissions Relationship F I G U R E 1 1 . 8 27% Source: Based on Joseph Gatt, “Most Consumers Have Reached Permission E-mail Threshold,” Direct Marketing (December 2003), pp. 1-2. 11-28 34% 34% 35% 36% 0% 5% 10% 15% 20% 25% Percent of Respondents 30% 35% 40% Entertaining Price bargains Contests and sweepstakes Account status updates Interesting content
  • 29.
    Frequency Program Objectives •Maintain sales, margins, or profits • Increase loyalty of existing customers • Induce cross-selling to existing customers • Differentiate a parity brand • Preempt the entry of a new brand • Preempt or match a competitor’s program 11-29 Source: Grahame R. Dowling and Mark Uncles, “Do Customer Loyalty Programs Really Work?” Sloan Management Review, (Summer 1997), Vol. 38, No. 4, pp. 71-82. F I G U R E 1 1 . 9
  • 30.
    Goals of FrequencyPrograms • • • Develop customer loyalty Matching or preempting the competition Target higher income households • Incomes of $125,000 plus - 92% enrolled • Incomes below $125,000 – 51% enrolled 11-30
  • 31.
    Principles Frequency Programs • Designthe program to enhance the value of the product. • Calculate the full cost of the program. • Design a program that maximizes the customer’s motivation to make the next purchase. Sent letter to 4,000 offering $5 discount on dinner. • Average visits increased • From 25 to 42 during promotion • From 25 to 29 after promotion • Card holders visits increased • Incremental sales increased •$17,100 during promotion •$4,700 after promotion 11-31
  • 32.
    Customer Relationship Management • Databasetechnology • Customize products • Customize communications • Many CRM programs failed • Built on two primary metrics • Lifetime value • Share of customer 11-32
  • 33.
    Customer Relationship Management Stepsto Develop • Identify the company’s customers • Differentiate customers in terms of needs and value • Lifetime value • Share of customer • Interact with customers • Improve cost efficiency • Enhance effectiveness of interaction • Customize goods or services 11-33
  • 34.
    Share of aCustomer • Company A - $ 27,000 • Company B - $ 18,000 • Company C - $ 15,000 • Total expenditures -$60,000. • Share of customer • Company A  45% • Company B  30% • Company C  25% 11-34
  • 35.
    Customer Relationship Management Reasonsfor Failure • Implemented before a solid customer strategy is created • Rolling out a CRM program before changing the organization to match the CRM program • Becoming technology driven rather than customer driven • Customers feel like they are being stalked instead of being wooed 11-35
  • 36.
    Direct Response Marketing •Direct Marketing Association • Prospecting 60% • Customer retention  40% • Dell Computers • Catalog • TV and radio ads • FSI ads • Web site 11-36
  • 37.
    Methods of DirectMarketing F I G U R E 1 1 . 1 0 11-37 77% 73% 0% 10% 20% 30% 40% 50% 60% % of Companies Using Particular DMMethodology 70% 80% 90% Source: Based on Richard H. Levy, “Prospects Look Good,” Direct, Vol. 16 (December 1, 2004), pp. 1-5. Direct mail to customers Direct mail to prospects Statement stuffers 16% Catalogs 24% Direct response-promotions 21% Direct response-radio 10% Direct response-TV Direct response-Internet 8% 29% Search engine marketing 22% Search engine optimization E-mail to customers 17% 55% E-mail to prospects 46% Inbound telemarketing 16% Outbound telemarketing 24%
  • 38.
    Direct Mail • Mostcommon form of direct marketing • Types of lists • Response list • Compiled list • Advantages • Target mailings (consumer, b-to-b) • Measurable • Driver of online sales • Disadvantages • Clutter • Costs • Digital direct-to-press Copyright © 2010 Pearson Education, Inc. publishing as Prentice Hall 11-38
  • 39.
    Catalogs • Long-term impact •Low-pressure sales tactics • First stage in buying cycle • Database • Specialty catalogs • Business-to-business 11-39
  • 40.
    Direct Response Media •Television • Radio • Magazines • Newspapers 11-40
  • 41.
    Internet • Direct responseto ads • Cost-effective • Builds relationships • Personalization of communication • Customization of offer • Search engine ads 11-41
  • 42.
    Alternative Media • • • • Packageinsert programs (PIPs) Ride-a-longs Statement stuffers Card packs 11-42
  • 43.
    Telemarketing • Inbound telemarketing •Cross-selling • Outbound telemarketing • Cold calling • Database • Prospects 11-43
  • 44.
    International Implications • Differencesin technology • Laws and regulations • Local customs • Infrastructure 11-44