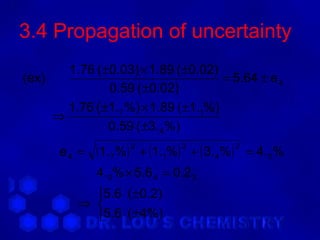
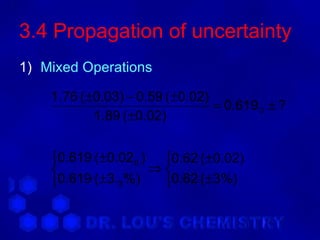
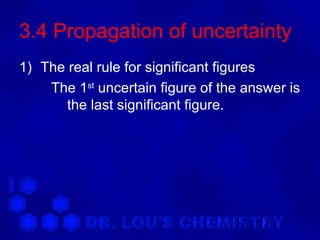
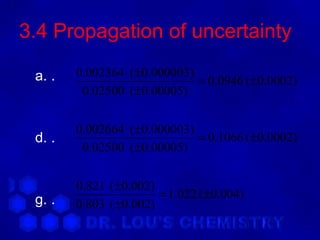
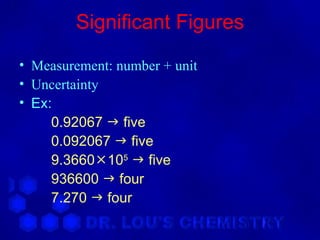
The document discusses significant figures and types of errors in measurement, explaining how to determine the number of significant figures in calculations using addition, subtraction, multiplication, division, and logarithms. It also covers absolute and relative uncertainty, propagation of uncertainty through calculations, and the rule for determining the number of significant figures in the answer of a calculation involving measurements with uncertainty.

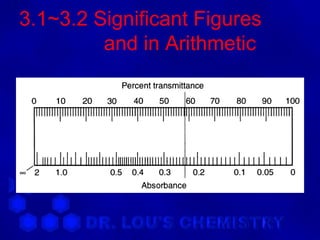
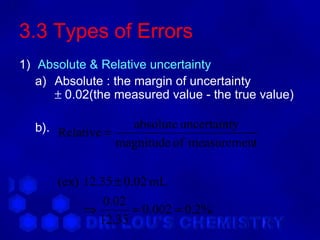
![Significant Figures
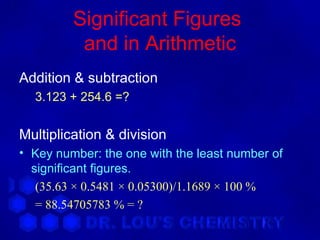
and in Arithmetic
Logarithms & antilog, see p54-55
[H+]=2.010-3
pH=-log(2.010-3) = -(-3+0.30)=2.70
antilogarithm of 0.072 ⇒ 1.18
logarithm of 12.1 ⇒ 1.083
log 339 = 2.5301997… = 2.530
antilog (-3.42) = 10-3.42 = 0.0003802
= 3.8x10-4](https://image.slidesharecdn.com/chapter03-120603234242-phpapp01/85/Chapter-03-5-320.jpg)