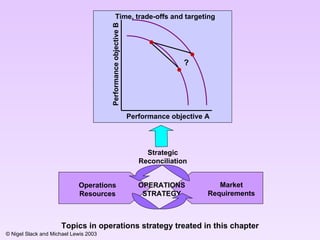
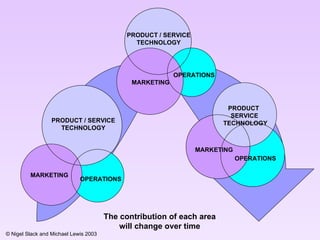
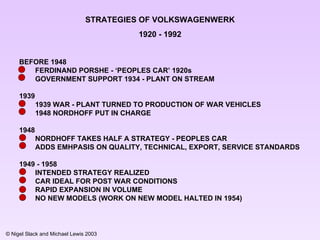
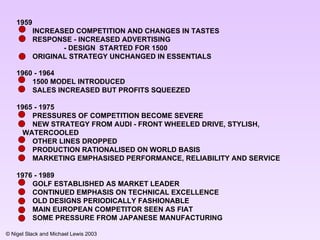
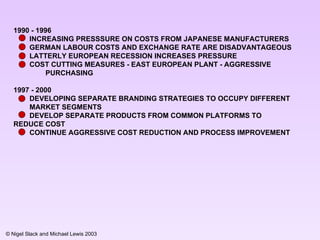
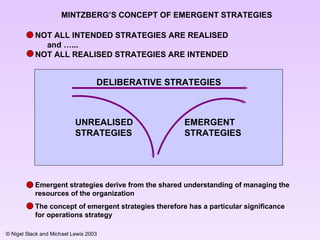
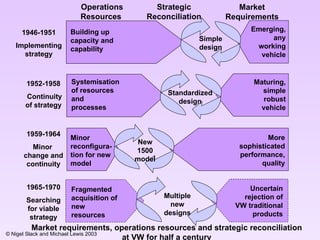
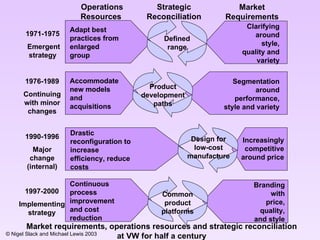
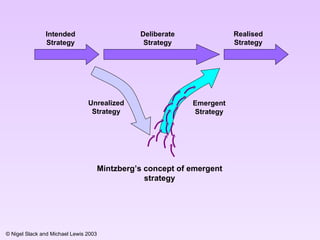
? Topics in operations strategy treated in this chapter Time, trade-offs and targeting Performance  objective  A Performance  objective  B Operations Resources Market Requirements OPERATIONS STRATEGY Strategic Reconciliation
PRODUCT/SERVICE TECHNOLOGY MARKETING OPERATIONS Where does the business get its competitive advantage? The “technological” specification of its product/service? The way it positions itself in its market? The way it produces its goods and services?
OPERATIONS MARKETING OPERATIONS PRODUCT / SERVICE TECHNOLOGY OPERATIONS MARKETING PRODUCT  SERVICE  TECHNOLOGY The contribution of each area will change over time MARKETING PRODUCT / SERVICE TECHNOLOGY
STRATEGIES OF VOLKSWAGENWERK 1920 - 1992 BEFORE 1948 FERDINAND PORSHE - ‘PEOPLES CAR’ 1920s GOVERNMENT SUPPORT 1934 - PLANT ON STREAM 1939 1939 WAR - PLANT TURNED TO PRODUCTION OF WAR VEHICLES 1948 NORDHOFF PUT IN CHARGE 1948 NORDHOFF TAKES HALF A STRATEGY - PEOPLES CAR ADDS EMHPASIS ON QUALITY, TECHNICAL, EXPORT, SERVICE STANDARDS 1949 - 1958 INTENDED STRATEGY REALI Z ED CAR IDEAL FOR POST WAR CONDITIONS RAPID EXPANSION IN VOLUME NO NEW MODELS (WORK ON NEW MODEL HALTED IN 1954)
1960 - 1964 1500 MODEL INTRODUCED SALES INCREASED BUT PROFITS SQUEEZED 1965 - 1975 PRESSURES OF COMPETITION BECOME SEVERE NEW STRATEGY FROM AUDI - FRONT WHEELED DRIVE, STYLISH,  WATERCOOLED OTHER LINES DROPPED PRODUCTION RATIONALISED ON WORLD BASIS MARKETING EMPHASISED PERFORMANCE, RELIABILITY AND SERVICE 1976 - 1989 GOLF ESTABLISHED AS MARKET LEADER CONTINUED EMPHASIS ON TECHNICAL EXCELLENCE OLD DESIGNS PERIODICALLY FASHIONABLE MAIN EUROPEAN COMPETITOR SEEN AS FIAT SOME PRESSURE FROM JAPANESE MANUFACTURING 1959 INCREASED COMPETITION AND CHANGES IN TASTES RESPONSE - INCREASED ADVERTISING    - DESIGN  STARTED FOR 1500  ORIGINAL STRATEGY UNCHANGED IN ESSENTIALS
1990 - 1996 INCREASING PRESSSURE ON COSTS FROM JAPANESE MANUFACTURERS GERMAN LABOUR COSTS AND EXCHANGE RATE ARE DISADVANTAGEOUS LATTERLY EUROPEAN RECESSION INCREASES PRESSURE COST CUTTING MEASURES - EAST EUROPEAN PLANT - AGGRESSIVE  PURCHASING 1997 - 2000 DEVELOPING SEPARATE BRANDING STRATEGIES TO OCCUPY DIFFERENT  MARKET SEGMENTS DEVELOP SEPARATE PRODUCTS FROM COMMON PLATFORMS TO  REDUCE COST  CONTINUE AGGRESSIVE COST REDUCTION AND PROCESS IMPROVEMENT
MINTZBERG’S CONCEPT OF EMERGENT STRATEGIES NOT ALL INTENDED STRATEGIES ARE REALISED and …... NOT ALL REALISED STRATEGIES ARE INTENDED Emergent strategies derive from the shared understanding of managing the resources of the organization The concept of emergent strategies therefore has a particular significance for operations strategy DELIBERATIVE STRATEGIES UNREALISED STRATEGIES EMERGENT STRATEGIES
Market Requirements Strategic Reconciliation Operations Resources  Emerging, any working vehicle Maturing, simple robust vehicle More sophisticated performance, quality Uncertain rejection of VW traditional products Building up capacity and capability Systemi s ation of resources  and processes Minor reconfigura-tion for new model Fragmented acquisition of new resources Multiple new designs New 1500 model Standardi z ed design 1946-1951 Implementing strategy 1952-1958 Continuity of strategy 1959-1964 Minor  change and continuity 1965-1970 Searching for viable strategy Simple design Market requirements, operations resources and strategic reconciliation at VW for half a century
Clarifying around style, quality and variety Segmentation around performance, style and variety Increasingly competitive around price Branding with price, quality, and style Adapt best practices from enlarged group Accommodate new models and acquisitions  Drastic reconfiguration to increase efficiency, reduce costs Continuous process improvement and cost reduction Common product platforms Design for low - cost manufacture Product development paths Defined range 1971-1975 Emergent strategy 1976-1989 Continuing with minor changes 1990-1996 Major change (internal) 1997-2000 Implementing strategy Market Requirements Strategic Reconciliation Operations Resources  Market requirements, operations resources and strategic reconciliation at VW for half a century
Intended Strategy Realised Strategy Deliberate Strategy Mintzberg’s concept of emergent strategy Unrealized Strategy Emergent Strategy
Order winners and  q ualifiers Low High Negative Order Winners Qualifiers Positive Neutral Achieved Performance Competitive Benefit
Adding ‘Delights’ Low High Negative Order Winners Qualifiers Positive Neutral Achieved Performance Competitive Benefit Delights
Low High Negative Order Winners Qualifiers Positive Neutral Achieved Performance Competitive Benefit Delights Delights become order winners and order winners become qualifiers
What service dimensions are delight, order winners and qualifiers – now, and in the future? Delights Order Winners Qualifiers Today Tomorrow
Delights Order Winners Qualifiers Today Tomorrow Budget Hotel Chain Central reservation Location (autoroutes) Location (restaurants) Price Loyalty cards Central reservation Location (autoroutes) Location  (restaurants) Price Loyalty cards Cleanliness Décor Cleanliness Décor Service ?
Delights Order Winners Qualifiers Today Tomorrow Central reservation Price Location (autoroutes) Location (restaurants) Price Loyalty cards Central reservation Location (autoroutes) Location (restaurants) Location  (restaurants) Price Loyalty cards Cleanliness Décor Cleanliness Décor Service ? Budget Hotel Chain
Delights Order Winners Qualifiers Central reservation Location (autoroutes) Location (restaurants) Location  (restaurants) Price Loyalty cards Cleanliness Decor Price What aspects of service will form tomorrows delights, order winners and qualifiers? What new capabilities will operations need to develop to deliver these? More, smaller sites Cheap land costs Build at low cost Operate at low cost  Search processes Flexible design Low fixed costs Standardi z ation Low overheads Low labor costs New technology Partnership deals with restaurants Budget Hotel Chain
Trade-offs “ Do you want it good, or do you want it Tuesday?” “ No such thing as a free lunch.” “ You can’t have an aircraft which flies at the speed of sound, carries 400 passengers and lands on an aircraft carrier. Operations are just the same.”  (Skinner) “ Trade-offs in operations are the way we are willing to sacrifice one performance objective to achieve excellence in another.”
Competitive Objective A Competitive Objective B Model II: Pivot and Function  (Slack, 1991) Competitive Objective A Competitive Objective B Model I:  Function  (Skinner, 1992: Hayes and Pisano, 1996) Two ways of illustrating the trade-off concept
Performance measure A Performance measure B “ Natural” Frontier of Performance X Y Three schools of trade-off thought “ It’s all about positioning” (e.g. Skinner) “ Must aim to be good at everything” (e.g. Schonberger) “ You have to choose when to reposition and when to overcome trade-offs through improvement” (e.g. Hayes and Pisano) Y 1 Y 2 Y 3 X 3 X 2 X 1 X Z Y Performance measure A Performance measure B Performance measure A Performance measure B
Trade-off changed because improved system attributes have enabled both A and B to be improved without changing their relative position Pivot Base + Base  A B Trade-off changed because improved system attributes have enabled  A to be improved without reduction in B Pivot Base + Base  A B Trade-off changed because A is now required to have higher performance but system attributes have not improved so performance of B is lower. Pivot Base  A B Pivot Base  A B Original trade-off  Improve Net improvement in performance because trade-off is overcome Reposition Change in relative performance of competitive objectives Repositioning vs.improvement
Service good bad Degree and number of service checks Cost of providing service Average waiting time for service Cost of providing service Ability to keep waiting time short even in peak periods vs. Cost of providing service Range of services offered Cost of providing service Examples of services vs. cost trade-offs at an auto quick fit center vs. vs. vs. Cost  good bad
vs. vs. vs. Service C apital expenditure   good bad vs. Examples of services vs. c apital expenditure  at an auto quick fit center Degree and number of service checks Average waiting time for service Ability to keep waiting time short even in peak periods Range of services offered Capital cost of purchasing computer diagnostics equipment Capital cost of providing extra physical capacity or automated processes Capital cost of providing extra capacity for peak loading Capital cost of purchasing wider range of equipment good bad
C apital expenditure   good bad Service vs. Capital cost of providing computer diagnostic equipment Cost of providing service Examples of  cost  vs. c apital expenditure  at an auto quick fit center good bad
Working capital   good bad Service vs. Level of parts inventory kept in stock Ability to replace part without any delay Working capital  good bad Cost vs. Level of parts inventory kept in stock Cost of arranging for out of stock part to be delivered Working capital  good bad Capital expenditure vs. Level of parts inventory kept in stock Capital expenditure on storage space Examples of  working capital related trade-offs at an  auto quick fit center good bad good bad good bad
Capital expenditure Cost Service Working capital versus versus versus versus versus versus Trade-off categories
Performance  objective  A Performance  objective  B Y X Extended performance frontier Natural performance frontier Area Q Area P Z Reconciliation as improvement by pushing back the performance frontier of a trade-off
Cost  performance Variety ‘ Normal’ operation trade-off frontier zone Trade-off curve of operation designed for narrow range of activities only Trade-off curves are (a) broad representations of a performance frontier zone; (b) dependent on how the operations have been designed B A
Market segment A Market segment B Operation A Operation B Operation C Market segment A Market segment B Market segment C Operation A Operation B Operation C Market and operations segmentation matched Market and operations segmentation not matched Segmentation of markets and operations resources Market segment C
Island Army 1 Army 2 Burning bridges behind you increases commitment but reduces flexibility
Learning and improvement Structural vulnerability but but but Operations Resources Market Requirements Strategic reconciliation Clearly  focused resources Appropriate resources Limited capabilities Risk of market change Clearly targeted market Clarity of objectives Focused operations can exhibit positive and negative characteristics in both market and operations perspectives
1st trade-off Staff scheduling in retail loans Response time Utilisation of staff 2nd trade-off Level of service purchased from credit agency Operational cost of credit information Speed and quality of information 3rd trade-off Retail loans on-site investment Operations cost and speed of service Capital investment in ‘retail’ system 4th trade-off Insurance IT system investment  Range of services possible  Investment in multi-function system Three trade-offs in the Call Center example
B A Ideal performance Quality of service Limited Broad Superficial Specific Range of services B A Quality of service High Low Superficial Specific Cost of providing services Ideal performance
A Ideal performance Quality of service Limited Broad Superficial Specific Range of services A Quality of service High Low Superficial Specific Cost of providing services Ideal performance C C A Ideal performance Quality of service Limited Broad Range of services A Quality of service High Low Cost of providing services Ideal performance
A Ideal performance Quality of service Limited Broad Superficial Specific Range of services A Quality of service High Low Superficial Specific Cost of providing services Ideal performance A Ideal performance Quality of service Limited Broad Range of services A Quality of service High Low Cost of providing services Ideal performance C C D D

Chap03

  • 1.
    ? Topics inoperations strategy treated in this chapter Time, trade-offs and targeting Performance objective A Performance objective B Operations Resources Market Requirements OPERATIONS STRATEGY Strategic Reconciliation
  • 2.
    PRODUCT/SERVICE TECHNOLOGY MARKETINGOPERATIONS Where does the business get its competitive advantage? The “technological” specification of its product/service? The way it positions itself in its market? The way it produces its goods and services?
  • 3.
    OPERATIONS MARKETING OPERATIONSPRODUCT / SERVICE TECHNOLOGY OPERATIONS MARKETING PRODUCT SERVICE TECHNOLOGY The contribution of each area will change over time MARKETING PRODUCT / SERVICE TECHNOLOGY
  • 4.
    STRATEGIES OF VOLKSWAGENWERK1920 - 1992 BEFORE 1948 FERDINAND PORSHE - ‘PEOPLES CAR’ 1920s GOVERNMENT SUPPORT 1934 - PLANT ON STREAM 1939 1939 WAR - PLANT TURNED TO PRODUCTION OF WAR VEHICLES 1948 NORDHOFF PUT IN CHARGE 1948 NORDHOFF TAKES HALF A STRATEGY - PEOPLES CAR ADDS EMHPASIS ON QUALITY, TECHNICAL, EXPORT, SERVICE STANDARDS 1949 - 1958 INTENDED STRATEGY REALI Z ED CAR IDEAL FOR POST WAR CONDITIONS RAPID EXPANSION IN VOLUME NO NEW MODELS (WORK ON NEW MODEL HALTED IN 1954)
  • 5.
    1960 - 19641500 MODEL INTRODUCED SALES INCREASED BUT PROFITS SQUEEZED 1965 - 1975 PRESSURES OF COMPETITION BECOME SEVERE NEW STRATEGY FROM AUDI - FRONT WHEELED DRIVE, STYLISH, WATERCOOLED OTHER LINES DROPPED PRODUCTION RATIONALISED ON WORLD BASIS MARKETING EMPHASISED PERFORMANCE, RELIABILITY AND SERVICE 1976 - 1989 GOLF ESTABLISHED AS MARKET LEADER CONTINUED EMPHASIS ON TECHNICAL EXCELLENCE OLD DESIGNS PERIODICALLY FASHIONABLE MAIN EUROPEAN COMPETITOR SEEN AS FIAT SOME PRESSURE FROM JAPANESE MANUFACTURING 1959 INCREASED COMPETITION AND CHANGES IN TASTES RESPONSE - INCREASED ADVERTISING - DESIGN STARTED FOR 1500 ORIGINAL STRATEGY UNCHANGED IN ESSENTIALS
  • 6.
    1990 - 1996INCREASING PRESSSURE ON COSTS FROM JAPANESE MANUFACTURERS GERMAN LABOUR COSTS AND EXCHANGE RATE ARE DISADVANTAGEOUS LATTERLY EUROPEAN RECESSION INCREASES PRESSURE COST CUTTING MEASURES - EAST EUROPEAN PLANT - AGGRESSIVE PURCHASING 1997 - 2000 DEVELOPING SEPARATE BRANDING STRATEGIES TO OCCUPY DIFFERENT MARKET SEGMENTS DEVELOP SEPARATE PRODUCTS FROM COMMON PLATFORMS TO REDUCE COST CONTINUE AGGRESSIVE COST REDUCTION AND PROCESS IMPROVEMENT
  • 7.
    MINTZBERG’S CONCEPT OFEMERGENT STRATEGIES NOT ALL INTENDED STRATEGIES ARE REALISED and …... NOT ALL REALISED STRATEGIES ARE INTENDED Emergent strategies derive from the shared understanding of managing the resources of the organization The concept of emergent strategies therefore has a particular significance for operations strategy DELIBERATIVE STRATEGIES UNREALISED STRATEGIES EMERGENT STRATEGIES
  • 8.
    Market Requirements StrategicReconciliation Operations Resources Emerging, any working vehicle Maturing, simple robust vehicle More sophisticated performance, quality Uncertain rejection of VW traditional products Building up capacity and capability Systemi s ation of resources and processes Minor reconfigura-tion for new model Fragmented acquisition of new resources Multiple new designs New 1500 model Standardi z ed design 1946-1951 Implementing strategy 1952-1958 Continuity of strategy 1959-1964 Minor change and continuity 1965-1970 Searching for viable strategy Simple design Market requirements, operations resources and strategic reconciliation at VW for half a century
  • 9.
    Clarifying around style,quality and variety Segmentation around performance, style and variety Increasingly competitive around price Branding with price, quality, and style Adapt best practices from enlarged group Accommodate new models and acquisitions Drastic reconfiguration to increase efficiency, reduce costs Continuous process improvement and cost reduction Common product platforms Design for low - cost manufacture Product development paths Defined range 1971-1975 Emergent strategy 1976-1989 Continuing with minor changes 1990-1996 Major change (internal) 1997-2000 Implementing strategy Market Requirements Strategic Reconciliation Operations Resources Market requirements, operations resources and strategic reconciliation at VW for half a century
  • 10.
    Intended Strategy RealisedStrategy Deliberate Strategy Mintzberg’s concept of emergent strategy Unrealized Strategy Emergent Strategy
  • 11.
    Order winners and q ualifiers Low High Negative Order Winners Qualifiers Positive Neutral Achieved Performance Competitive Benefit
  • 12.
    Adding ‘Delights’ LowHigh Negative Order Winners Qualifiers Positive Neutral Achieved Performance Competitive Benefit Delights
  • 13.
    Low High NegativeOrder Winners Qualifiers Positive Neutral Achieved Performance Competitive Benefit Delights Delights become order winners and order winners become qualifiers
  • 14.
    What service dimensionsare delight, order winners and qualifiers – now, and in the future? Delights Order Winners Qualifiers Today Tomorrow
  • 15.
    Delights Order WinnersQualifiers Today Tomorrow Budget Hotel Chain Central reservation Location (autoroutes) Location (restaurants) Price Loyalty cards Central reservation Location (autoroutes) Location (restaurants) Price Loyalty cards Cleanliness Décor Cleanliness Décor Service ?
  • 16.
    Delights Order WinnersQualifiers Today Tomorrow Central reservation Price Location (autoroutes) Location (restaurants) Price Loyalty cards Central reservation Location (autoroutes) Location (restaurants) Location (restaurants) Price Loyalty cards Cleanliness Décor Cleanliness Décor Service ? Budget Hotel Chain
  • 17.
    Delights Order WinnersQualifiers Central reservation Location (autoroutes) Location (restaurants) Location (restaurants) Price Loyalty cards Cleanliness Decor Price What aspects of service will form tomorrows delights, order winners and qualifiers? What new capabilities will operations need to develop to deliver these? More, smaller sites Cheap land costs Build at low cost Operate at low cost Search processes Flexible design Low fixed costs Standardi z ation Low overheads Low labor costs New technology Partnership deals with restaurants Budget Hotel Chain
  • 18.
    Trade-offs “ Doyou want it good, or do you want it Tuesday?” “ No such thing as a free lunch.” “ You can’t have an aircraft which flies at the speed of sound, carries 400 passengers and lands on an aircraft carrier. Operations are just the same.” (Skinner) “ Trade-offs in operations are the way we are willing to sacrifice one performance objective to achieve excellence in another.”
  • 19.
    Competitive Objective ACompetitive Objective B Model II: Pivot and Function (Slack, 1991) Competitive Objective A Competitive Objective B Model I: Function (Skinner, 1992: Hayes and Pisano, 1996) Two ways of illustrating the trade-off concept
  • 20.
    Performance measure APerformance measure B “ Natural” Frontier of Performance X Y Three schools of trade-off thought “ It’s all about positioning” (e.g. Skinner) “ Must aim to be good at everything” (e.g. Schonberger) “ You have to choose when to reposition and when to overcome trade-offs through improvement” (e.g. Hayes and Pisano) Y 1 Y 2 Y 3 X 3 X 2 X 1 X Z Y Performance measure A Performance measure B Performance measure A Performance measure B
  • 21.
    Trade-off changed becauseimproved system attributes have enabled both A and B to be improved without changing their relative position Pivot Base + Base A B Trade-off changed because improved system attributes have enabled A to be improved without reduction in B Pivot Base + Base A B Trade-off changed because A is now required to have higher performance but system attributes have not improved so performance of B is lower. Pivot Base A B Pivot Base A B Original trade-off Improve Net improvement in performance because trade-off is overcome Reposition Change in relative performance of competitive objectives Repositioning vs.improvement
  • 22.
    Service good badDegree and number of service checks Cost of providing service Average waiting time for service Cost of providing service Ability to keep waiting time short even in peak periods vs. Cost of providing service Range of services offered Cost of providing service Examples of services vs. cost trade-offs at an auto quick fit center vs. vs. vs. Cost good bad
  • 23.
    vs. vs. vs.Service C apital expenditure good bad vs. Examples of services vs. c apital expenditure at an auto quick fit center Degree and number of service checks Average waiting time for service Ability to keep waiting time short even in peak periods Range of services offered Capital cost of purchasing computer diagnostics equipment Capital cost of providing extra physical capacity or automated processes Capital cost of providing extra capacity for peak loading Capital cost of purchasing wider range of equipment good bad
  • 24.
    C apital expenditure good bad Service vs. Capital cost of providing computer diagnostic equipment Cost of providing service Examples of cost vs. c apital expenditure at an auto quick fit center good bad
  • 25.
    Working capital good bad Service vs. Level of parts inventory kept in stock Ability to replace part without any delay Working capital good bad Cost vs. Level of parts inventory kept in stock Cost of arranging for out of stock part to be delivered Working capital good bad Capital expenditure vs. Level of parts inventory kept in stock Capital expenditure on storage space Examples of working capital related trade-offs at an auto quick fit center good bad good bad good bad
  • 26.
    Capital expenditure CostService Working capital versus versus versus versus versus versus Trade-off categories
  • 27.
    Performance objective A Performance objective B Y X Extended performance frontier Natural performance frontier Area Q Area P Z Reconciliation as improvement by pushing back the performance frontier of a trade-off
  • 28.
    Cost performanceVariety ‘ Normal’ operation trade-off frontier zone Trade-off curve of operation designed for narrow range of activities only Trade-off curves are (a) broad representations of a performance frontier zone; (b) dependent on how the operations have been designed B A
  • 29.
    Market segment AMarket segment B Operation A Operation B Operation C Market segment A Market segment B Market segment C Operation A Operation B Operation C Market and operations segmentation matched Market and operations segmentation not matched Segmentation of markets and operations resources Market segment C
  • 30.
    Island Army 1Army 2 Burning bridges behind you increases commitment but reduces flexibility
  • 31.
    Learning and improvementStructural vulnerability but but but Operations Resources Market Requirements Strategic reconciliation Clearly focused resources Appropriate resources Limited capabilities Risk of market change Clearly targeted market Clarity of objectives Focused operations can exhibit positive and negative characteristics in both market and operations perspectives
  • 32.
    1st trade-off Staffscheduling in retail loans Response time Utilisation of staff 2nd trade-off Level of service purchased from credit agency Operational cost of credit information Speed and quality of information 3rd trade-off Retail loans on-site investment Operations cost and speed of service Capital investment in ‘retail’ system 4th trade-off Insurance IT system investment Range of services possible Investment in multi-function system Three trade-offs in the Call Center example
  • 33.
    B A Idealperformance Quality of service Limited Broad Superficial Specific Range of services B A Quality of service High Low Superficial Specific Cost of providing services Ideal performance
  • 34.
    A Ideal performanceQuality of service Limited Broad Superficial Specific Range of services A Quality of service High Low Superficial Specific Cost of providing services Ideal performance C C A Ideal performance Quality of service Limited Broad Range of services A Quality of service High Low Cost of providing services Ideal performance
  • 35.
    A Ideal performanceQuality of service Limited Broad Superficial Specific Range of services A Quality of service High Low Superficial Specific Cost of providing services Ideal performance A Ideal performance Quality of service Limited Broad Range of services A Quality of service High Low Cost of providing services Ideal performance C C D D