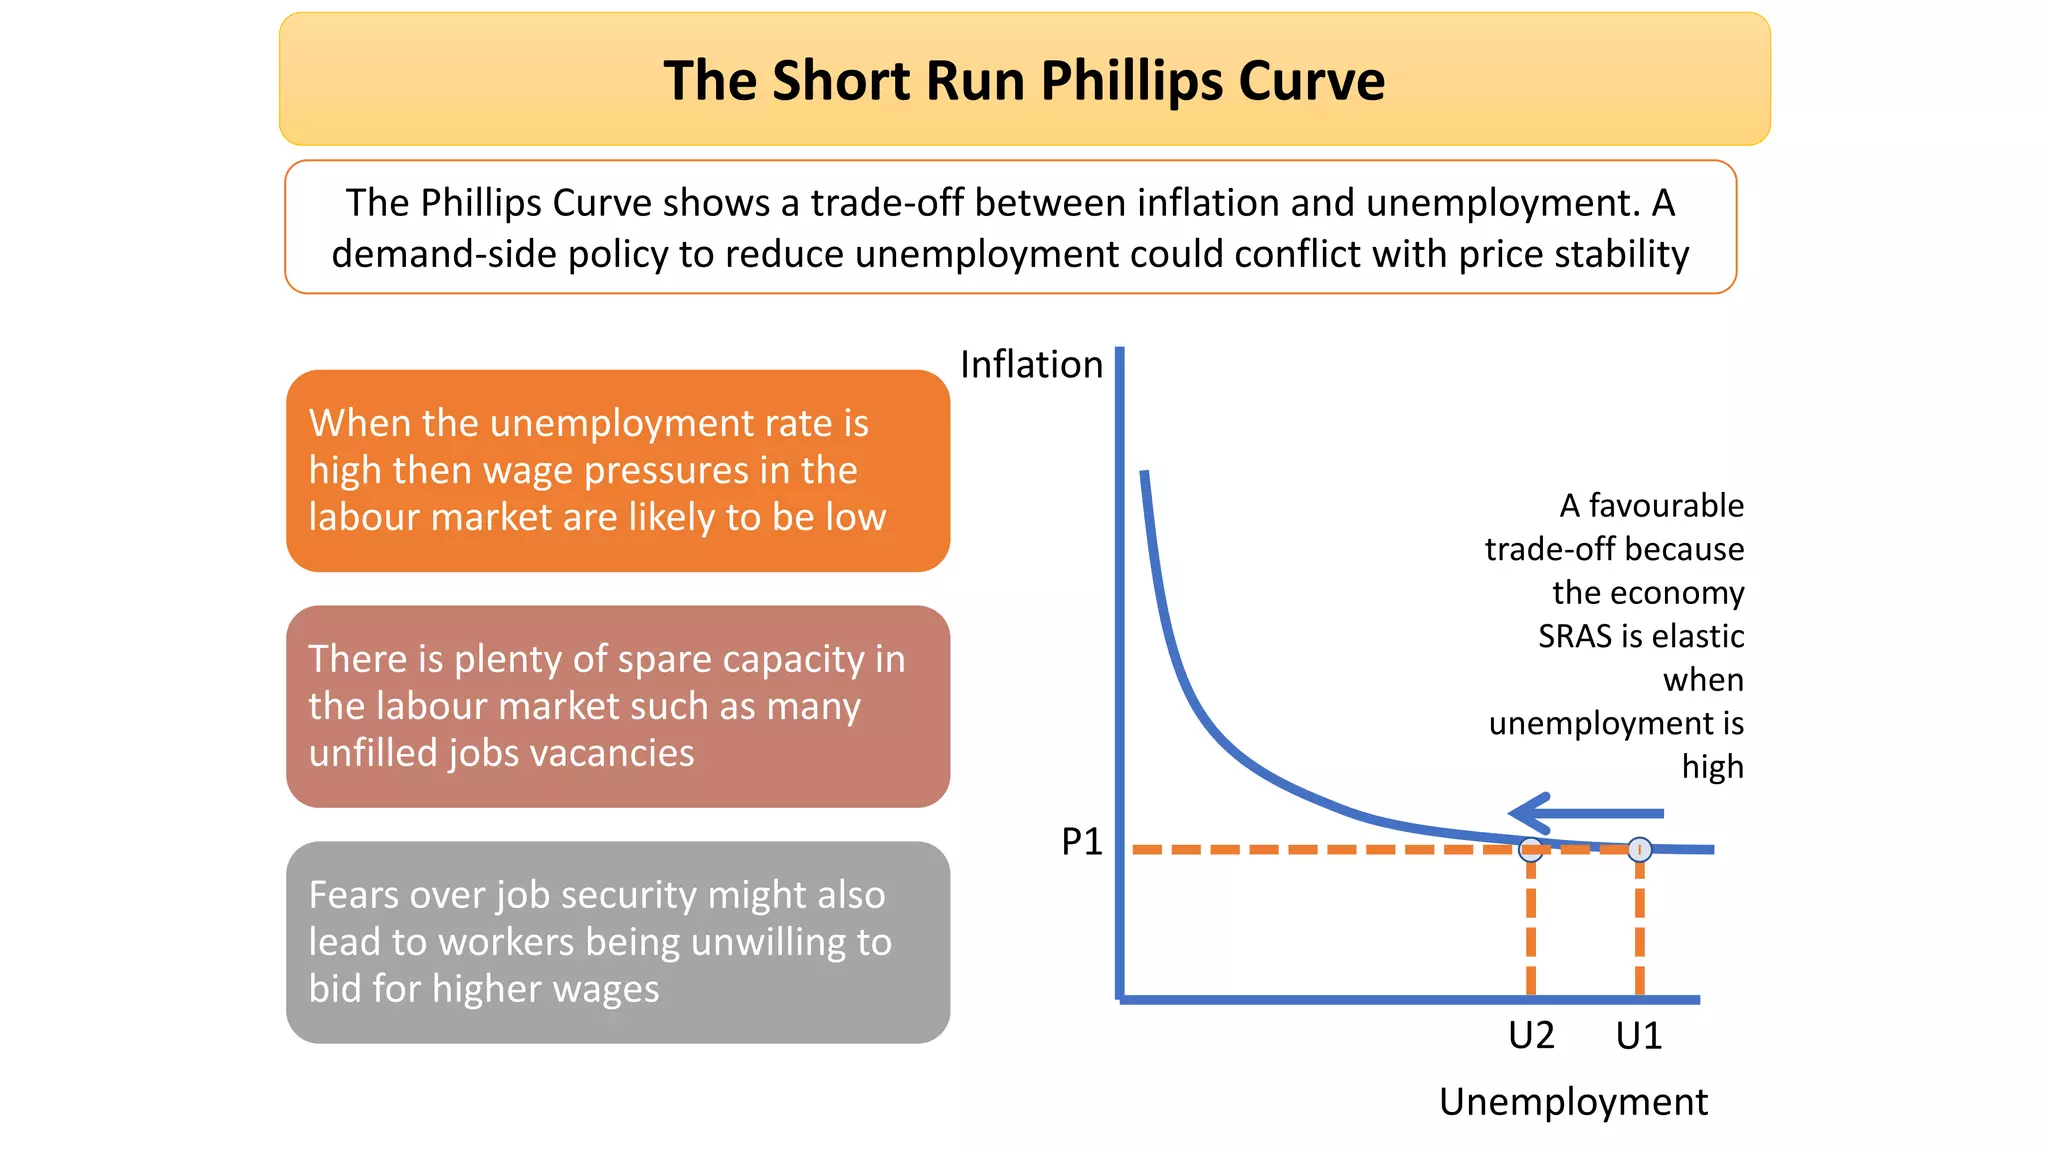
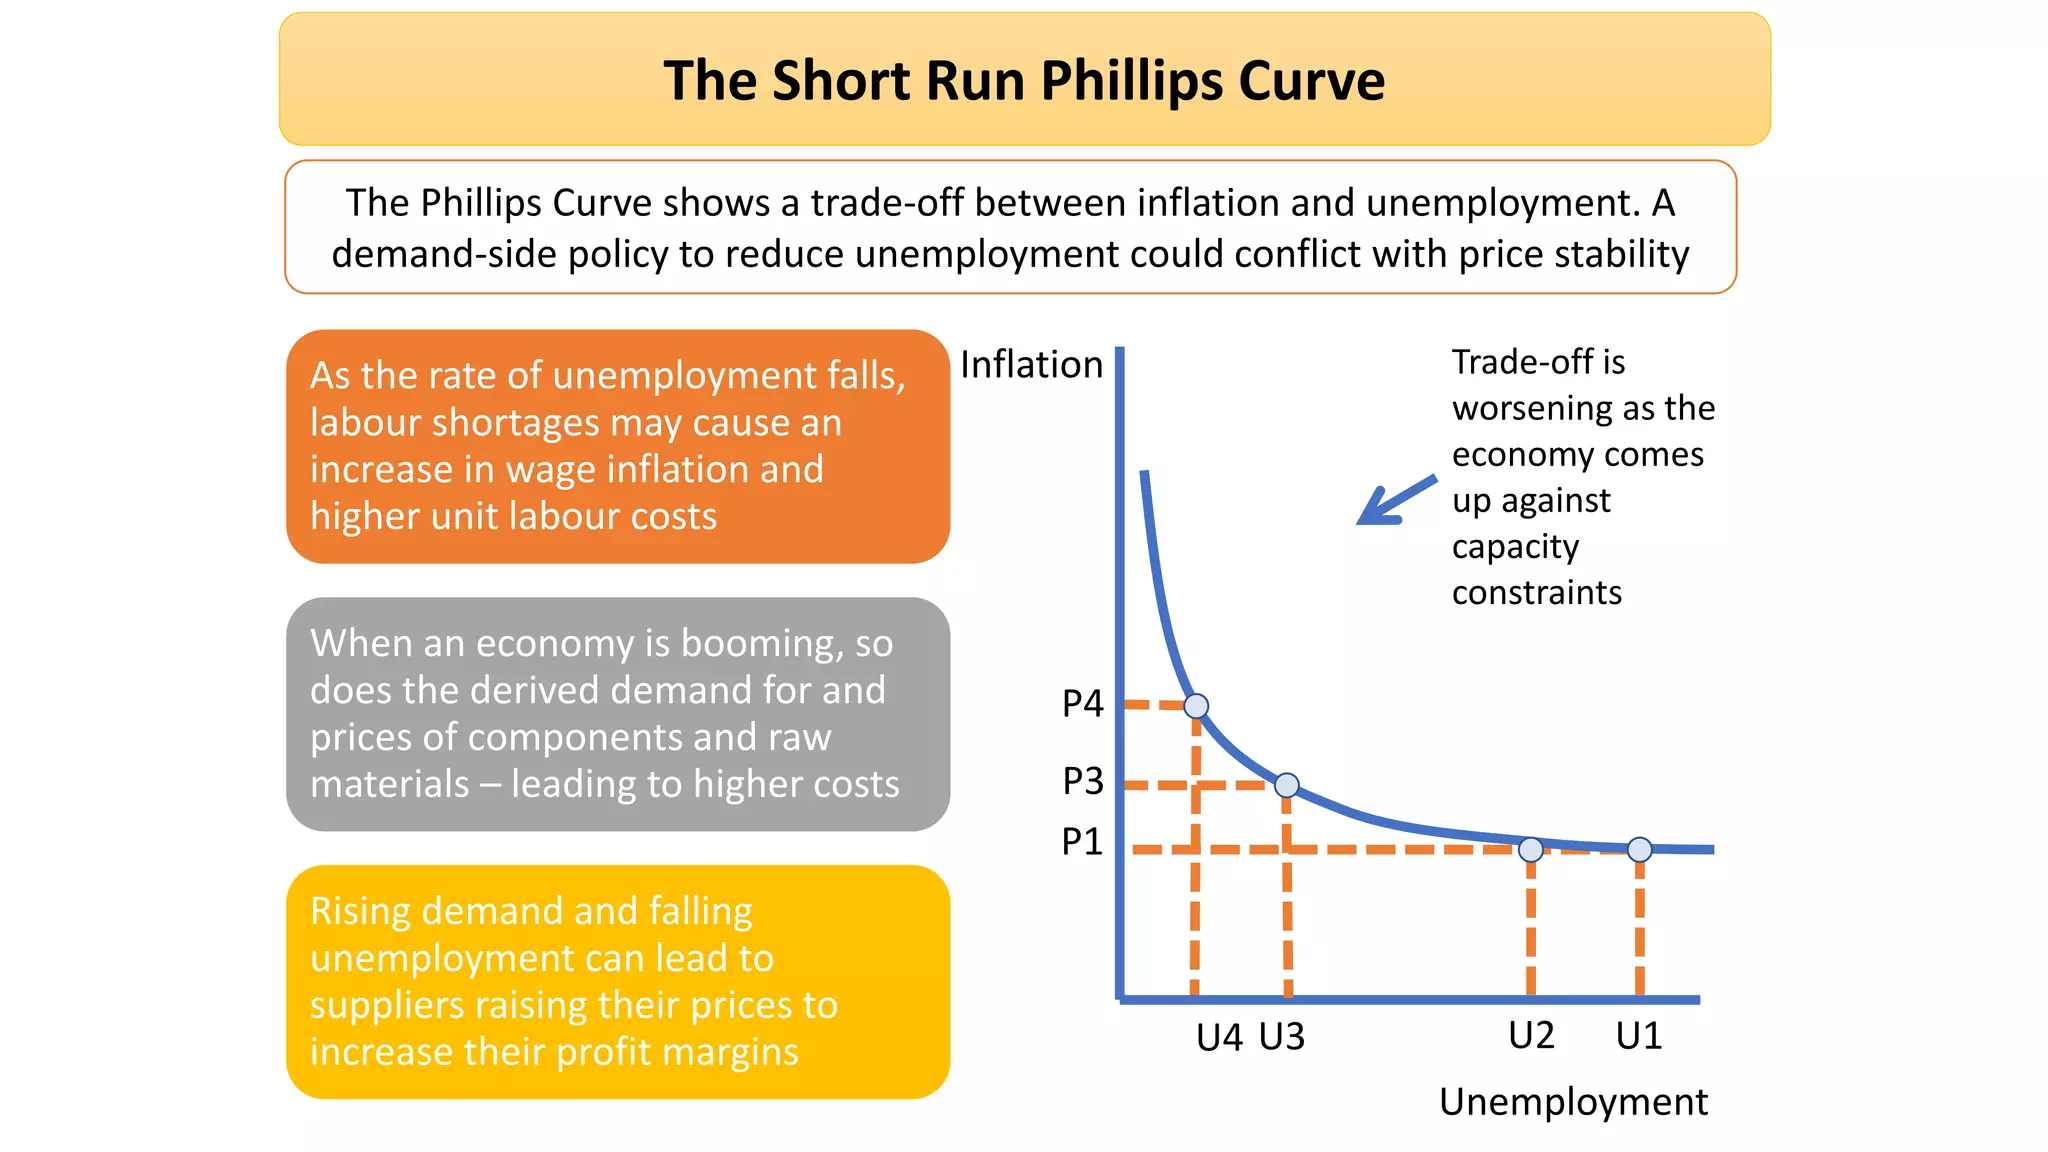
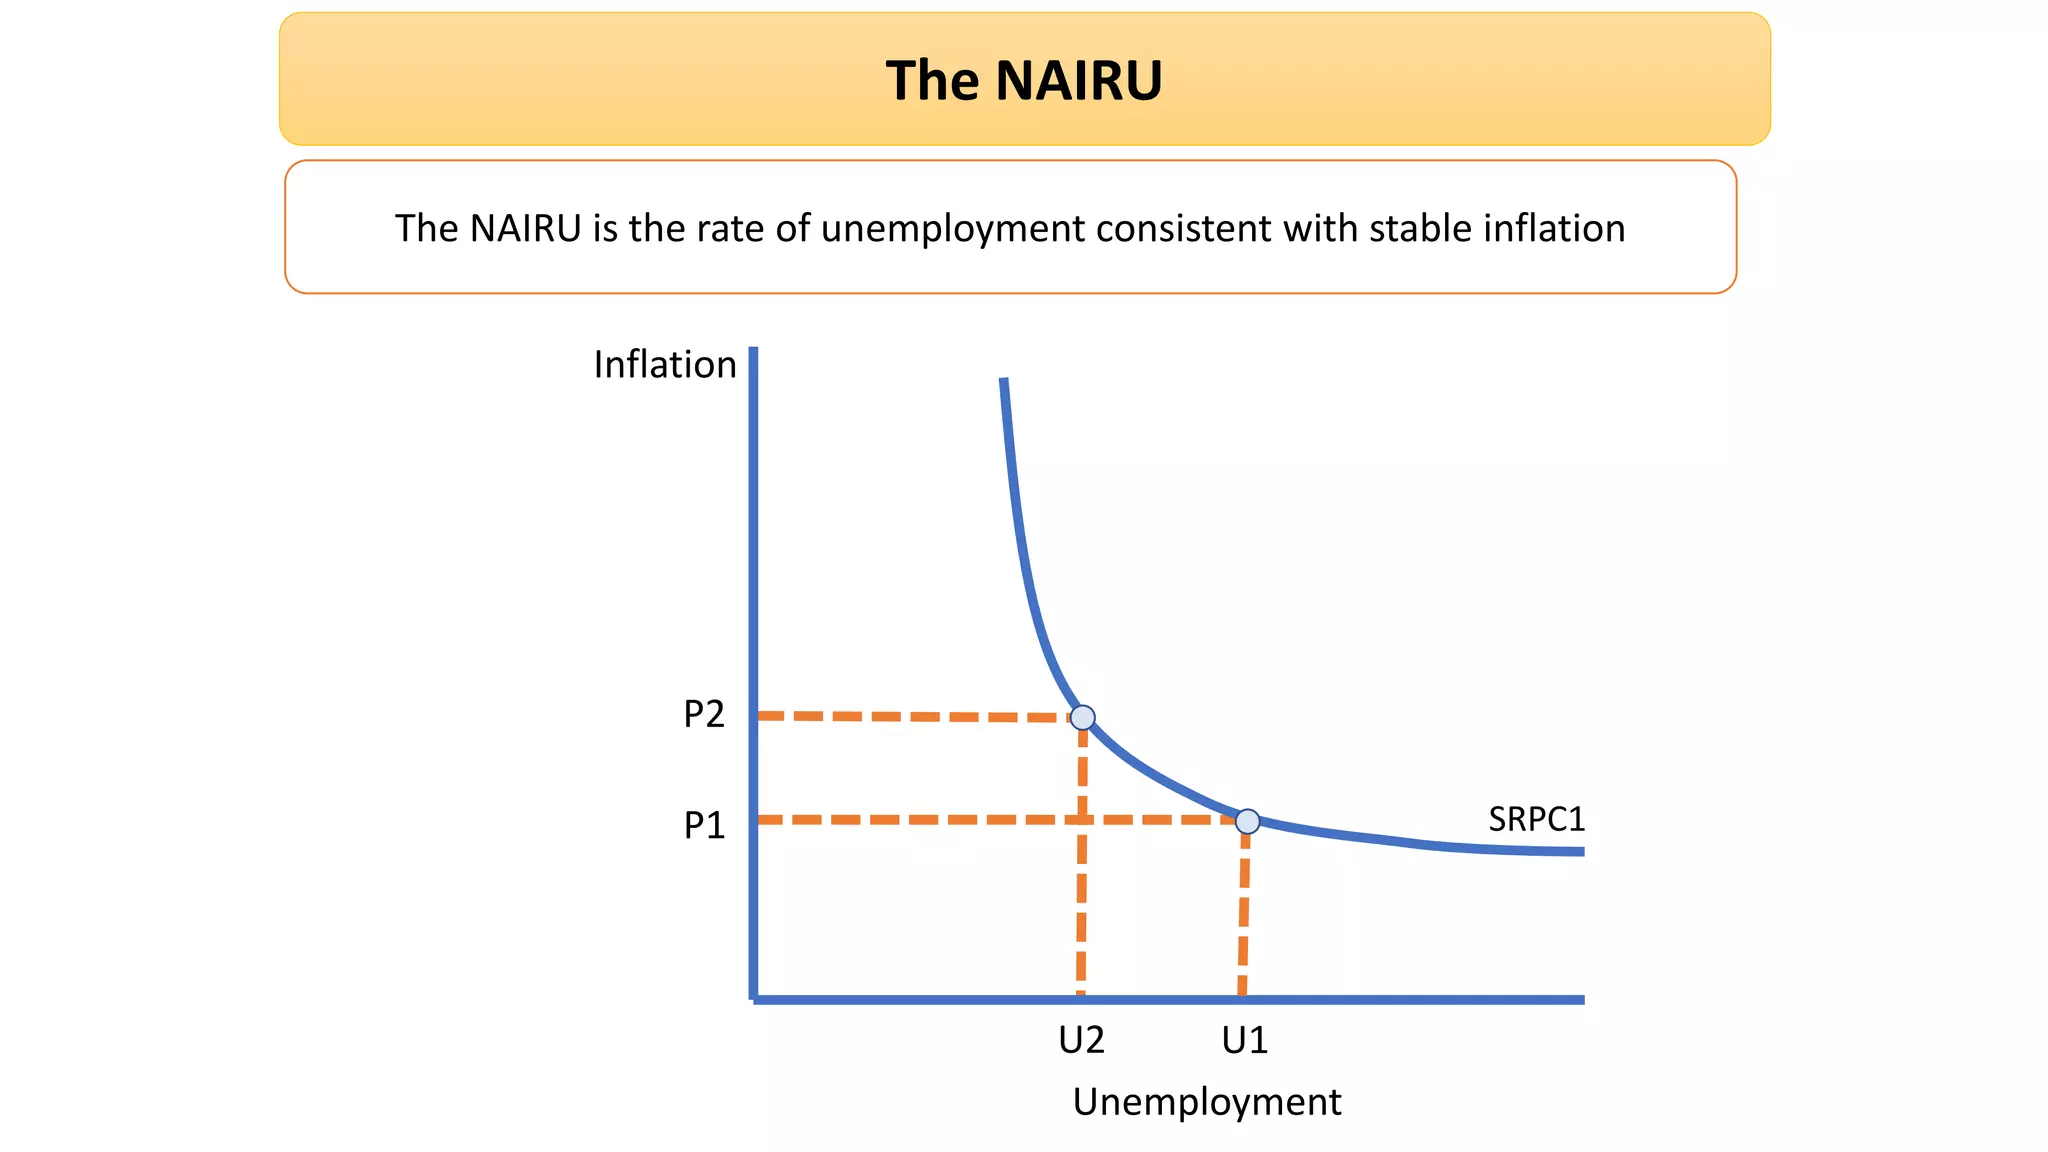
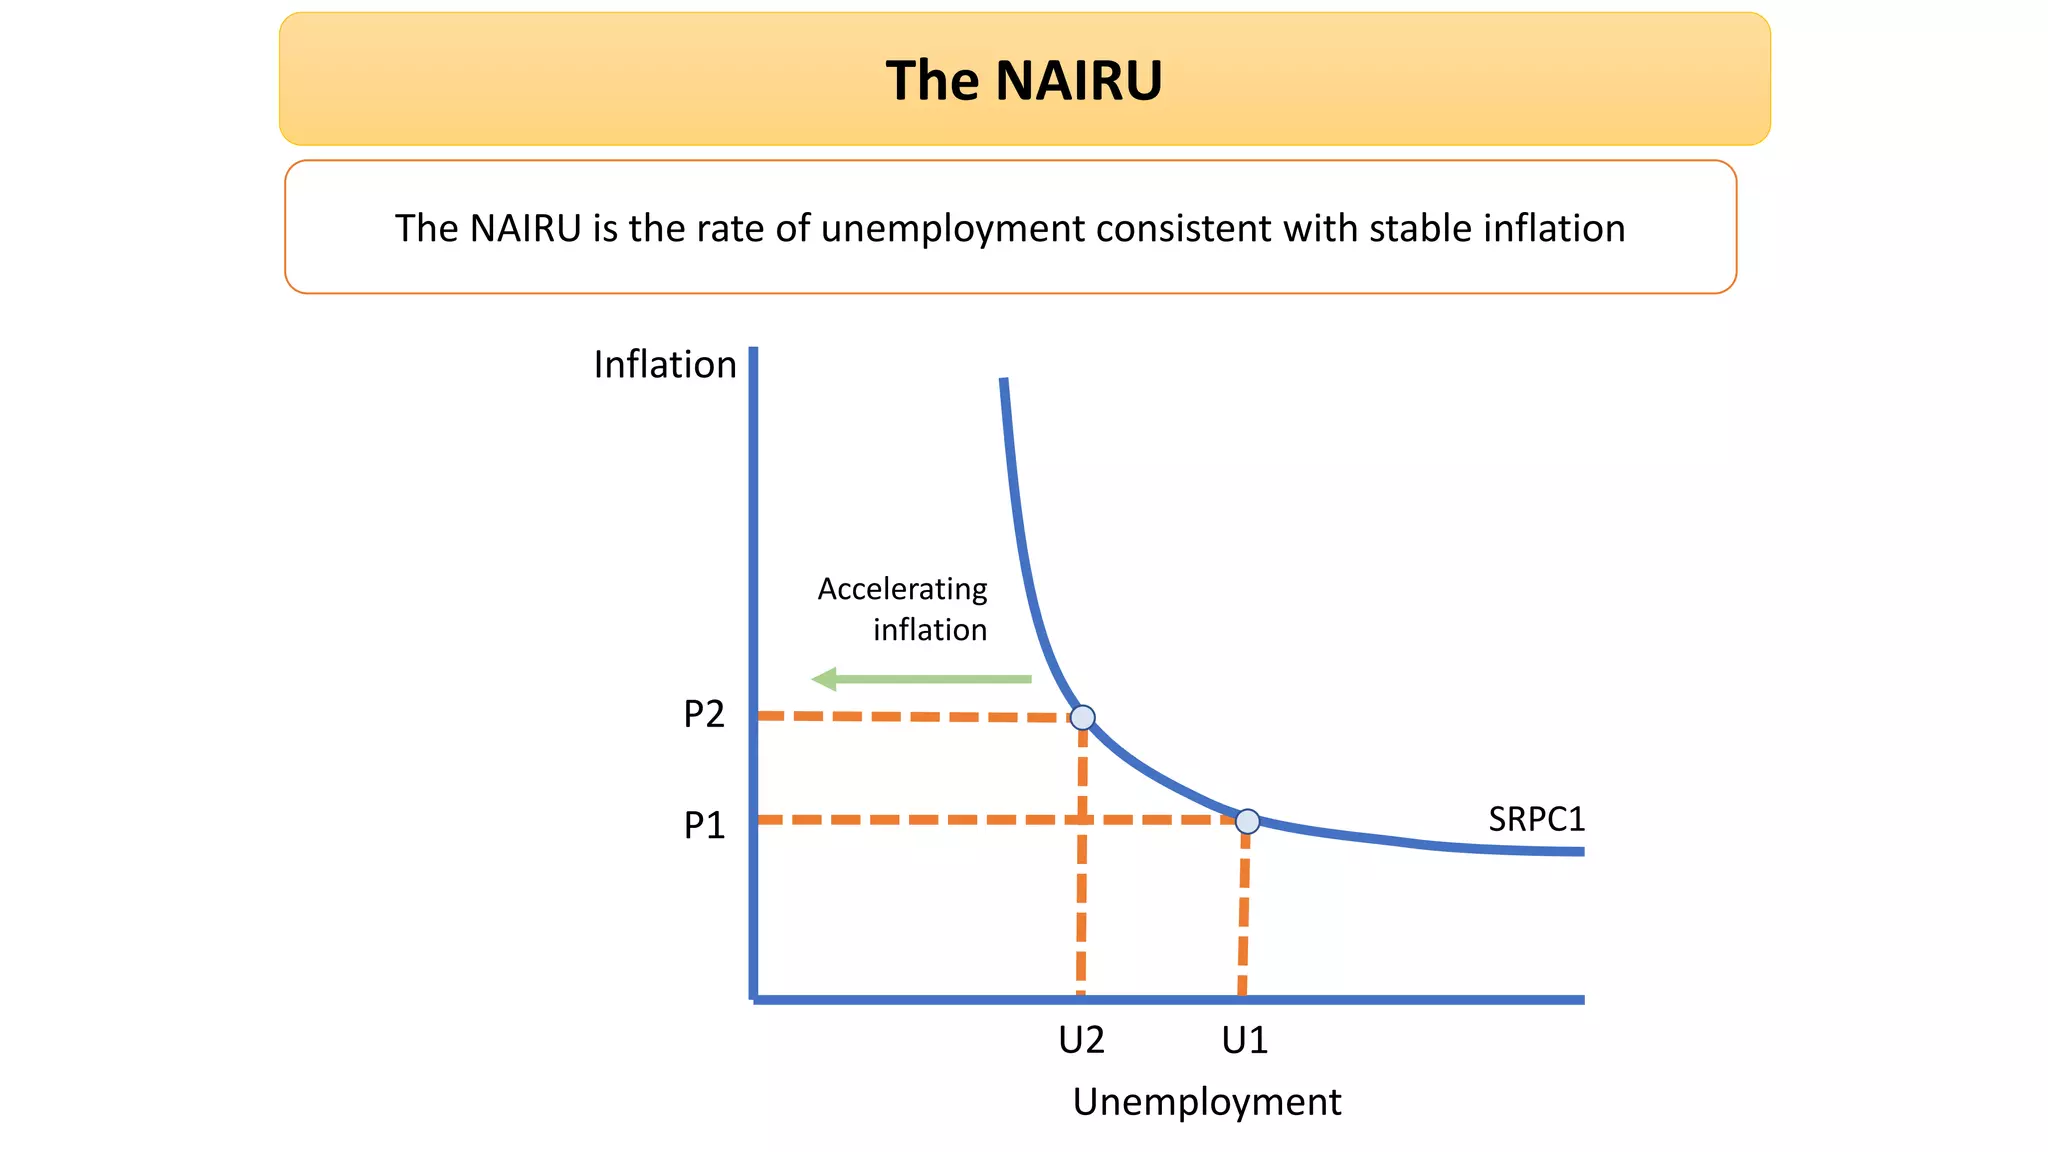
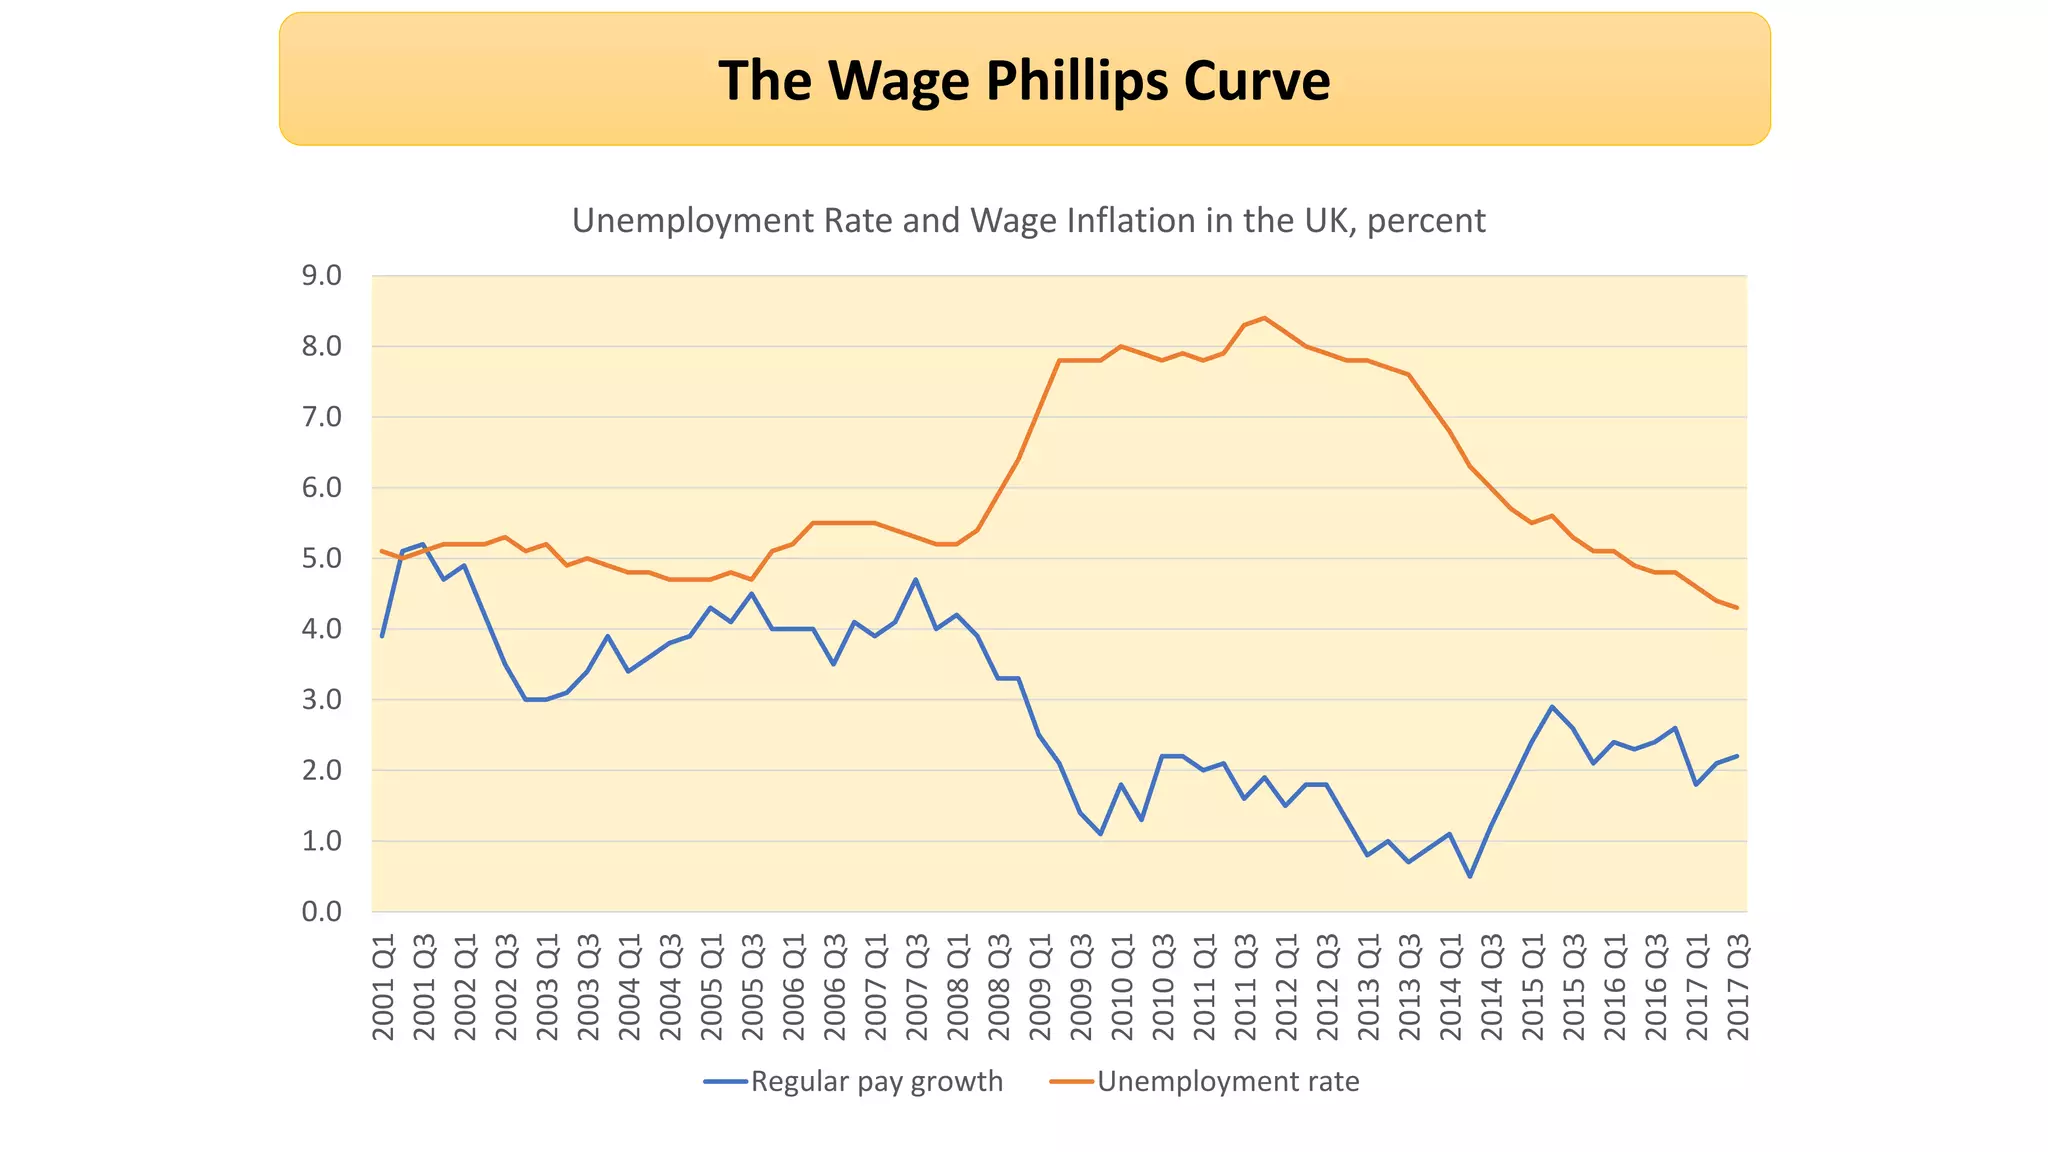
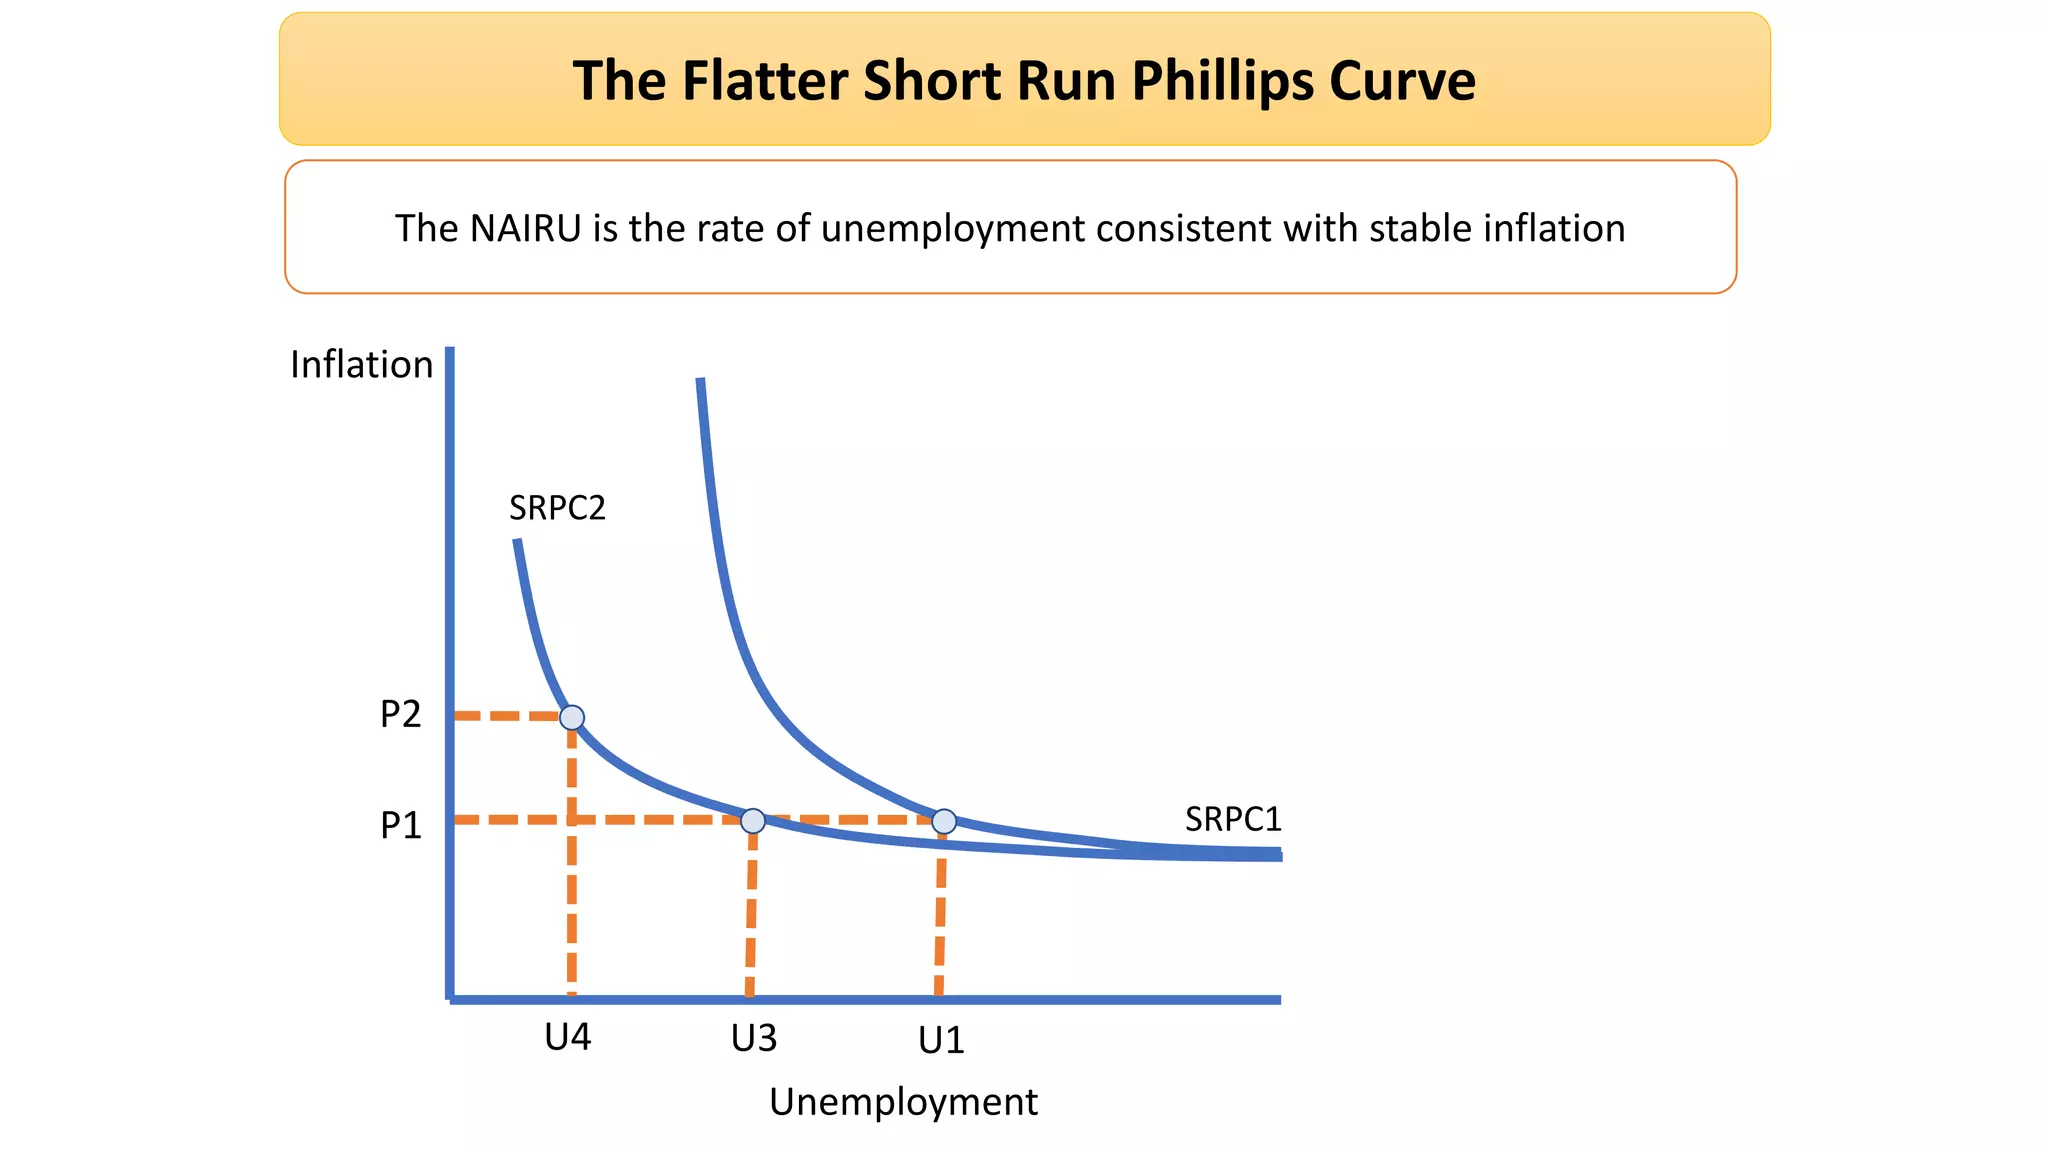
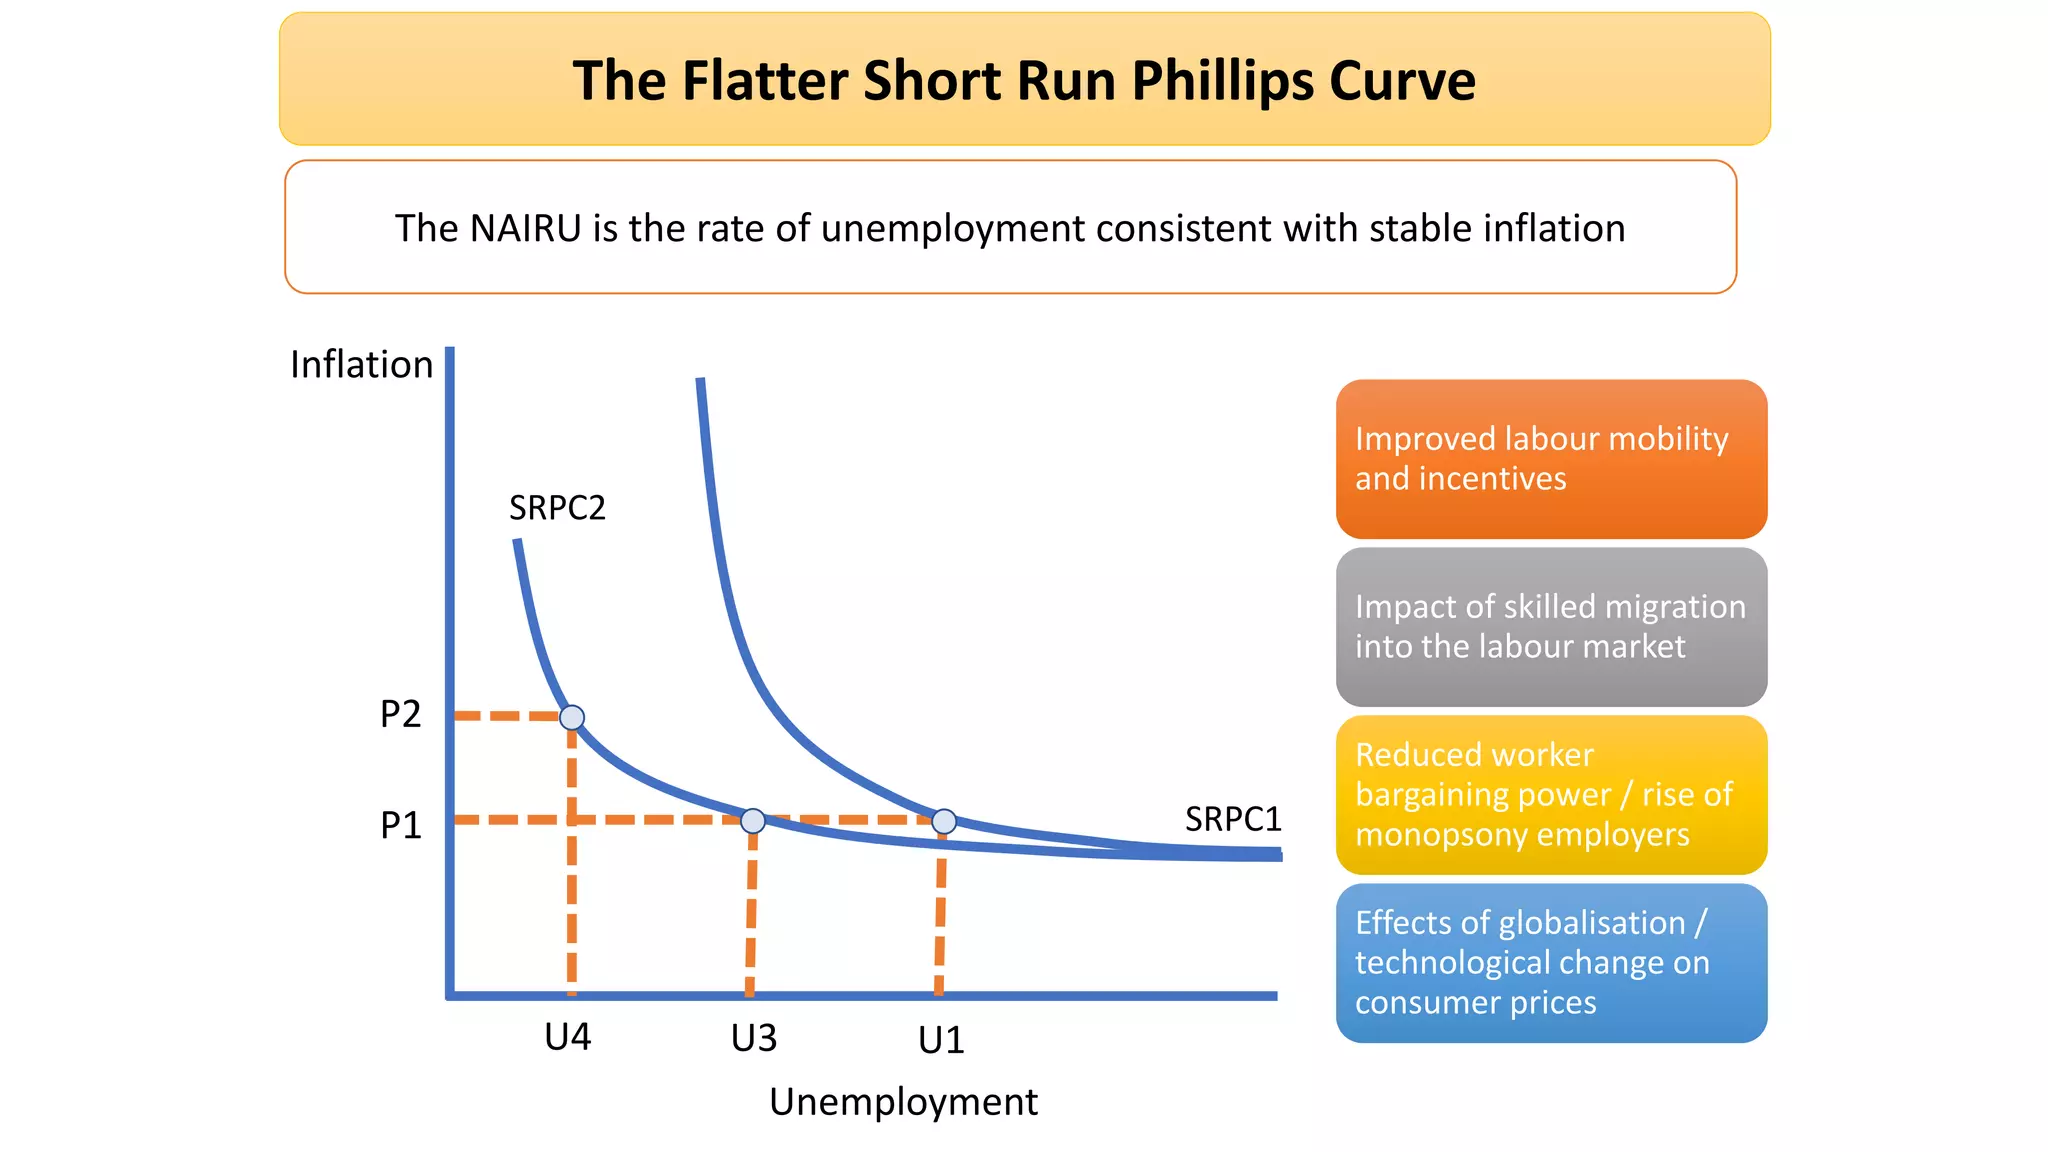
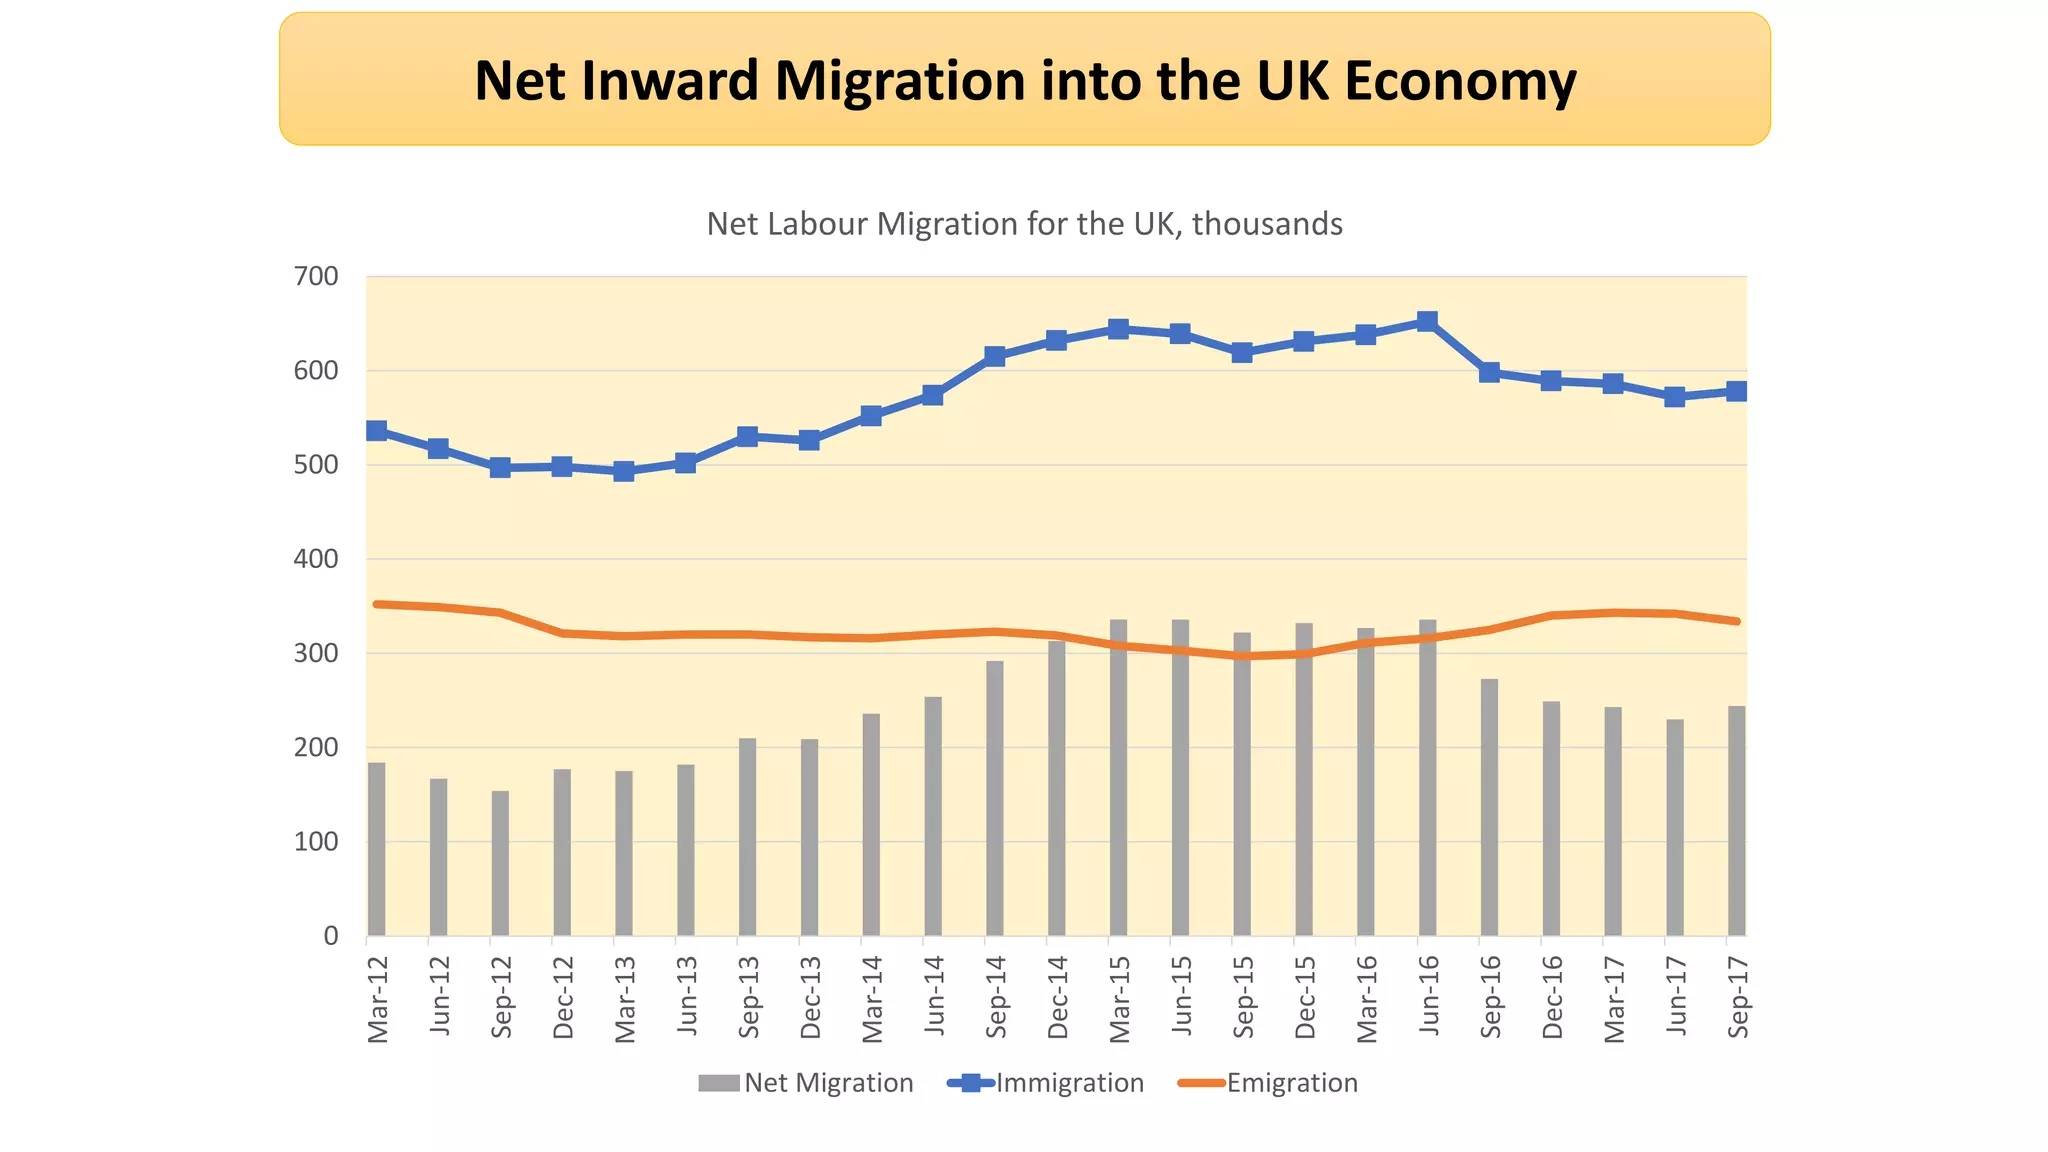
The Short Run Phillips Curve
The Phillips Curve shows a trade-off between inflation and unemployment. A
demand-side policy to reduce unemployment could conflict with price stability
Unemployment
Inflation
P1
A favourable
trade-off because
the economy
SRAS is elastic
when
unemployment is
high
When the unemployment rate is
high then wage pressures in the
labour market are likely to be low
There is plenty of spare capacity in
the labour market such as many
unfilled jobs vacancies
Fears over job security might also
lead to workers being unwilling to
bid for higher wages
U1U2
The Short Run Phillips Curve
The Phillips Curve shows a trade-off between inflation and unemployment. A
demand-side policy to reduce unemployment could conflict with price stability
Inflation
P1
Trade-off is
worsening as the
economy comes
up against
capacity
constraints
Unemployment
U1U2
As the rate of unemployment falls,
labour shortages may cause an
increase in wage inflation and
higher unit labour costs
When an economy is booming, so
does the derived demand for and
prices of components and raw
materials – leading to higher costs
Rising demand and falling
unemployment can lead to
suppliers raising their prices to
increase their profit margins
P3
U3U4
P4
The NAIRU
The NAIRU is the rate of unemployment consistent with stable inflation
Inflation
Unemployment
U1U2
P1
P2
SRPC1
The NAIRU
The NAIRU is the rate of unemployment consistent with stable inflation
Inflation
Unemployment
U1U2
P1
P2
SRPC1
Accelerating
inflation
The Wage Phillips Curve
0.0
1.0
2.0
3.0
4.0
5.0
6.0
7.0
8.0
9.0
2001Q1
2001Q3
2002Q1
2002Q3
2003Q1
2003Q3
2004Q1
2004Q3
2005Q1
2005Q3
2006Q1
2006Q3
2007Q1
2007Q3
2008Q1
2008Q3
2009Q1
2009Q3
2010Q1
2010Q3
2011Q1
2011Q3
2012Q1
2012Q3
2013Q1
2013Q3
2014Q1
2014Q3
2015Q1
2015Q3
2016Q1
2016Q3
2017Q1
2017Q3
Unemployment Rate and Wage Inflation in the UK, percent
Regular pay growth Unemployment rate
The Flatter Short Run Phillips Curve
The NAIRU is the rate of unemployment consistent with stable inflation
Inflation
Unemployment
U1U3
P1
P2
U4
SRPC1
SRPC2
The Flatter Short Run Phillips Curve
The NAIRU is the rate of unemployment consistent with stable inflation
Inflation
Unemployment
U1U3
P1
P2
U4
SRPC1
SRPC2
Improved labour mobility
and incentives
Impact of skilled migration
into the labour market
Reduced worker
bargaining power / rise of
monopsony employers
Effects of globalisation /
technological change on
consumer prices
Net Inward Migration into the UK Economy
0
100
200
300
400
500
600
700
Mar-12
Jun-12
Sep-12
Dec-12
Mar-13
Jun-13
Sep-13
Dec-13
Mar-14
Jun-14
Sep-14
Dec-14
Mar-15
Jun-15
Sep-15
Dec-15
Mar-16
Jun-16
Sep-16
Dec-16
Mar-17
Jun-17
Sep-17
Net Labour Migration for the UK, thousands
Net Migration Immigration Emigration
Economic Inactivity in the UK
19.5
20
20.5
21
21.5
22
22.5
23
23.5
24
24.5
NovtoJan1990
SeptoNov1990
JultoSep1991
MaytoJul1992
MartoMay1993
JantoMar1994
NovtoJan1994
SeptoNov1995
JultoSep1996
MaytoJul1997
MartoMay1998
JantoMar1999
NovtoJan2000
SeptoNov2000
JultoSep2001
MaytoJul2002
MartoMay2003
JantoMar2004
NovtoJan2005
SeptoNov2005
JultoSep2006
MaytoJul2007
MartoMay2008
JantoMar2009
NovtoJan2010
SeptoNov2010
JultoSep2011
MaytoJul2012
MartoMay2013
JantoMar2014
NovtoJan2015
SeptoNov2015
JultoSep2016
MaytoJul2017
UK economic inactivity rate (people aged 16 to 64), seasonally adjusted, per
cent
How much lower can UK unemployment fall?
0
1
2
3
4
5
6
7
8
9
Nov-Jan2006
Apr-Jun2006
Sep-Nov2006
Feb-Apr2007
Jul-Sep2007
Dec-Feb2008
May-Jul2008
Oct-Dec2008
Mar-May2009
Aug-Oct2009
Jan-Mar2010
Jun-Aug2010
Nov-Jan2011
Apr-Jun2011
Sep-Nov2011
Feb-Apr2012
Jul-Sep2012
Dec-Feb2013
May-Jul2013
Oct-Dec2013
Mar-May2014
Aug-Oct2014
Jan-Mar2015
Jun-Aug2015
Nov-Jan2016
Apr-Jun2016
Sep-Nov2016
Feb-Apr2017
Jul-Sep2017
UK Unemployment Rate, per cent of the labour force
Changing Phillips Curve

Changing Phillips Curve

  • 2.
    The Short RunPhillips Curve The Phillips Curve shows a trade-off between inflation and unemployment. A demand-side policy to reduce unemployment could conflict with price stability Unemployment Inflation P1 A favourable trade-off because the economy SRAS is elastic when unemployment is high When the unemployment rate is high then wage pressures in the labour market are likely to be low There is plenty of spare capacity in the labour market such as many unfilled jobs vacancies Fears over job security might also lead to workers being unwilling to bid for higher wages U1U2
  • 3.
    The Short RunPhillips Curve The Phillips Curve shows a trade-off between inflation and unemployment. A demand-side policy to reduce unemployment could conflict with price stability Inflation P1 Trade-off is worsening as the economy comes up against capacity constraints Unemployment U1U2 As the rate of unemployment falls, labour shortages may cause an increase in wage inflation and higher unit labour costs When an economy is booming, so does the derived demand for and prices of components and raw materials – leading to higher costs Rising demand and falling unemployment can lead to suppliers raising their prices to increase their profit margins P3 U3U4 P4
  • 4.
    The NAIRU The NAIRUis the rate of unemployment consistent with stable inflation Inflation Unemployment U1U2 P1 P2 SRPC1
  • 5.
    The NAIRU The NAIRUis the rate of unemployment consistent with stable inflation Inflation Unemployment U1U2 P1 P2 SRPC1 Accelerating inflation
  • 6.
    The Wage PhillipsCurve 0.0 1.0 2.0 3.0 4.0 5.0 6.0 7.0 8.0 9.0 2001Q1 2001Q3 2002Q1 2002Q3 2003Q1 2003Q3 2004Q1 2004Q3 2005Q1 2005Q3 2006Q1 2006Q3 2007Q1 2007Q3 2008Q1 2008Q3 2009Q1 2009Q3 2010Q1 2010Q3 2011Q1 2011Q3 2012Q1 2012Q3 2013Q1 2013Q3 2014Q1 2014Q3 2015Q1 2015Q3 2016Q1 2016Q3 2017Q1 2017Q3 Unemployment Rate and Wage Inflation in the UK, percent Regular pay growth Unemployment rate
  • 7.
    The Flatter ShortRun Phillips Curve The NAIRU is the rate of unemployment consistent with stable inflation Inflation Unemployment U1U3 P1 P2 U4 SRPC1 SRPC2
  • 8.
    The Flatter ShortRun Phillips Curve The NAIRU is the rate of unemployment consistent with stable inflation Inflation Unemployment U1U3 P1 P2 U4 SRPC1 SRPC2 Improved labour mobility and incentives Impact of skilled migration into the labour market Reduced worker bargaining power / rise of monopsony employers Effects of globalisation / technological change on consumer prices
  • 9.
    Net Inward Migrationinto the UK Economy 0 100 200 300 400 500 600 700 Mar-12 Jun-12 Sep-12 Dec-12 Mar-13 Jun-13 Sep-13 Dec-13 Mar-14 Jun-14 Sep-14 Dec-14 Mar-15 Jun-15 Sep-15 Dec-15 Mar-16 Jun-16 Sep-16 Dec-16 Mar-17 Jun-17 Sep-17 Net Labour Migration for the UK, thousands Net Migration Immigration Emigration
  • 10.
    Economic Inactivity inthe UK 19.5 20 20.5 21 21.5 22 22.5 23 23.5 24 24.5 NovtoJan1990 SeptoNov1990 JultoSep1991 MaytoJul1992 MartoMay1993 JantoMar1994 NovtoJan1994 SeptoNov1995 JultoSep1996 MaytoJul1997 MartoMay1998 JantoMar1999 NovtoJan2000 SeptoNov2000 JultoSep2001 MaytoJul2002 MartoMay2003 JantoMar2004 NovtoJan2005 SeptoNov2005 JultoSep2006 MaytoJul2007 MartoMay2008 JantoMar2009 NovtoJan2010 SeptoNov2010 JultoSep2011 MaytoJul2012 MartoMay2013 JantoMar2014 NovtoJan2015 SeptoNov2015 JultoSep2016 MaytoJul2017 UK economic inactivity rate (people aged 16 to 64), seasonally adjusted, per cent
  • 11.
    How much lowercan UK unemployment fall? 0 1 2 3 4 5 6 7 8 9 Nov-Jan2006 Apr-Jun2006 Sep-Nov2006 Feb-Apr2007 Jul-Sep2007 Dec-Feb2008 May-Jul2008 Oct-Dec2008 Mar-May2009 Aug-Oct2009 Jan-Mar2010 Jun-Aug2010 Nov-Jan2011 Apr-Jun2011 Sep-Nov2011 Feb-Apr2012 Jul-Sep2012 Dec-Feb2013 May-Jul2013 Oct-Dec2013 Mar-May2014 Aug-Oct2014 Jan-Mar2015 Jun-Aug2015 Nov-Jan2016 Apr-Jun2016 Sep-Nov2016 Feb-Apr2017 Jul-Sep2017 UK Unemployment Rate, per cent of the labour force

Editor's Notes

  • #3 The Phillips Curve traces the relationship between pay growth on the one hand and the balance of labour market supply and demand, represented by unemployment, on the other. It has been a staple part of macroeconomic theory for many years. Students often encounter the Phillips Curve concept when discussing possible trade-offs between macroeconomic objectives.
  • #4 The original Phillips Curve suggested that, once unemployment falls below the estimated equilibrium (or natural) rate then we can expect to see an acceleration in wage inflation feeding through to higher consumer prices. Low unemployment might bring about higher inflation implying a trade-off between two important macroeconomic objectives. 
  • #7 The recent data for the UK suggests that the standard Phillips Curve model has changed.  The unemployment rate in Britain is currently at 4.3% of the labour force, the lowest it has been for over 40 years. Unemployment has more than halved since the end of the last recession yet the annual growth of wages (measured in nominal terms) has been fairly stable at or around 2%. 
  • #8 Some economists believe that the Phillips Curve has flattened, so that the economy can continue to grow and create new jobs without triggering a burst of above target inflation. Others believe that internal and external factors have caused the Phillips Curve to shift through a change in inflation expectations. Another view is that changes to the structure of the labour market have brought about a fall in the natural rate of unemployment so that a stable rate of inflation at or around the 2% target can be achieved with a lower rate of unemployment.
  • #9 Reasons for a fall in the natural rate of unemployment  This might have been caused by a decline in frictional unemployment as the labour market has become more efficient at matching unemployed workers to infilled vacancies. Digital platforms that provide better information to people on job opportunities could be a factor here. A decade or more of increased spending on vocational training and education reforms might have helped to improve educational attainment leading to a lower rate of structural unemployment.  One aspect worth mentioning is that we may not be measuring accurately the amount of slack in the labour market. Although unemployment rates are at forty-year lows, there has also been a rise in under-employment which includes people who have a part-time job but who would prefer to have full-time employment.