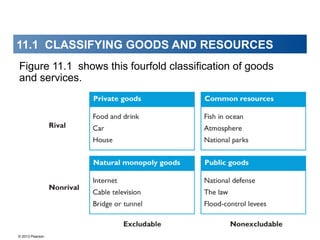
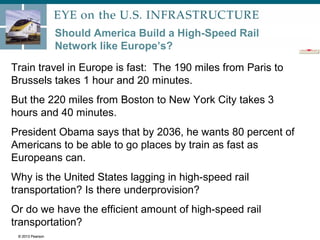
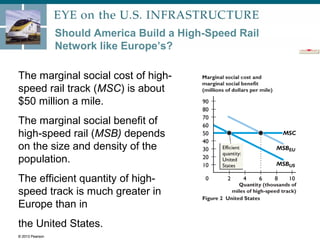
This document discusses the classification of goods and resources as private, public, common, or natural monopolies based on whether they are excludable and rival. It also examines issues that can arise with the provision of public goods and management of common resources, such as the free rider problem, tragedy of the commons, and potential solutions like property rights and quotas. Specific examples discussed include surveillance satellites, fish stocks, and proposals for high-speed rail in the US.


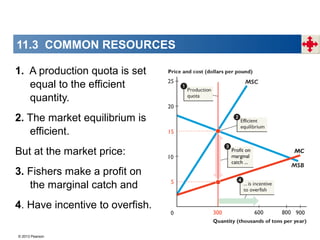
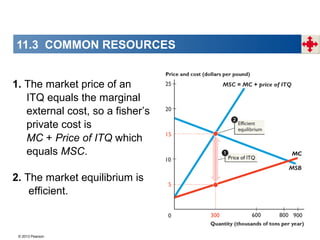


![Public goods & Private Goods [2022].pptx](https://cdn.slidesharecdn.com/ss_thumbnails/publicgoodsprivategoods2022-230122001115-511aa1e9-thumbnail.jpg?width=640&height=640&fit=bounds)