Will rapid urbanisation propel growth in Hitech Plast?
•
1 like•358 views

Hitech Plast can be bought for a target of Rs140 for the mid- to long-term, recommends Firstcall

Recommended
Recommended
More Related Content
What's hot
What's hot (19)
Viewers also liked
Viewers also liked (20)
Similar to Will rapid urbanisation propel growth in Hitech Plast?
Similar to Will rapid urbanisation propel growth in Hitech Plast? (20)
More from IndiaNotes.com
More from IndiaNotes.com (20)
Recently uploaded
Recently uploaded (20)
Will rapid urbanisation propel growth in Hitech Plast?
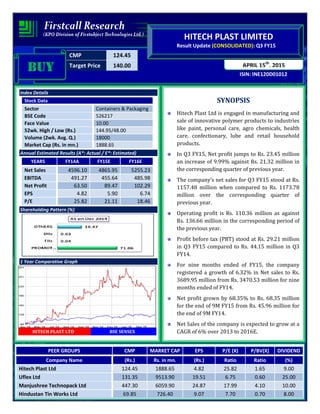
- 1. CMP 124.45 Target Price 140.00 ISIN: INE120D01012 APRIL 15th , 2015 HITECH PLAST LIMITED Result Update (CONSOLIDATED): Q3 FY15 BUYBUYBUYBUY Index Details Stock Data Sector Containers & Packaging BSE Code 526217 Face Value 10.00 52wk. High / Low (Rs.) 144.95/48.00 Volume (2wk. Avg. Q.) 18000 Market Cap (Rs. in mn.) 1888.65 Annual Estimated Results (A*: Actual / E*: Estimated) YEARS FY14A FY15E FY16E Net Sales 4596.10 4865.95 5255.23 EBITDA 491.27 455.64 485.98 Net Profit 63.50 89.47 102.29 EPS 4.82 5.90 6.74 P/E 25.82 21.11 18.46 Shareholding Pattern (%) 1 Year Comparative Graph HITECH PLAST LTD BSE SENSEX SYNOPSIS Hitech Plast Ltd is engaged in manufacturing and sale of innovative polymer products to industries like paint, personal care, agro chemicals, health care, confectionary, lube and retail household products. In Q3 FY15, Net profit jumps to Rs. 23.45 million an increase of 9.99% against Rs. 21.32 million in the corresponding quarter of previous year. The company’s net sales for Q3 FY15 stood at Rs. 1157.48 million when compared to Rs. 1173.78 million over the corresponding quarter of previous year. Operating profit is Rs. 110.36 million as against Rs. 136.66 million in the corresponding period of the previous year. Profit before tax (PBT) stood at Rs. 29.21 million in Q3 FY15 compared to Rs. 44.15 million in Q3 FY14. For nine months ended of FY15, the company registered a growth of 6.32% in Net sales to Rs. 3689.95 million from Rs. 3470.53 million for nine months ended of FY14. Net profit grown by 68.35% to Rs. 68.35 million for the end of 9M FY15 from Rs. 45.96 million for the end of 9M FY14. Net Sales of the company is expected to grow at a CAGR of 6% over 2013 to 2016E. PEER GROUPS CMP MARKET CAP EPS P/E (X) P/BV(X) DIVIDEND Company Name (Rs.) Rs. in mn. (Rs.) Ratio Ratio (%) Hitech Plast Ltd 124.45 1888.65 4.82 25.82 1.65 9.00 Uflex Ltd 131.35 9513.90 19.51 6.75 0.60 25.00 Manjushree Technopack Ltd 447.30 6059.90 24.87 17.99 4.10 10.00 Hindustan Tin Works Ltd 69.85 726.40 9.07 7.70 0.70 8.00
- 2. QUARTERLY HIGHLIGHTS (CONSOLIDATED) Results updates- Q3 FY15, Hitech Plast Ltd. is a leading rigid plastic packaging manufacturer a business to business company, engaged in manufacturing and sale of innovative polymer products to industries like paint, personal care, agro chemicals, health care, confectionary, lube and retail household products, has reported its financial results for the quarter ended 31st Dec, 2014. The company has achieved a turnover of Rs. 1157.48 million for the 3rd quarter of the financial year 2014-15 as against Rs. 1180.25 million in the corresponding quarter of the previous year. EBITDA of Rs. 110.36 million in Q3 FY15, a decrease of 19.24% against the corresponding period of last year. In Q3 FY15, net profit of Rs. 23.45 million against Rs. 21.32 million in the corresponding quarter of the previous year. The company has reported an EPS of Rs. 1.55 for the 3rd quarter as against an EPS of Rs. 1.62 in the corresponding quarter of the previous year. Break up of Expenditure Rs. In million Dec-14 Dec-13 % Change Net Sales 1157.48 1180.25 (1.93) PAT 23.45 21.32 9.99 EPS 1.55 1.62 (4.50) EBITDA 110.36 136.66 (19.24) Break up of Expenditure (Rs in millions) Q3 FY15 Q3 FY14 Chng % Cost of Materials Consumed 777.34 786.11 -1% Employee Benefits Expense 66.76 64.64 3% Depreciation and Amortization Expense 37.55 46.67 -20% Other expenses 205.24 195.44 5%
- 3. COMPANY PROFILE Hitech Plast Ltd. is a leading rigid plastic packaging manufacturer – a business to business company. Hitech Plast Ltd. is engaged in manufacturing and sale of innovative polymer products to industries like paint, personal care, agro chemicals, health care, confectionary, lube and retail household products. The company job is to make high quality packaging as efficiently, profitably and sustainably as possible. All the while ensuring the safety and well being of their people and the satisfaction of their customers, include many of the world's favourite and most famous brands. Hitech Plast Ltd. offers customers the highest quality in innovative and sustainable packaging solutions, and strives to create partnerships built on service, reliability and excellence. The company’s geographical footprint puts them at their customer’s doorstep. With 13 plants across the country, Hitech is the largest manufacturer of paint pails/ containers. Hitech Plast Ltd. capabilities enable them to offer customized solutions to their customers by using extrusion, injection and stretch blow molding processes in various segments like paints, FMCG, healthcare, lubes and pharmaceutical. Associated Companies Coatings Specialities (I) Ltd is one of the leading speciality chemicals trading company in India, managing exclusive rights of distribution for a number of reputed multinational companies like Elementis Specialties, Thor Specialities, Rockwood Pigments, PQ Corporation, Samsung Fine Chemicals and Lorama for the last two decades. Products of these companies are widely used in India; they help to strengthen and ameliorate the quality of the end products. The company caters to paints, coatings, printing inks, construction, personal care, home care, pharmaceuticals, lubricants and other allied industries.
- 4. FINANCIAL HIGHLIGHT (CONSOLIDATED) (A*- Actual, E* -Estimations & Rs. In Millions) Balance Sheet as at March 31, 2013 -2016E FY13A FY14A FY15E FY16E I. EQUITY AND LIABILITIES: A. Shareholders’ Funds a) Share Capital 131.76 131.76 151.76 151.76 b) Money Received Against Share Warrants 0.00 0.00 28.50 33.63 c) Reserves and Surplus 814.33 863.97 953.44 1029.72 Sub-Total-Net worth 946.09 995.73 1133.70 1215.11 Minority Interest 291.86 309.25 323.48 336.41 B. Non-Current Liabilities: a) Long-term borrowings 406.73 291.95 227.72 186.28 b) Deferred Tax Liabilities [Net] 56.87 52.77 50.13 48.13 c) Long Term Provisions 7.97 4.94 18.67 21.47 Sub-Total-Long term liabilities 471.57 349.66 296.53 255.88 C. Current Liabilities: a) Short-term borrowings 478.99 482.71 521.33 557.82 b) Trade Payables 165.33 203.65 261.49 313.78 c) Other Current Liabilities 248.57 301.45 355.71 412.62 d) Short Term Provisions 35.94 27.46 21.03 23.14 Sub-Total-Current Liabilities 928.83 1015.27 1159.56 1307.37 TOTAL-EQUITY AND LIABILITIES (A+B+C) 2638.35 2669.91 2913.26 3114.77 II. ASSETS: D. Non-Current Assets: Fixed Assets i. Tangible Assets 1439.83 1321.36 1334.57 1355.93 ii. Intangible Assets 2.86 3.16 3.38 3.58 iii. Capital Work in Progress 8.57 13.92 18.42 21.18 a) Sub-Total-Fixed Assets 1451.26 1338.44 1356.37 1380.69 b) Goodwill on Consolidation 29.40 29.40 29.40 29.40 c) Long Term Loans and Advances 53.51 57.16 60.02 62.42 d) Other non-current assets 0.00 0.50 0.60 0.65 Sub-Total-Non-Current Assets 1534.17 1425.50 1446.39 1473.16 E. Current Assets: a) Inventories 270.37 337.29 404.75 455.34 b) Trade Receivables 614.53 729.85 861.22 968.87 c) Cash and Bank Balances 63.71 31.80 34.03 35.39 d) Short Term Loans and Advances 137.15 131.53 148.63 161.21 e) Other Current Assets 18.42 13.94 18.25 20.80 Sub-Total-Current Assets 1104.18 1244.41 1466.87 1641.61 TOTAL-ASSETS (D+E) 2638.35 2669.91 2913.26 3114.77
- 5. Annual Profit & Loss Statement for the period of 2013 to 2016E Value(Rs.in.mn) FY13A FY14A FY15E FY16E Description 12m 12m 12m 12m Net Sales 4394.81 4596.10 4865.95 5255.23 Other Income 20.28 4.73 5.81 7.23 Total Income 4415.09 4600.83 4871.76 5262.46 Expenditure -3932.77 -4109.56 -4416.12 -4776.47 Operating Profit 482.32 491.27 455.64 485.98 Interest -183.04 -172.19 -169.32 -174.40 Gross profit 299.28 319.08 286.31 311.58 Depreciation -172.90 -184.30 -153.84 -161.53 Profit Before Tax 126.38 134.78 132.48 150.05 Tax -22.57 -53.89 -41.62 -46.06 Profit After Tax 103.81 80.89 90.85 103.98 Minority Interest -13.44 -17.39 -1.38 -1.70 Net Profit 90.37 63.50 89.47 102.29 Equity capital 131.76 131.76 151.76 151.76 Reserves 814.33 863.97 953.44 1029.72 Face value 10.00 10.00 10.00 10.00 EPS 6.86 4.82 5.90 6.74 Quarterly Profit & Loss Statement for the period of 30th June, 2014 to 31st March, 2015E Value(Rs.in.mn) 30-Jun-14 30-Sep-14 31-Dec-14 31-Mar-15E Description 3m 3m 3m 3m Net sales 1163.22 1369.25 1157.48 1176.00 Other income 0.89 1.31 2.10 1.51 Total Income 1164.11 1370.56 1159.58 1177.51 Expenditure -1048.96 -1248.02 -1049.22 -1069.92 Operating profit 115.15 122.54 110.36 107.59 Interest -41.42 -45.50 -43.60 -38.80 Gross profit 73.73 77.04 66.76 68.78 Depreciation -38.33 -38.38 -37.55 -39.58 Profit Before Tax 35.40 38.66 29.21 29.21 Tax -11.61 -13.75 -7.12 -9.14 Profit After Tax 23.79 24.91 22.09 20.06 Minority Interest -3.61 -0.19 1.36 1.06 Net Profit 20.18 24.72 23.45 21.12 Equity capital 131.76 151.76 151.76 151.76 Face value 10.00 10.00 10.00 10.00 EPS 1.53 1.63 1.55 1.39
- 6. Ratio Analysis Particulars FY13A FY14A FY15E FY16E EPS (Rs.) 6.86 4.82 5.90 6.74 EBITDA Margin (%) 10.97% 10.69% 9.36% 9.25% PBT Margin (%) 2.88% 2.93% 2.72% 2.86% PAT Margin (%) 2.36% 1.76% 1.87% 1.98% P/E Ratio (x) 18.14 25.82 21.11 18.46 ROE (%) 10.97% 8.12% 8.22% 8.80% ROCE (%) 35.77% 38.16% 32.87% 33.63% Debt Equity Ratio 0.94 0.78 0.68 0.63 EV/EBITDA (x) 5.10 4.85 5.71 5.34 Book Value (Rs.) 71.80 75.57 72.83 77.85 P/BV 1.73 1.65 1.71 1.60 Charts
- 7. OUTLOOK AND CONCLUSION At the current market price of Rs. 124.45, the stock P/E ratio is at 21.11 x FY15E and 18.46 x FY16E respectively. Earning per share (EPS) of the company for the earnings for FY15E and FY16E is seen at Rs.5.90 and Rs.6.74 respectively. Net Sales of the company is expected to grow at a CAGR of 6% over 2013 to 2016E. On the basis of EV/EBITDA, the stock trades at 5.71 x for FY15E and 5.34 x for FY16E. Price to Book Value of the stock is expected to be at 1.71 x and 1.60 x respectively for FY15E and FY16E. We recommend ‘BUY’ in this particular scrip with a target price of Rs.140.00 for Medium to Long term investment. INDUSTRY OVERVIEW Paint Industry The Company’s products mainly cater to the packaging requirement of decorative segment which constitutes to 75% of paint industry in India. Historically, paint industry has grown at 1.5 to 2 times of GDP growth. The slowdown in GDP growth and discretionary consumer spending and high inflation has resulted in sluggish in demand for paints in the year 2013-14. While in the near term the paint industry is not expected to revert to double digit growth rate trajectory witnessed in the last one decade, the structural drivers of long term growth remain firmly in place. The Paint industry is expected to bounce back over medium to long term, driven by increasing affluence, rapid urbanisation and a young population having propensity to spend on one hand, and relatively low level of penetration on the other.
- 8. FMCG and Agrochemicals The Indian FMCG sector is the fourth largest sector in the economy with a total market size in excess of US$ 13.1 billion. It has a strong MNC presence and is characterised by a well-established distribution network. The FMCG market is set to treble from US$ 11.6 billion in 2003 to US$ 33.4 billion in 2015 (Source CII). Penetration level as well as per capita consumption in most product categories in India is low indicating the untapped market potential. Growth is also likely to come from consumer ‘upgrading’ to branded products burgeoning Indian population, particularly the middle class and the rural segments, presents an opportunity for high growth in branded packaged products. This will require high quality and innovative packaging. Though the overall consumption spending was subdued in the year 2013-14, the secular growth trend in FMCG segment remains intact driven by favourable demographics, rising rural wages and low level of penetration particularly in branded segment. The Global Agrochemical industry has grown by about 9% and is currently valued at USD 54 Billion of which India accounts for USD 1.8 Billion. With the introduction of newer molecules and increasing awareness among farmer community, the industry is expected to witness higher growth rates. The present consumption level in India is lowest in the World at 0.6 kg per hectare as against 13 kg per hectare in China and 7 kg per hectare in USA. This presents an immense opportunity for the industry to grow. The demand is expected to be robust at around 15% per annum considering the increasing awareness about their benefits and the government thrust for increase in farm production to meet the food needs of the increasing population. Disclaimer: This document is prepared by our research analysts and it does not constitute an offer or solicitation for the purchase or sale of any financial instrument or as an official confirmation of any transaction. The information contained herein is from publicly available data or other sources believed to be reliable but we do not represent that it is accurate or complete and it should not be relied on as such. Firstcall Research or any of its affiliates shall not be in any way responsible for any loss or damage that may arise to any person from any inadvertent error in the information contained in this report. Firstcall Research and/ or its affiliates and/or employees will not be liable for the recipients’ investment decision based on this document.
- 9. Firstcall India Equity Research: Email – info@firstobjectindia.com C.V.S.L.Kameswari Pharma & Diversified U. Janaki Rao Capital Goods B. Anil Kumar Auto, IT & FMCG M. Vinayak Rao Diversified G. Amarender Diversified Firstcall Research Provides Industry Research on all the Sectors and Equity Research on Major Companies forming part of Listed and Unlisted Segments For Further Details Contact: Tel.: 022-2527 2510/2527 6077 / 25276089 Telefax: 022-25276089 040-20000235 /20000233 E-mail: info@firstobjectindia.com www.firstcallresearch.com