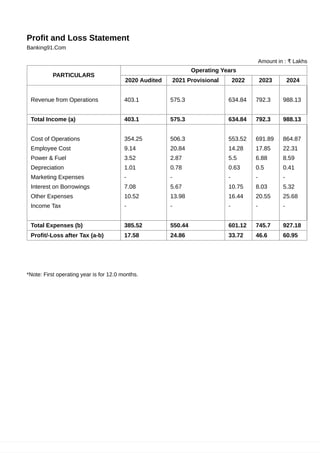
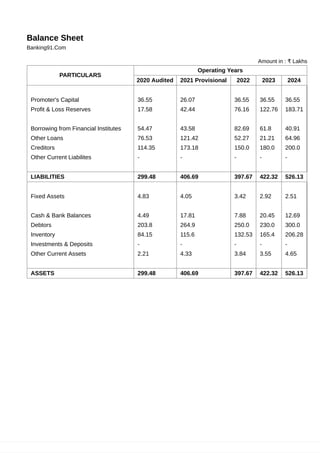
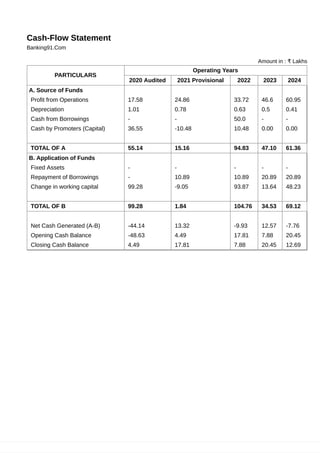
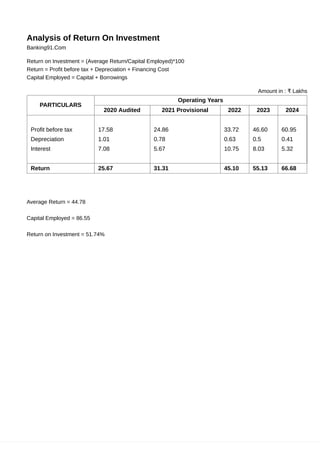
Banking91.Com
77, Murlipura


Jaipur


Rajasthan - 302001


Credit Monitoring Arrangement (CMA) Report


This Credit Monitoring Arrangement (CMA) Report has been designed to show future vaibility of oprations.
It is a
Proprietorship concern promoted by Banking91.
Now it is proposed to avail financial assistance from a financial institute.
Hence this Credit Monitoring Arrangement
(CMA) Report is presented.
Banking91.Com
77, Murlipura


Jaipur


Rajasthan - 302001


INDEX OF CONTENT
1. Profit and Loss Statement


2. Balance Sheet


3. Cash-Flow Statement


4. Depreciation Statement


5. Borrowing and Interest Statement


6. Break Even Analysis


7. Debt Service Coverage Ratio


8. Analysis of Return On Investment
Amount in : ₹ Lakhs
Profit and Loss Statement
Banking91.Com
PARTICULARS
Operating Years
2020 Audited 2021 Provisional 2022 2023 2024
 
Revenue from Operations 403.1 575.3 634.84 792.3 988.13
 
Total Income (a) 403.1 575.3 634.84 792.3 988.13
 
Cost of Operations 354.25 506.3 553.52 691.89 864.87
Employee Cost 9.14 20.84 14.28 17.85 22.31
Power & Fuel 3.52 2.87 5.5 6.88 8.59
Depreciation 1.01 0.78 0.63 0.5 0.41
Marketing Expenses - - - - -
Interest on Borrowings 7.08 5.67 10.75 8.03 5.32
Other Expenses 10.52 13.98 16.44 20.55 25.68
Income Tax - - - - -
 
Total Expenses (b) 385.52 550.44 601.12 745.7 927.18
Profit/-Loss after Tax (a-b) 17.58 24.86 33.72 46.6 60.95


*Note: First operating year is for 12.0 months.
Amount in : ₹ Lakhs
Balance Sheet
Banking91.Com
PARTICULARS
Operating Years
2020 Audited 2021 Provisional 2022 2023 2024
 
Promoter's Capital 36.55 26.07 36.55 36.55 36.55
Profit & Loss Reserves 17.58 42.44 76.16 122.76 183.71
 
Borrowing from Financial Institutes 54.47 43.58 82.69 61.8 40.91
Other Loans 76.53 121.42 52.27 21.21 64.96
Creditors 114.35 173.18 150.0 180.0 200.0
Other Current Liabilites - - - - -
 
LIABILITIES 299.48 406.69 397.67 422.32 526.13
 
Fixed Assets 4.83 4.05 3.42 2.92 2.51
 
Cash & Bank Balances 4.49 17.81 7.88 20.45 12.69
Debtors 203.8 264.9 250.0 230.0 300.0
Inventory 84.15 115.6 132.53 165.4 206.28
Investments & Deposits - - - - -
Other Current Assets 2.21 4.33 3.84 3.55 4.65
 
ASSETS 299.48 406.69 397.67 422.32 526.13
Amount in : ₹ Lakhs
Cash-Flow Statement
Banking91.Com
PARTICULARS
Operating Years
2020 Audited 2021 Provisional 2022 2023 2024
A. Source of Funds
Profit from Operations 17.58 24.86 33.72 46.6 60.95
Depreciation 1.01 0.78 0.63 0.5 0.41
Cash from Borrowings - - 50.0 - -
Cash by Promoters (Capital) 36.55 -10.48 10.48 0.00 0.00
 
TOTAL OF A 55.14 15.16 94.83 47.10 61.36
B. Application of Funds
Fixed Assets - - - - -
Repayment of Borrowings - 10.89 10.89 20.89 20.89
Change in working capital 99.28 -9.05 93.87 13.64 48.23
 
TOTAL OF B 99.28 1.84 104.76 34.53 69.12
 
Net Cash Generated (A-B) -44.14 13.32 -9.93 12.57 -7.76
Opening Cash Balance -48.63 4.49 17.81 7.88 20.45
Closing Cash Balance 4.49 17.81 7.88 20.45 12.69
Amount in : ₹ Lakhs
Assets and Depreciation Statement
Banking91.Com
PARTICULARS
Operating Years
2020 Audited 2021 Provisional 2022 2023 2024
Plant & Machinery
Opening WDV 4.5 3.82 3.25 2.76 2.35
Cost of Asset - - 0.0 - -
Depreciation Rate 15.0% 15.0% 15.0% 15.0% 15.0%
Depreciation 0.68 0.57 0.49 0.41 0.35
Closing WDV 3.82 3.25 2.76 2.35 2.0
Computers
Opening WDV 0.76 0.46 0.28 0.17 0.1
Cost of Asset - - 0.0 - -
Depreciation Rate 40.0% 40.0% 40.0% 40.0% 40.0%
Depreciation 0.3 0.18 0.11 0.07 0.04
Closing WDV 0.46 0.28 0.17 0.1 0.06
Furniture and fittings
Opening WDV 0.33 0.3 0.27 0.24 0.22
Cost of Asset - - 0.0 - -
Depreciation Rate 10.0% 10.0% 10.0% 10.0% 10.0%
Depreciation 0.03 0.03 0.03 0.02 0.02
Closing WDV 0.3 0.27 0.24 0.22 0.2
Others
Opening WDV 0.25 0.25 0.25 0.25 0.25
Cost of Asset - - 0.0 - -
Depreciation Rate 0.0% 0.0% 0.0% 0.0% 0.0%
Depreciation 0.0 0.0 0.0 0.0 0.0
Closing WDV 0.25 0.25 0.25 0.25 0.25
Total Depreciation 1.01 0.78 0.63 0.5 0.41
Closing Balance 4.83 4.05 3.42 2.92 2.51
Amount in : ₹ Lakhs
Borrowings Statement
Banking91.Com
PARTICULARS
Operating Years
2020 Audited 2021 Provisional 2022 2023 2024
 
Opening Balance (A) 54.47 54.47 43.58 82.69 61.8
Borrowing (B) - - 50.0 - -
Repayment of Borrowings (C) - 10.89 10.89 20.89 20.89
Interest Payment 7.08 5.67 10.75 8.03 5.32
 
Closing Balance (A+B-C) 54.47 43.58 82.69 61.8 40.91
Amount in : ₹ Lakhs
Break Even Analysis
Banking91.Com
PARTICULARS
Operating Years
2020
Audited
2021
Provisional
2022 2023 2024
 
Revenue from Operations 403.1 575.3 634.84 792.3 988.13
 
A. Operating Revenue 403.1 575.3 634.84 792.3 988.13
 
Operating Expenses
Cost of Operations 354.25 506.3 553.52 691.89 864.87
Employee Cost 9.14 20.84 14.28 17.85 22.31
Power & Fuel 3.52 2.87 5.5 6.88 8.59
Marketing Expenses - - - - -
Other Expenses 10.52 13.98 16.44 20.55 25.68
 
B. Operating Expenses 377.43 543.99 589.74 737.17 921.45
Fixed Expenses
Depreciation 1.01 0.78 0.63 0.5 0.41
Finance Cost 7.08 5.67 10.75 8.03 5.32
 
C. Fixed Expenses 8.09 6.45 11.38 8.53 5.73
 
D. Contribution (A-B) 25.67 31.31 45.10 55.13 66.68
E. PV Ratio (D/A*100) 0.06 0.05 0.07 0.07 0.07
F. Break Even Value (C/E) 134.83 129.00 162.57 121.86 81.86
G. Cash Break Even Value (Without
Depreciation)
118.00 113.40 153.57 114.71 76.00
 
Amount in : ₹ Lakhs
Debt Service Coverage Ratio
Banking91.Com
PARTICULARS
Operating Years
2020 Audited 2021 Provisional 2022 2023 2024
 
Operating Cash Source
Profit after Tax 17.58 24.86 33.72 46.6 60.95
Depreciation 1.01 0.78 0.63 0.5 0.41
Finance Cost 7.08 5.67 10.75 8.03 5.32
 
A. Total 25.67 31.31 45.10 55.13 66.68
 
DEBT
Loan Repayment - 10.89 10.89 20.89 20.89
Finance Cost 7.08 5.67 10.75 8.03 5.32
 
B. TOTAL 7.08 16.56 21.64 28.92 26.21
 
Debt Service Coverage Ratio (A/B) 3.63 1.89 2.08 1.91 2.54
 
Amount in : ₹ Lakhs
Analysis of Return On Investment
Banking91.Com
Return on Investment = (Average Return/Capital Employed)*100


Return = Profit before tax + Depreciation + Financing Cost
Capital Employed = Capital + Borrowings
PARTICULARS
Operating Years
2020 Audited 2021 Provisional 2022 2023 2024
 
Profit before tax 17.58 24.86 33.72 46.60 60.95
Depreciation 1.01 0.78 0.63 0.5 0.41
Interest 7.08 5.67 10.75 8.03 5.32
 
Return 25.67 31.31 45.10 55.13 66.68


Average Return = 44.78


Capital Employed = 86.55


Return on Investment = 51.74%

Cma report sample by banking91.com

  • 1.
    Banking91.Com 77, Murlipura Jaipur Rajasthan -302001 Credit Monitoring Arrangement (CMA) Report This Credit Monitoring Arrangement (CMA) Report has been designed to show future vaibility of oprations. It is a Proprietorship concern promoted by Banking91. Now it is proposed to avail financial assistance from a financial institute. Hence this Credit Monitoring Arrangement (CMA) Report is presented.
  • 2.
    Banking91.Com 77, Murlipura Jaipur Rajasthan -302001 INDEX OF CONTENT 1. Profit and Loss Statement 2. Balance Sheet 3. Cash-Flow Statement 4. Depreciation Statement 5. Borrowing and Interest Statement 6. Break Even Analysis 7. Debt Service Coverage Ratio 8. Analysis of Return On Investment
  • 3.
    Amount in :₹ Lakhs Profit and Loss Statement Banking91.Com PARTICULARS Operating Years 2020 Audited 2021 Provisional 2022 2023 2024   Revenue from Operations 403.1 575.3 634.84 792.3 988.13   Total Income (a) 403.1 575.3 634.84 792.3 988.13   Cost of Operations 354.25 506.3 553.52 691.89 864.87 Employee Cost 9.14 20.84 14.28 17.85 22.31 Power & Fuel 3.52 2.87 5.5 6.88 8.59 Depreciation 1.01 0.78 0.63 0.5 0.41 Marketing Expenses - - - - - Interest on Borrowings 7.08 5.67 10.75 8.03 5.32 Other Expenses 10.52 13.98 16.44 20.55 25.68 Income Tax - - - - -   Total Expenses (b) 385.52 550.44 601.12 745.7 927.18 Profit/-Loss after Tax (a-b) 17.58 24.86 33.72 46.6 60.95 *Note: First operating year is for 12.0 months.
  • 4.
    Amount in :₹ Lakhs Balance Sheet Banking91.Com PARTICULARS Operating Years 2020 Audited 2021 Provisional 2022 2023 2024   Promoter's Capital 36.55 26.07 36.55 36.55 36.55 Profit & Loss Reserves 17.58 42.44 76.16 122.76 183.71   Borrowing from Financial Institutes 54.47 43.58 82.69 61.8 40.91 Other Loans 76.53 121.42 52.27 21.21 64.96 Creditors 114.35 173.18 150.0 180.0 200.0 Other Current Liabilites - - - - -   LIABILITIES 299.48 406.69 397.67 422.32 526.13   Fixed Assets 4.83 4.05 3.42 2.92 2.51   Cash & Bank Balances 4.49 17.81 7.88 20.45 12.69 Debtors 203.8 264.9 250.0 230.0 300.0 Inventory 84.15 115.6 132.53 165.4 206.28 Investments & Deposits - - - - - Other Current Assets 2.21 4.33 3.84 3.55 4.65   ASSETS 299.48 406.69 397.67 422.32 526.13
  • 5.
    Amount in :₹ Lakhs Cash-Flow Statement Banking91.Com PARTICULARS Operating Years 2020 Audited 2021 Provisional 2022 2023 2024 A. Source of Funds Profit from Operations 17.58 24.86 33.72 46.6 60.95 Depreciation 1.01 0.78 0.63 0.5 0.41 Cash from Borrowings - - 50.0 - - Cash by Promoters (Capital) 36.55 -10.48 10.48 0.00 0.00   TOTAL OF A 55.14 15.16 94.83 47.10 61.36 B. Application of Funds Fixed Assets - - - - - Repayment of Borrowings - 10.89 10.89 20.89 20.89 Change in working capital 99.28 -9.05 93.87 13.64 48.23   TOTAL OF B 99.28 1.84 104.76 34.53 69.12   Net Cash Generated (A-B) -44.14 13.32 -9.93 12.57 -7.76 Opening Cash Balance -48.63 4.49 17.81 7.88 20.45 Closing Cash Balance 4.49 17.81 7.88 20.45 12.69
  • 6.
    Amount in :₹ Lakhs Assets and Depreciation Statement Banking91.Com PARTICULARS Operating Years 2020 Audited 2021 Provisional 2022 2023 2024 Plant & Machinery Opening WDV 4.5 3.82 3.25 2.76 2.35 Cost of Asset - - 0.0 - - Depreciation Rate 15.0% 15.0% 15.0% 15.0% 15.0% Depreciation 0.68 0.57 0.49 0.41 0.35 Closing WDV 3.82 3.25 2.76 2.35 2.0 Computers Opening WDV 0.76 0.46 0.28 0.17 0.1 Cost of Asset - - 0.0 - - Depreciation Rate 40.0% 40.0% 40.0% 40.0% 40.0% Depreciation 0.3 0.18 0.11 0.07 0.04 Closing WDV 0.46 0.28 0.17 0.1 0.06 Furniture and fittings Opening WDV 0.33 0.3 0.27 0.24 0.22 Cost of Asset - - 0.0 - - Depreciation Rate 10.0% 10.0% 10.0% 10.0% 10.0% Depreciation 0.03 0.03 0.03 0.02 0.02 Closing WDV 0.3 0.27 0.24 0.22 0.2 Others Opening WDV 0.25 0.25 0.25 0.25 0.25 Cost of Asset - - 0.0 - - Depreciation Rate 0.0% 0.0% 0.0% 0.0% 0.0% Depreciation 0.0 0.0 0.0 0.0 0.0 Closing WDV 0.25 0.25 0.25 0.25 0.25 Total Depreciation 1.01 0.78 0.63 0.5 0.41 Closing Balance 4.83 4.05 3.42 2.92 2.51
  • 7.
    Amount in :₹ Lakhs Borrowings Statement Banking91.Com PARTICULARS Operating Years 2020 Audited 2021 Provisional 2022 2023 2024   Opening Balance (A) 54.47 54.47 43.58 82.69 61.8 Borrowing (B) - - 50.0 - - Repayment of Borrowings (C) - 10.89 10.89 20.89 20.89 Interest Payment 7.08 5.67 10.75 8.03 5.32   Closing Balance (A+B-C) 54.47 43.58 82.69 61.8 40.91
  • 8.
    Amount in :₹ Lakhs Break Even Analysis Banking91.Com PARTICULARS Operating Years 2020 Audited 2021 Provisional 2022 2023 2024   Revenue from Operations 403.1 575.3 634.84 792.3 988.13   A. Operating Revenue 403.1 575.3 634.84 792.3 988.13   Operating Expenses Cost of Operations 354.25 506.3 553.52 691.89 864.87 Employee Cost 9.14 20.84 14.28 17.85 22.31 Power & Fuel 3.52 2.87 5.5 6.88 8.59 Marketing Expenses - - - - - Other Expenses 10.52 13.98 16.44 20.55 25.68   B. Operating Expenses 377.43 543.99 589.74 737.17 921.45 Fixed Expenses Depreciation 1.01 0.78 0.63 0.5 0.41 Finance Cost 7.08 5.67 10.75 8.03 5.32   C. Fixed Expenses 8.09 6.45 11.38 8.53 5.73   D. Contribution (A-B) 25.67 31.31 45.10 55.13 66.68 E. PV Ratio (D/A*100) 0.06 0.05 0.07 0.07 0.07 F. Break Even Value (C/E) 134.83 129.00 162.57 121.86 81.86 G. Cash Break Even Value (Without Depreciation) 118.00 113.40 153.57 114.71 76.00  
  • 9.
    Amount in :₹ Lakhs Debt Service Coverage Ratio Banking91.Com PARTICULARS Operating Years 2020 Audited 2021 Provisional 2022 2023 2024   Operating Cash Source Profit after Tax 17.58 24.86 33.72 46.6 60.95 Depreciation 1.01 0.78 0.63 0.5 0.41 Finance Cost 7.08 5.67 10.75 8.03 5.32   A. Total 25.67 31.31 45.10 55.13 66.68   DEBT Loan Repayment - 10.89 10.89 20.89 20.89 Finance Cost 7.08 5.67 10.75 8.03 5.32   B. TOTAL 7.08 16.56 21.64 28.92 26.21   Debt Service Coverage Ratio (A/B) 3.63 1.89 2.08 1.91 2.54  
  • 10.
    Amount in :₹ Lakhs Analysis of Return On Investment Banking91.Com Return on Investment = (Average Return/Capital Employed)*100 Return = Profit before tax + Depreciation + Financing Cost Capital Employed = Capital + Borrowings PARTICULARS Operating Years 2020 Audited 2021 Provisional 2022 2023 2024   Profit before tax 17.58 24.86 33.72 46.60 60.95 Depreciation 1.01 0.78 0.63 0.5 0.41 Interest 7.08 5.67 10.75 8.03 5.32   Return 25.67 31.31 45.10 55.13 66.68 Average Return = 44.78 Capital Employed = 86.55 Return on Investment = 51.74%