Q4FY15 result update: Sangam's net profit up 43.75% y/y; Buy
•
1 like•191 views

Sangam's Q4FY15 Net Profit up by 43.75% and stood at Rs. 144.90 million as against Rs. 100.80 million; Firstcall recommends for a target of Rs.90

Recommended
Recommended
More Related Content
What's hot
What's hot (8)
Similar to Q4FY15 result update: Sangam's net profit up 43.75% y/y; Buy
Similar to Q4FY15 result update: Sangam's net profit up 43.75% y/y; Buy (20)
More from IndiaNotes.com
More from IndiaNotes.com (20)
Recently uploaded
Recently uploaded (20)
Q4FY15 result update: Sangam's net profit up 43.75% y/y; Buy
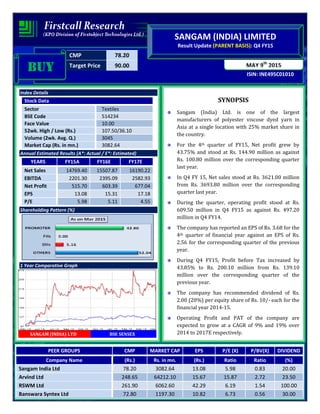
- 1. CMP 78.20 Target Price 90.00 ISIN: INE495C01010 MAY 9th 2015 SANGAM (INDIA) LIMITED Result Update (PARENT BASIS): Q4 FY15 BUYBUYBUYBUY Index Details Stock Data Sector Textiles BSE Code 514234 Face Value 10.00 52wk. High / Low (Rs.) 107.50/36.10 Volume (2wk. Avg. Q.) 3045 Market Cap (Rs. in mn.) 3082.64 Annual Estimated Results (A*: Actual / E*: Estimated) YEARS FY15A FY16E FY17E Net Sales 14769.40 15507.87 16190.22 EBITDA 2201.30 2395.09 2582.93 Net Profit 515.70 603.39 677.04 EPS 13.08 15.31 17.18 P/E 5.98 5.11 4.55 Shareholding Pattern (%) 1 Year Comparative Graph SANGAM (INDIA) LTD BSE SENSEX SYNOPSIS Sangam (India) Ltd. is one of the largest manufacturers of polyester viscose dyed yarn in Asia at a single location with 25% market share in the country. For the 4th quarter of FY15, Net profit grew by 43.75% and stood at Rs. 144.90 million as against Rs. 100.80 million over the corresponding quarter last year. In Q4 FY 15, Net sales stood at Rs. 3621.00 million from Rs. 3693.80 million over the corresponding quarter last year. During the quarter, operating profit stood at Rs. 609.50 million in Q4 FY15 as against Rs. 497.20 million in Q4 FY14. The company has reported an EPS of Rs. 3.68 for the 4th quarter of financial year against an EPS of Rs. 2.56 for the corresponding quarter of the previous year. During Q4 FY15, Profit before Tax increased by 43.85% to Rs. 200.10 million from Rs. 139.10 million over the corresponding quarter of the previous year. The company has recommended dividend of Rs. 2.00 (20%) per equity share of Rs. 10/- each for the financial year 2014-15. Operating Profit and PAT of the company are expected to grow at a CAGR of 9% and 19% over 2014 to 2017E respectively. PEER GROUPS CMP MARKET CAP EPS P/E (X) P/BV(X) DIVIDEND Company Name (Rs.) Rs. in mn. (Rs.) Ratio Ratio (%) Sangam India Ltd 78.20 3082.64 13.08 5.98 0.83 20.00 Arvind Ltd 248.65 64212.10 15.67 15.87 2.72 23.50 RSWM Ltd 261.90 6062.60 42.29 6.19 1.54 100.00 Banswara Syntex Ltd 72.80 1197.30 10.82 6.73 0.56 30.00
- 2. QUARTERLY HIGHLIGHTS (PARENT BASIS) Results updates- Q4 FY15, Months MAR-15 MAR-14 % Change Net Sales 3621.00 3693.80 (1.97) PAT 144.90 100.80 43.75 EPS 3.68 2.56 43.75 EBITDA 609.50 497.20 22.59 The company’s Net sales stood at Rs. 3621.00 million for the 4th quarter of the financial year 2014-15 as against Rs. 3693.80 million in the corresponding quarter of the previous year. The company has reported an EBITDA of Rs. 609.50 million in Q4 FY15. During the quarter, net profit stood at Rs. 144.90 million against Rs. 100.80 million in the corresponding quarter of the previous year. The company has reported an EPS of Rs. 3.68 for the 4th quarter of financial year against an EPS of Rs. 2.56 for the corresponding quarter of the previous year. Break up of Expenditure Break up of Expenditure (Values in Million) Q4 FY15 Q4 FY14 % CHNG Cost of Materials Consumed 2007.20 2165.40 -7% Depreciation & Amortization 228.70 179.50 27% Employees Benefit Expenses 312.40 259.60 20% Other Expenditure 370.00 345.70 7% Power & Fuel 370.50 362.10 2% Toll Contract fee 0.00 35.20 -100%
- 3. COMPANY PROFILE Sangam (India) Ltd is flagship Company of the SANGAM GROUP and one of the largest player in the dyed poly viscose (PV) yarn market in India started operations in 1985 and promoted under the name and style of Arun Synthetics Pvt. Ltd. At Bhilwara in Rajasthan, the company operates its facilities to produce synthetic and blended dyed/grey spun yarn, cotton yarn and fabrics (synthetics blended denim and knitted fabrics). It also has facilities for fabric processing. At present, Sangam India has 162720 spindles of polyester- viscose dyed yarn and 31,200 spindles for cotton yarn installed in Bhilwara along with 257 weaving machines and a 31 MW thermal power plant. The company also has strong presence in the Indian synthetic blended fabric segment with brands like Sangam and Anmol. The company has an established client base like Reliance, Reid & Taylor, Siyaram and Grasim. Its fabric is marketed through a network of 200 plus dealers and thousands of retailers. Business Area Sangam is a preferred PV dyed yarn supplier to top textile companies across the world, Sangam (India) has emerged as a preferred supplier of fabrics on account of its colours, blends, textures and finishes. It has a colour bank of more than 5,000 shades and produces 6-50 counts of yarns. It offers single ply, double ply, grindle, roving grindle, core spun, slub and other fancy yarns, making it a one-stop shop for fabric manufacturers. The company has also partnered various brands to introduce new varieties of man-made fi bres, adding considerable value to its products. Products portfolio • Yarns: PV and Cotton • Woven fabrics • Branded suiting • Denim fabric • Texturised yarn • Wind power Capacities: Division & Production Capacity • Spinning (Ring Spinning) 201216 Spindles / 55000 MT p.a. • Spinning (Open End) 4096 Rotors / 18000 MT p.a. • Synthetic Fabric 18 Million Meter p.a. • Denim Fabric 32 Million Meter p.a.
- 4. • Fabric Processing 53 Million Meter p.a. • Knitted Fabric 18 Machines / 3000 MT p.a. • Texturised Yarn 7200 MT p.a. • Thermal & Wind Power 36 MW Plants Locations • Biliya Kalan, Bhilwara, Rajasthan. • Sareri, Bhilwara, Rajasthan. • Atun, Bhilwara, Rajasthan.
- 5. FINANCIAL HIGHLIGHT (PARENT BASIS) (A*- Actual, E* -Estimations & Rs. In Millions) Balance Sheet as at March31, 2014A-2017E FY14A FY15A FY16E FY17E I. EQUITY AND LIABILITIES: A. Shareholders’ Funds: a) Share Capital 394.20 394.20 394.20 394.20 b) Reserves and Surplus 2920.10 3322.80 3768.06 4276.74 Sub-Total-Net worth 3314.30 3717.00 4162.26 4670.94 B. Non-Current Liabilities: a) Long-term borrowings 2758.60 2577.80 2423.13 2292.28 b) Deferred Tax Liabilities [Net] 449.60 403.50 367.19 336.34 Sub-Total-Long term liabilities 3208.20 2981.30 2790.32 2628.62 C. Current Liabilities: a) Short-term borrowings 2217.80 2769.30 3129.31 3348.36 b) Trade Payables 707.00 750.50 803.04 846.40 c) Other Current Liabilities 1429.70 1428.30 1471.15 1500.57 d) Short Term Provisions 94.30 119.70 136.46 150.10 Sub-Total-Current Liabilities 4448.80 5067.80 5539.95 5845.43 TOTAL -EQUITY AND LIABILITIES (A+B+C) 10971.30 11766.10 12492.52 13145.00 II. ASSETS: D. Non-Current Assets: a) Fixed Assets 5513.80 5656.90 5770.04 5943.14 b) Non Current Investments 78.50 58.50 52.65 49.49 c) Long Term Loans and Advances 170.10 145.10 130.59 120.14 Sub-Total-Non-Current Assets 5762.40 5860.50 5953.28 6112.77 E. Current Assets: a) Inventories 2337.30 2650.90 2915.99 3149.27 b) Trade Receivables 2008.50 2517.10 2940.15 3226.45 c) Cash and Bank Balances 32.80 39.10 43.79 47.30 d) Short Term Loans and Advances 626.80 577.20 548.34 531.89 e) Other Current Assets 203.50 121.30 90.97 77.32 Sub-Total-Current Assets 5208.90 5905.60 6539.24 7032.23 TOTAL -ASSETS (D+E) 10971.30 11766.10 12492.52 13145.00
- 6. Annual Profit & Loss Statement for the period of 2014 to 2017E Value(Rs.in.mn) FY14A FY15A FY16E FY17E Description 12m 12m 12m 12m Net Sales 14396.20 14769.40 15507.87 16190.22 Other Income 60.90 27.40 30.14 32.97 Total Income 14457.10 14796.80 15538.01 16223.19 Expenditure -12438.80 -12595.50 -13142.92 -13640.26 Operating Profit 2018.30 2201.30 2395.09 2582.93 Interest -660.60 -672.20 -699.09 -741.03 Gross profit 1357.70 1529.10 1696.00 1841.90 Depreciation -743.20 -804.00 -860.28 -911.90 Exceptional Items -3.00 -3.50 0.00 0.00 Profit Before Tax 611.50 721.60 835.72 930.00 Tax -206.50 -205.90 -232.33 -252.96 Net Profit 405.00 515.70 603.39 677.04 Equity capital 394.20 394.20 394.20 394.20 Reserves 2920.10 3322.80 3768.06 4276.74 Face value 10.00 10.00 10.00 10.00 EPS 10.27 13.08 15.31 17.18 Quarterly Profit & Loss Statement for the period of 30 Sep, 2014 to 30 Jun, 2015E Value(Rs.in.mn) 30-Sep-14 31-Dec-14 31-Mar-15 30-Jun-15E Description 3m 3m 3m 3m Net sales 3707.90 3690.20 3621.00 3780.32 Other income 4.90 -7.10 13.40 15.54 Total Income 3712.80 3683.10 3634.40 3795.87 Expenditure -3171.10 -3158.10 -3024.90 -3164.13 Operating profit 541.70 525.00 609.50 631.74 Interest -162.90 -164.50 -177.20 -171.18 Gross profit 378.80 360.50 432.30 460.56 Depreciation -191.50 -194.40 -228.70 -237.85 Exceptional Items 0.00 0.00 -3.50 0.00 Profit Before Tax 187.30 166.10 200.10 222.71 Tax -67.60 -28.40 -55.20 -63.03 Net Profit 119.70 137.70 144.90 159.69 Equity capital 394.20 394.20 394.20 394.20 Face value 10.00 10.00 10.00 10.00 EPS 3.04 3.49 3.68 4.05
- 7. Ratio Analysis Particulars FY14A FY15A FY16E FY17E EPS (Rs.) 10.27 13.08 15.31 17.18 EBITDA Margin (%) 14.02 14.90 15.44 15.95 PBT Margin (%) 4.25 4.89 5.39 5.74 PAT Margin (%) 2.81 3.49 3.89 4.18 P/E Ratio (x) 7.61 5.98 5.11 4.55 ROE (%) 12.22 13.87 14.50 14.49 ROCE (%) 33.31 33.16 33.51 33.89 Debt Equity Ratio 1.50 1.44 1.33 1.21 EV/EBITDA (x) 3.98 3.81 3.59 3.36 Book Value (Rs.) 84.08 94.29 105.59 118.49 P/BV 0.93 0.83 0.74 0.66 Charts
- 8. OUTLOOK AND CONCLUSION At the current market price of Rs. 78.20, the stock P/E ratio is at 5.11 x FY16E and 4.55 x FY17E respectively. Earning per share (EPS) of the company for the earnings for FY16E and FY17E is seen at Rs.15.31 and Rs.17.18 respectively. Operating Profit and PAT of the company are expected to grow at a CAGR of 9% and 19% over 2014 to 2017E respectively. On the basis of EV/EBITDA, the stock trades at 3.59 x for FY16E and 3.36 x for FY17E. Price to Book Value of the stock is expected to be at 0.74 x and 0.66 x for FY16E and FY17E respectively. We recommend ‘BUY’ in this particular scrip with a target price of Rs.90.00 for Medium term investment. INDUSTRY OVERVIEW India’s textiles sector is one of the mainstays of the national economy. It is also one of the largest contributing sectors of India’s exports contributing 11 per cent to the country’s total exports basket. The textiles industry is labour intensive and is one of the largest employers. The industry realised export earnings worth US$ 41.57 billion in 2013-14. The textile industry has two broad segments, namely handloom, handicrafts, sericulture, power looms in the unorganised sector and spinning, apparel, garmenting, made ups in the organised sector. The Indian textiles industry is extremely varied, with a hand-spun and handwoven sector at one end of the spectrum, and the capital intensive sophisticated mill sector at the other. The decentralised power looms/ hosiery and knitting sector form the largest and knitting sector form the largest section of the Textiles Sector.
- 9. The close linkage of the Industry to agriculture and the ancient culture, the traditions of the country make the Indian textiles sector unique in comparison to the textiles industry of other countries. This also provides the industry with the capacity to produce a variety of products suitable to the different market segments, both within and outside the country. The Indian textiles industry, currently estimated at around US $108 billion, is expected to reach US $ 141 billion by 2021. The industry is the second largest employer after agriculture, providing direct employment to over 45 million and 60 million people indirectly. The Indian Textile Industry contributes approximately 5 per cent to GDP, and 14 per cent to overall Index of Industrial Production (IIP). The Indian textile industry has the potential to grow five-fold over the next ten years to touch US$ 500 billion mark on the back of growing demand for polyester fabric, according to a study by Wazir Advisors and PCI Xylenes and Polyester. The US$ 500 billion market figure consists of domestic sales of US$ 315 billion and exports of US$ 185 billion. The current industry size comprises domestic market of US$ 68 billion and exports of US$ 40 billion, according to Mr Prashat Agarwal, Managing Director, Wazir Advisors. Outllok The future for the Indian textile industry looks promising, buoyed by both strong domestic consumption as well as export demand. With consumerism and disposable income on the rise, the retail sector has experienced a rapid growth in the past decade with the entry of several international players like Marks & Spencer, Guess and Next into the Indian market. The organised apparel segment is expected to grow at a compound annual growth rate (CAGR) of more than 13 per cent over a 10-year period. Disclaimer: This document is prepared by our research analysts and it does not constitute an offer or solicitation for the purchase or sale of any financial instrument or as an official confirmation of any transaction. The information contained herein is from publicly available data or other sources believed to be reliable but we do not represent that it is accurate or complete and it should not be relied on as such. Firstcall Research or any of its affiliates shall not be in any way responsible for any loss or damage that may arise to any person from any inadvertent error in the information contained in this report. Firstcall Research and/ or its affiliates and/or employees will not be liable for the recipients’ investment decision based on this document.
- 10. Firstcall India Equity Research: Email – info@firstobjectindia.com C.V.S.L.Kameswari Pharma & Diversified U. Janaki Rao Capital Goods B. Anil Kumar Auto, IT & FMCG M. Vinayak Rao Diversified G. Amarender Diversified Firstcall Research Provides Industry Research on all the Sectors and Equity Research on Major Companies forming part of Listed and Unlisted Segments For Further Details Contact: Tel.: 022-2527 2510/2527 6077 / 25276089 Telefax: 022-25276089 040-20000235 /20000233 E-mail: info@firstobjectindia.com www.firstcallresearch.com