Call Girls In Yusuf Sarai Women Seeking Men 9654467111
Firstcall simmonds marshall_ltd_1_july15
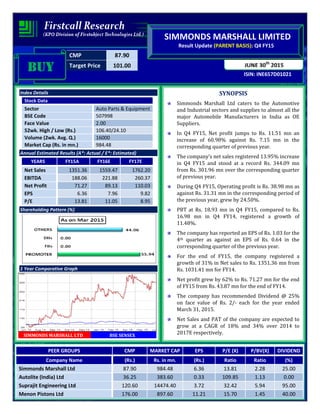
1. CMP 87.90
Target Price 101.00
ISIN: INE657D01021
JUNE 30th
2015
SIMMONDS MARSHALL LIMITED
Result Update (PARENT BASIS): Q4 FY15
BUYBUYBUYBUY
Index Details
Stock Data
Sector Auto Parts & Equipment
BSE Code 507998
Face Value 2.00
52wk. High / Low (Rs.) 106.40/24.10
Volume (2wk. Avg. Q.) 16000
Market Cap (Rs. in mn.) 984.48
Annual Estimated Results (A*: Actual / E*: Estimated)
YEARS FY15A FY16E FY17E
Net Sales 1351.36 1559.47 1762.20
EBITDA 188.06 221.88 260.37
Net Profit 71.27 89.13 110.03
EPS 6.36 7.96 9.82
P/E 13.81 11.05 8.95
Shareholding Pattern (%)
1 Year Comparative Graph
SIMMONDS MARSHALL LTD BSE SENSEX
SYNOPSIS
Simmonds Marshall Ltd caters to the Automotive
and Industrial sectors and supplies to almost all the
major Automobile Manufacturers in India as OE
Suppliers.
In Q4 FY15, Net profit jumps to Rs. 11.51 mn an
increase of 60.98% against Rs. 7.15 mn in the
corresponding quarter of previous year.
The company’s net sales registered 13.95% increase
in Q4 FY15 and stood at a record Rs. 344.09 mn
from Rs. 301.96 mn over the corresponding quarter
of previous year.
During Q4 FY15, Operating profit is Rs. 38.98 mn as
against Rs. 31.31 mn in the corresponding period of
the previous year, grew by 24.50%.
PBT at Rs. 18.93 mn in Q4 FY15, compared to Rs.
16.98 mn in Q4 FY14, registered a growth of
11.48%.
The company has reported an EPS of Rs. 1.03 for the
4th quarter as against an EPS of Rs. 0.64 in the
corresponding quarter of the previous year.
For the end of FY15, the company registered a
growth of 31% in Net sales to Rs. 1351.36 mn from
Rs. 1031.41 mn for FY14.
Net profit grew by 62% to Rs. 71.27 mn for the end
of FY15 from Rs. 43.87 mn for the end of FY14.
The company has recommended Dividend @ 25%
on face value of Rs. 2/- each for the year ended
March 31, 2015.
Net Sales and PAT of the company are expected to
grow at a CAGR of 18% and 34% over 2014 to
2017E respectively.
PEER GROUPS CMP MARKET CAP EPS P/E (X) P/BV(X) DIVIDEND
Company Name (Rs.) Rs. in mn. (Rs.) Ratio Ratio (%)
Simmonds Marshall Ltd 87.90 984.48 6.36 13.81 2.28 25.00
Autolite (India) Ltd 36.25 383.60 0.33 109.85 1.13 0.00
Suprajit Engineering Ltd 120.60 14474.40 3.72 32.42 5.94 95.00
Menon Pistons Ltd 176.00 897.60 11.21 15.70 1.45 40.00
2. QUARTERLY HIGHLIGHTS (PARENT BASIS)
Results updates- Q4 FY15,
Simmonds Marshall Limited was incorporated in
1960 caters to the Automotive and Industrial sectors
and supplies to almost all the major Automobile
Manufacturers in India has reported its financial
results for the quarter ended 31st March, 2015.
The company has achieved a turnover of Rs. 344.09 million for the 4th quarter of the current year 2014-15 as
against Rs. 301.96 million in the corresponding quarter of the previous year. EBITDA of Rs. 38.98 million in Q4
FY15, an increase of 24.50% against the corresponding period of last year. In Q4 FY15, net profit of Rs. 11.51
million against Rs. 7.15 million in the corresponding quarter of the previous year. The company has reported an
EPS of Rs. 1.03 for the 4th quarter as against an EPS of Rs. 0.64 in the corresponding quarter of the previous year.
Break up of Expenditure
Rs. In million Mar-15 Mar-14 % Change
Net Sales 344.09 301.96 13.95
PAT 11.51 7.15 60.98
EPS 1.03 0.64 60.98
EBITDA 38.98 31.31 24.50
Break up of Expenditure
(Rs in millions)
Q4 FY15 Q4 FY14
%
CHNG
Consumption of raw
materials
113.90 116.33 -2%
Employees cost 63.52 42.84 48%
Depreciation 9.57 6.66 44%
Other expenditure 140.81 92.49 52%
Purchase of stock-in-trade 1.93 3.10 -38%
3. COMPANY PROFILE
Simmonds Marshall Limited was incorporated in 1960 as a Private Limited Company in technical and financial
collaboration with Firth Cleveland Fastenings Ltd., U.K. holding 51% of the equity of the company. This
shareholding was diluted progressively and the balance of foreign holding was purchased fully by the promoters
in 1987. In 1986, the company went public and is now a quoted company on the Stock Exchange. The company
manufactures a range of Specialised Nylon Insert Self Locking Nuts and other Special Fasteners.
The company has been augmenting its cold forming capacity and can produce over 500 million nuts per annum
in a wide range from M4 to M48 diameter and equivalent imperial sizes. These nuts are manufactured either to
American, British, Japanese, ISO or Indian Standards in a variety of thread forms and protective finishes.
The company also has a battery of multi-spindle automatic bar turning centres capable of producing related
automotive components as well. The company is fully equipped to supply a wide range of Bolts from their
associated companies ranging from M5 to M70.
Simmonds Marshall Limited caters to the Automotive and Industrial sectors and supplies to almost all the major
Automobile Manufacturers in India as OE Suppliers. Furthermore, General Motors, Fiat, Honda, Caterpillar,
Suzuki, Leyland, Dana, New Holland are some of the world's finest companies that source their requirements
from the company.
Products
• Cleveloc & All Metal Self Locking Nuts
• Nylon Insert Self Locking Nuts
• U-Nuts
• Wheel Nuts
• Flange Nuts
• Cage Nuts
• Weld Nuts
• Bolts & Studs
• Dome Cap Nuts
• Castle & Slotted Nuts
• Hose Pipe Fitting Nuts
• Cold Forged Sleeves / Bushes Collars / Spacers
4. FINANCIAL HIGHLIGHT (PARENT BASIS) (A*- Actual, E* -Estimations & Rs. In Millions)
Balance Sheet as at March 31, 2014 -2017E
FY14A FY15A FY16E FY17E
I. EQUITY AND LIABILITIES:
A. Shareholders’ Funds
a) Share Capital 22.40 22.40 22.40 22.40
b) Reserves and Surplus 346.55 409.03 480.20 558.95
Sub-Total-Net worth 368.95 431.43 502.60 581.35
B. Non-Current Liabilities:
a) Long-term borrowings 142.57 159.56 175.52 189.56
b) Deferred Tax Liabilities [Net] 24.88 24.80 25.54 25.80
c) Long Term Provisions 0.00 2.80 3.36 3.86
Sub-Total-Long term liabilities 167.45 187.16 204.42 219.22
C. Current Liabilities:
a) Short-term borrowings 146.20 158.68 171.37 183.37
b) Trade Payables 95.14 150.96 209.83 268.59
c) Other Current Liabilities 37.48 80.75 113.05 143.57
d) Short Term Provisions 13.77 22.29 31.21 39.32
Sub-Total-Current Liabilities 292.59 412.68 525.46 634.85
TOTAL-EQUITY AND LIABILITIES (A+B+C) 828.99 1031.27 1232.49 1435.43
II. ASSETS:
D. Non-Current Assets:
Fixed Assets
i. Tangible Assets 193.00 219.69 246.05 270.66
ii. Intangible Assets 20.72 35.70 42.84 48.84
iii. Capital work-in-progress 17.95 0.00 0.00 0.00
a) Sub-Total-Fixed Assets 231.67 255.39 288.89 319.50
b) Non Current Investments 33.08 34.54 35.58 37.36
c) Long Term Loans and Advances 9.28 11.81 13.58 15.08
d) Other Long-term assets 2.94 1.29 1.02 0.87
Sub-Total-Non-Current Assets 276.97 303.03 339.07 372.79
E. Current Assets:
a) Inventories 222.28 316.18 407.87 501.68
b) Trade Receivables 261.51 329.31 388.80 447.51
c) Cash and Bank Balances 51.60 56.32 59.70 64.48
d) Short Term Loans and Advances 16.27 25.91 36.27 47.88
e) Other Current Assets 0.36 0.52 0.77 1.08
Sub-Total-Current Assets 552.02 728.24 893.42 1062.63
TOTAL-ASSETS (D+E) 828.99 1031.27 1232.49 1435.43
5. Annual Profit & Loss Statement for the period of 2014 to 2017E
Value(Rs.in.mn) FY14A FY15A FY16E FY17E
Description 12m 12m 12m 12m
Net Sales 1031.41 1351.36 1559.47 1762.20
Other Income 6.16 3.94 4.33 4.85
Total Income 1037.57 1355.30 1563.80 1767.05
Expenditure -914.31 -1167.24 -1341.92 -1506.68
Operating Profit 123.26 188.06 221.88 260.37
Interest -33.11 -39.69 -44.06 -48.46
Gross profit 90.15 148.37 177.82 211.91
Depreciation -20.65 -37.48 -42.58 -47.69
Profit Before Tax 69.50 110.89 135.25 164.23
Tax -25.63 -39.62 -46.12 -54.19
Net Profit 43.87 71.27 89.13 110.03
Equity capital 22.40 22.40 22.40 22.40
Reserves 346.55 409.03 480.20 558.95
Face value 2.00 2.00 2.00 2.00
EPS 3.92 6.36 7.96 9.82
Quarterly Profit & Loss Statement for the period of 30 Sep, 2014 to 30 Jun, 2015E
Value(Rs.in.mn) 30-Sep-14 31-Dec-14 31-Mar-15 30-Jun-15E
Description 3m 3m 3m 3m
Net sales 336.29 342.69 344.09 359.23
Other income 1.10 0.97 0.51 0.59
Total Income 337.39 343.66 344.60 359.82
Expenditure -280.25 -292.78 -305.62 -310.02
Operating profit 57.14 50.88 38.98 49.80
Interest -10.69 -10.47 -10.48 -10.75
Gross profit 46.45 40.41 28.50 39.05
Depreciation -9.21 -10.54 -9.57 -11.58
Profit Before Tax 37.24 29.87 18.93 27.47
Tax -6.48 -10.10 -7.42 -12.69
Net Profit 30.76 19.77 11.51 14.78
Equity capital 22.40 22.40 22.40 22.40
Face value 2.00 2.00 2.00 2.00
EPS 2.75 1.77 1.03 1.32
7. OUTLOOK AND CONCLUSION
At the current market price of Rs. 87.90, the stock P/E ratio is at 11.05 x FY16E and 8.95 x FY17E
respectively.
Earning per share (EPS) of the company for the earnings for FY16E and FY17E is seen at Rs.7.96 and Rs.9.82
respectively.
Net Sales and PAT of the company are expected to grow at a CAGR of 18% and 34% over 2014 to 2017E
respectively.
On the basis of EV/EBITDA, the stock trades at 5.73 x for FY16E and 4.97 x for FY17E.
Price to Book Value of the stock is expected to be at 1.96 x and 1.69 x for FY16E and FY17E respectively.
We expect that the company surplus scenario is likely to continue for the next three years, will keep its
growth story in the coming quarters also. We recommend ‘BUY’ in this particular scrip with a target price of
Rs.101.00 for Medium to Long term investment.
INDUSTRY OVERVIEW
The Indian auto components industry has experienced healthy sequential growth over the last one-and-a-half
years. The growth can be attributed to factors such as strong buoyancy in the end-user industry, recovery of the
global economy, improved consumer sentiment and return of adequate liquidity in the financial system. The
revival of the auto industry was initially driven by the fiscal stimulus programme of the government.
The industry currently accounts for almost seven per cent of India’s gross domestic product (GDP) and employs
about 19 million people, both directly and indirectly. The ever-increasing development in infrastructure, big
8. domestic market, increasing purchasing power and stable government framework have made India a favourable
destination for investment, as per the vision of Automotive Mission Plan (AMP) 2006–2016.
The Indian auto-components industry can be broadly classified into the organised and unorganised sectors. The
organised sector caters to the original equipment manufacturers (OEMs) and consists of high-value precision
instruments while the unorganised sector comprises low-valued products and caters mostly to the aftermarket
category.
The Indian auto component industry is expected to register a turnover of US$ 66 billion by FY 15–16 with the
likelihood to touch US$ 115 billion by FY 20–21 depending on favourable conditions, as per the estimates by
Automotive Component Manufacturers Association of India (ACMA). In addition, industry exports are projected
to reach US$ 12 billion by FY 15–16 and add up to US$ 30 billion by FY 20–21.
Revenues for the auto industry in 2014-15 are expected to grow by 11-12 per cent supported by healthy
recovery by major original equipment manufacturers (OEMs) in the medium and heavy commercial vehicles
(M&HCV) and passenger vehicle (PV) segment.
Outlook
The rapidly globalising world is opening new avenues for the transportation industry, generating the need for
more efficient, safe and reliable modes of transportation, which is subsequently adding to the auto component
industry’s growing opportunities. According to a report by the Confederation of Indian Industry (CII), the Indian
auto component industry is set to become the third largest in the world by 2025. Also, by that time, newer
verticals and opportunities for component manufacturers will open up as the automobile market will shift
towards electric, electronic and hybrid cars, and newer technologies will have to be adopted via systematic
research and development.
Indian auto component makers are well positioned to benefit from the globalisation of the sector as exports
potential could be increased by up to four times to US$ 40 billion by 2020.
Disclaimer:
This document is prepared by our research analysts and it does not constitute an offer or solicitation for the
purchase or sale of any financial instrument or as an official confirmation of any transaction. The information
contained herein is from publicly available data or other sources believed to be reliable but we do not represent that
it is accurate or complete and it should not be relied on as such. Firstcall Research or any of its affiliates shall not be
in any way responsible for any loss or damage that may arise to any person from any inadvertent error in the
information contained in this report. Firstcall Research and/ or its affiliates and/or employees will not be liable for
the recipients’ investment decision based on this document.
9. Firstcall India Equity Research: Email – info@firstobjectindia.com
C.V.S.L.Kameswari Pharma & Diversified
U. Janaki Rao Capital Goods
B. Anil Kumar Auto, IT & FMCG
M. Vinayak Rao Diversified
G. Amarender Diversified
Firstcall Research Provides
Industry Research on all the Sectors and Equity Research on Major Companies
forming part of Listed and Unlisted Segments
For Further Details Contact:
Tel.: 022-2527 2510/2527 6077 / 25276089 Telefax: 022-25276089
040-20000235 /20000233
E-mail: info@firstobjectindia.com
www.firstcallresearch.com