Downloaded 922 times
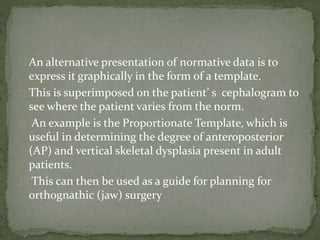
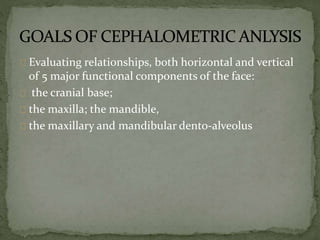
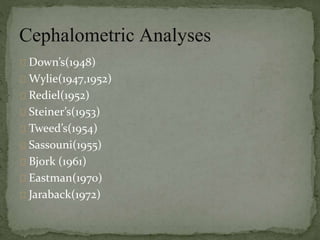
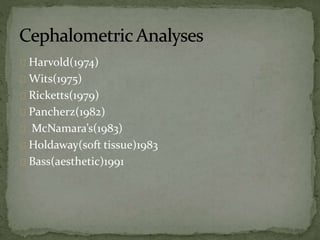


This document discusses cephalometric analysis, which evaluates the skeletal and dental relationships in lateral head x-rays. There are two main approaches: metric uses selected linear and angular measurements, while graphic overlays an individual's tracing onto a reference template. Analyses like Downs (1948) measure angles and distances between cranial landmarks. Downs analyzed 10 variables from untreated patients to establish norms. His analysis uses the Frankfort horizontal plane as a reference to determine jaw positions and assesses angles between skeletal structures and the dental occlusal plane.


