The document summarizes the phase one presentation of the CBTP project conducted by the Babo Kabele team. It includes:
- An introduction to the CBTP program and its significance for students to gain practical skills.
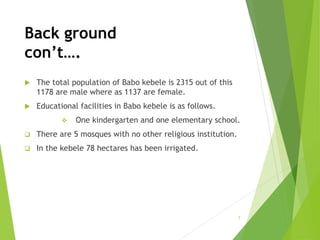
- Background information on the study location of Babo Kabele including population, infrastructure, and boundaries.
- Objectives, materials, methods, and variables of the socio-demographic survey conducted in Babo Kabele.
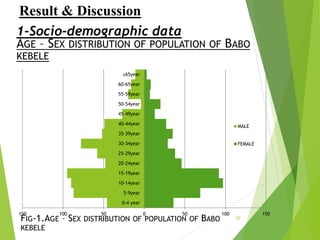
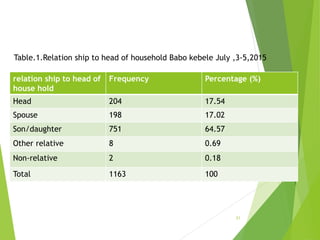
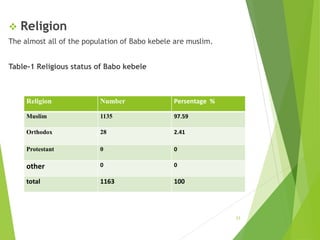
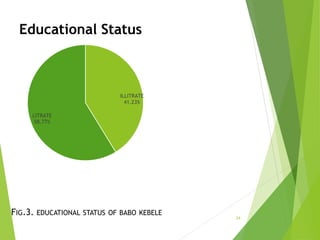
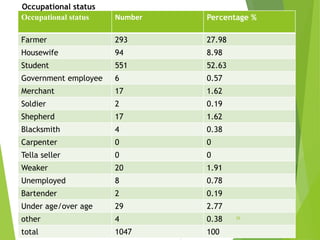
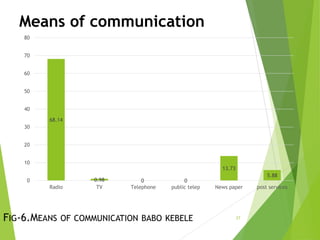
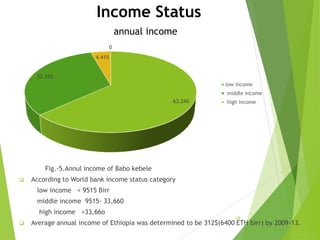
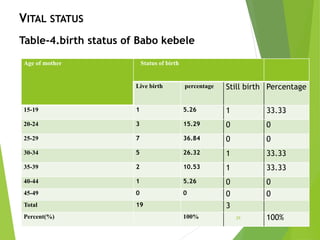
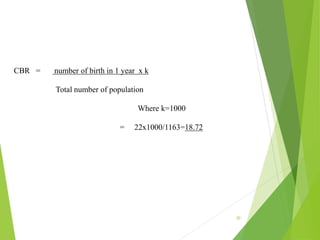
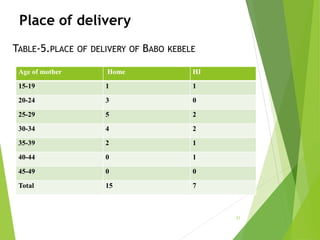
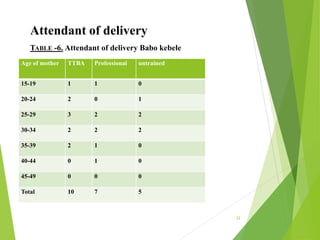
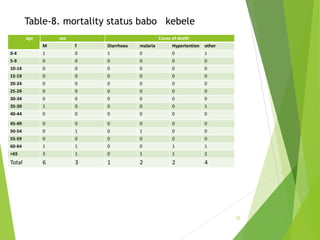
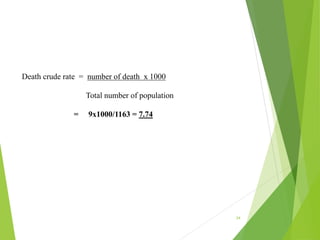
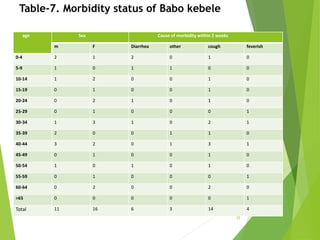
- Key findings of the survey including population characteristics, vital statistics, means of communication, and health status.