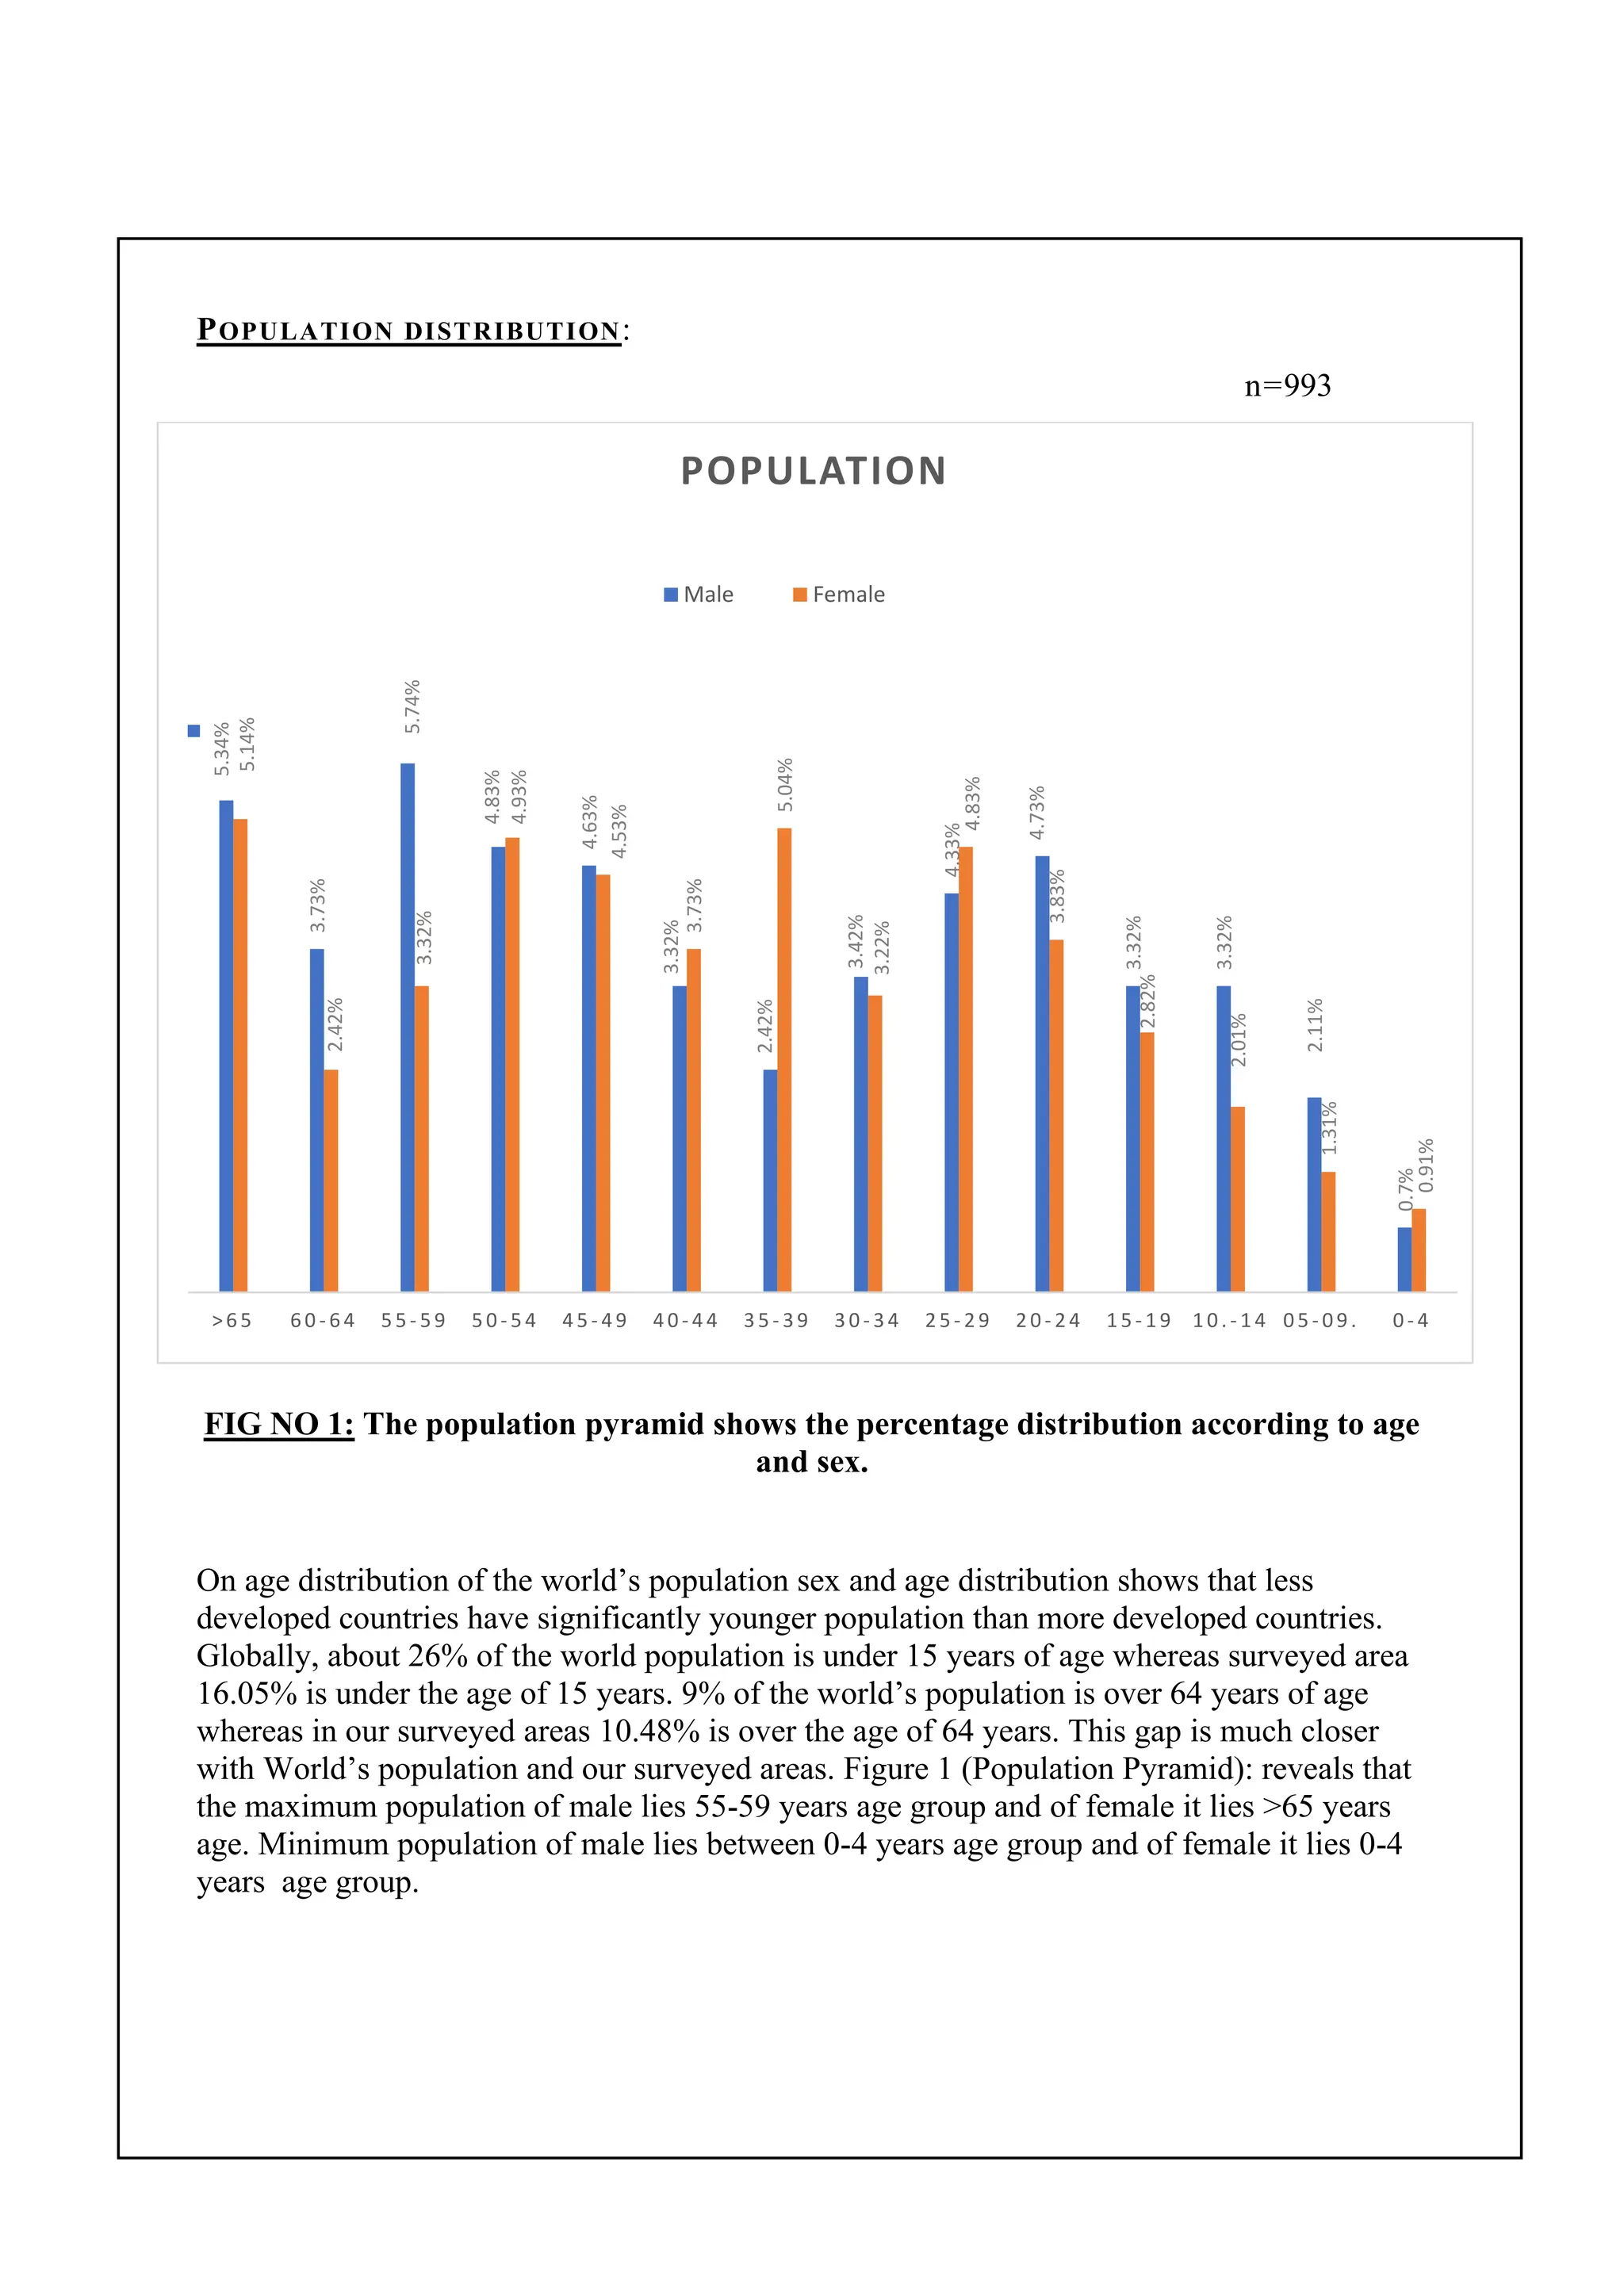
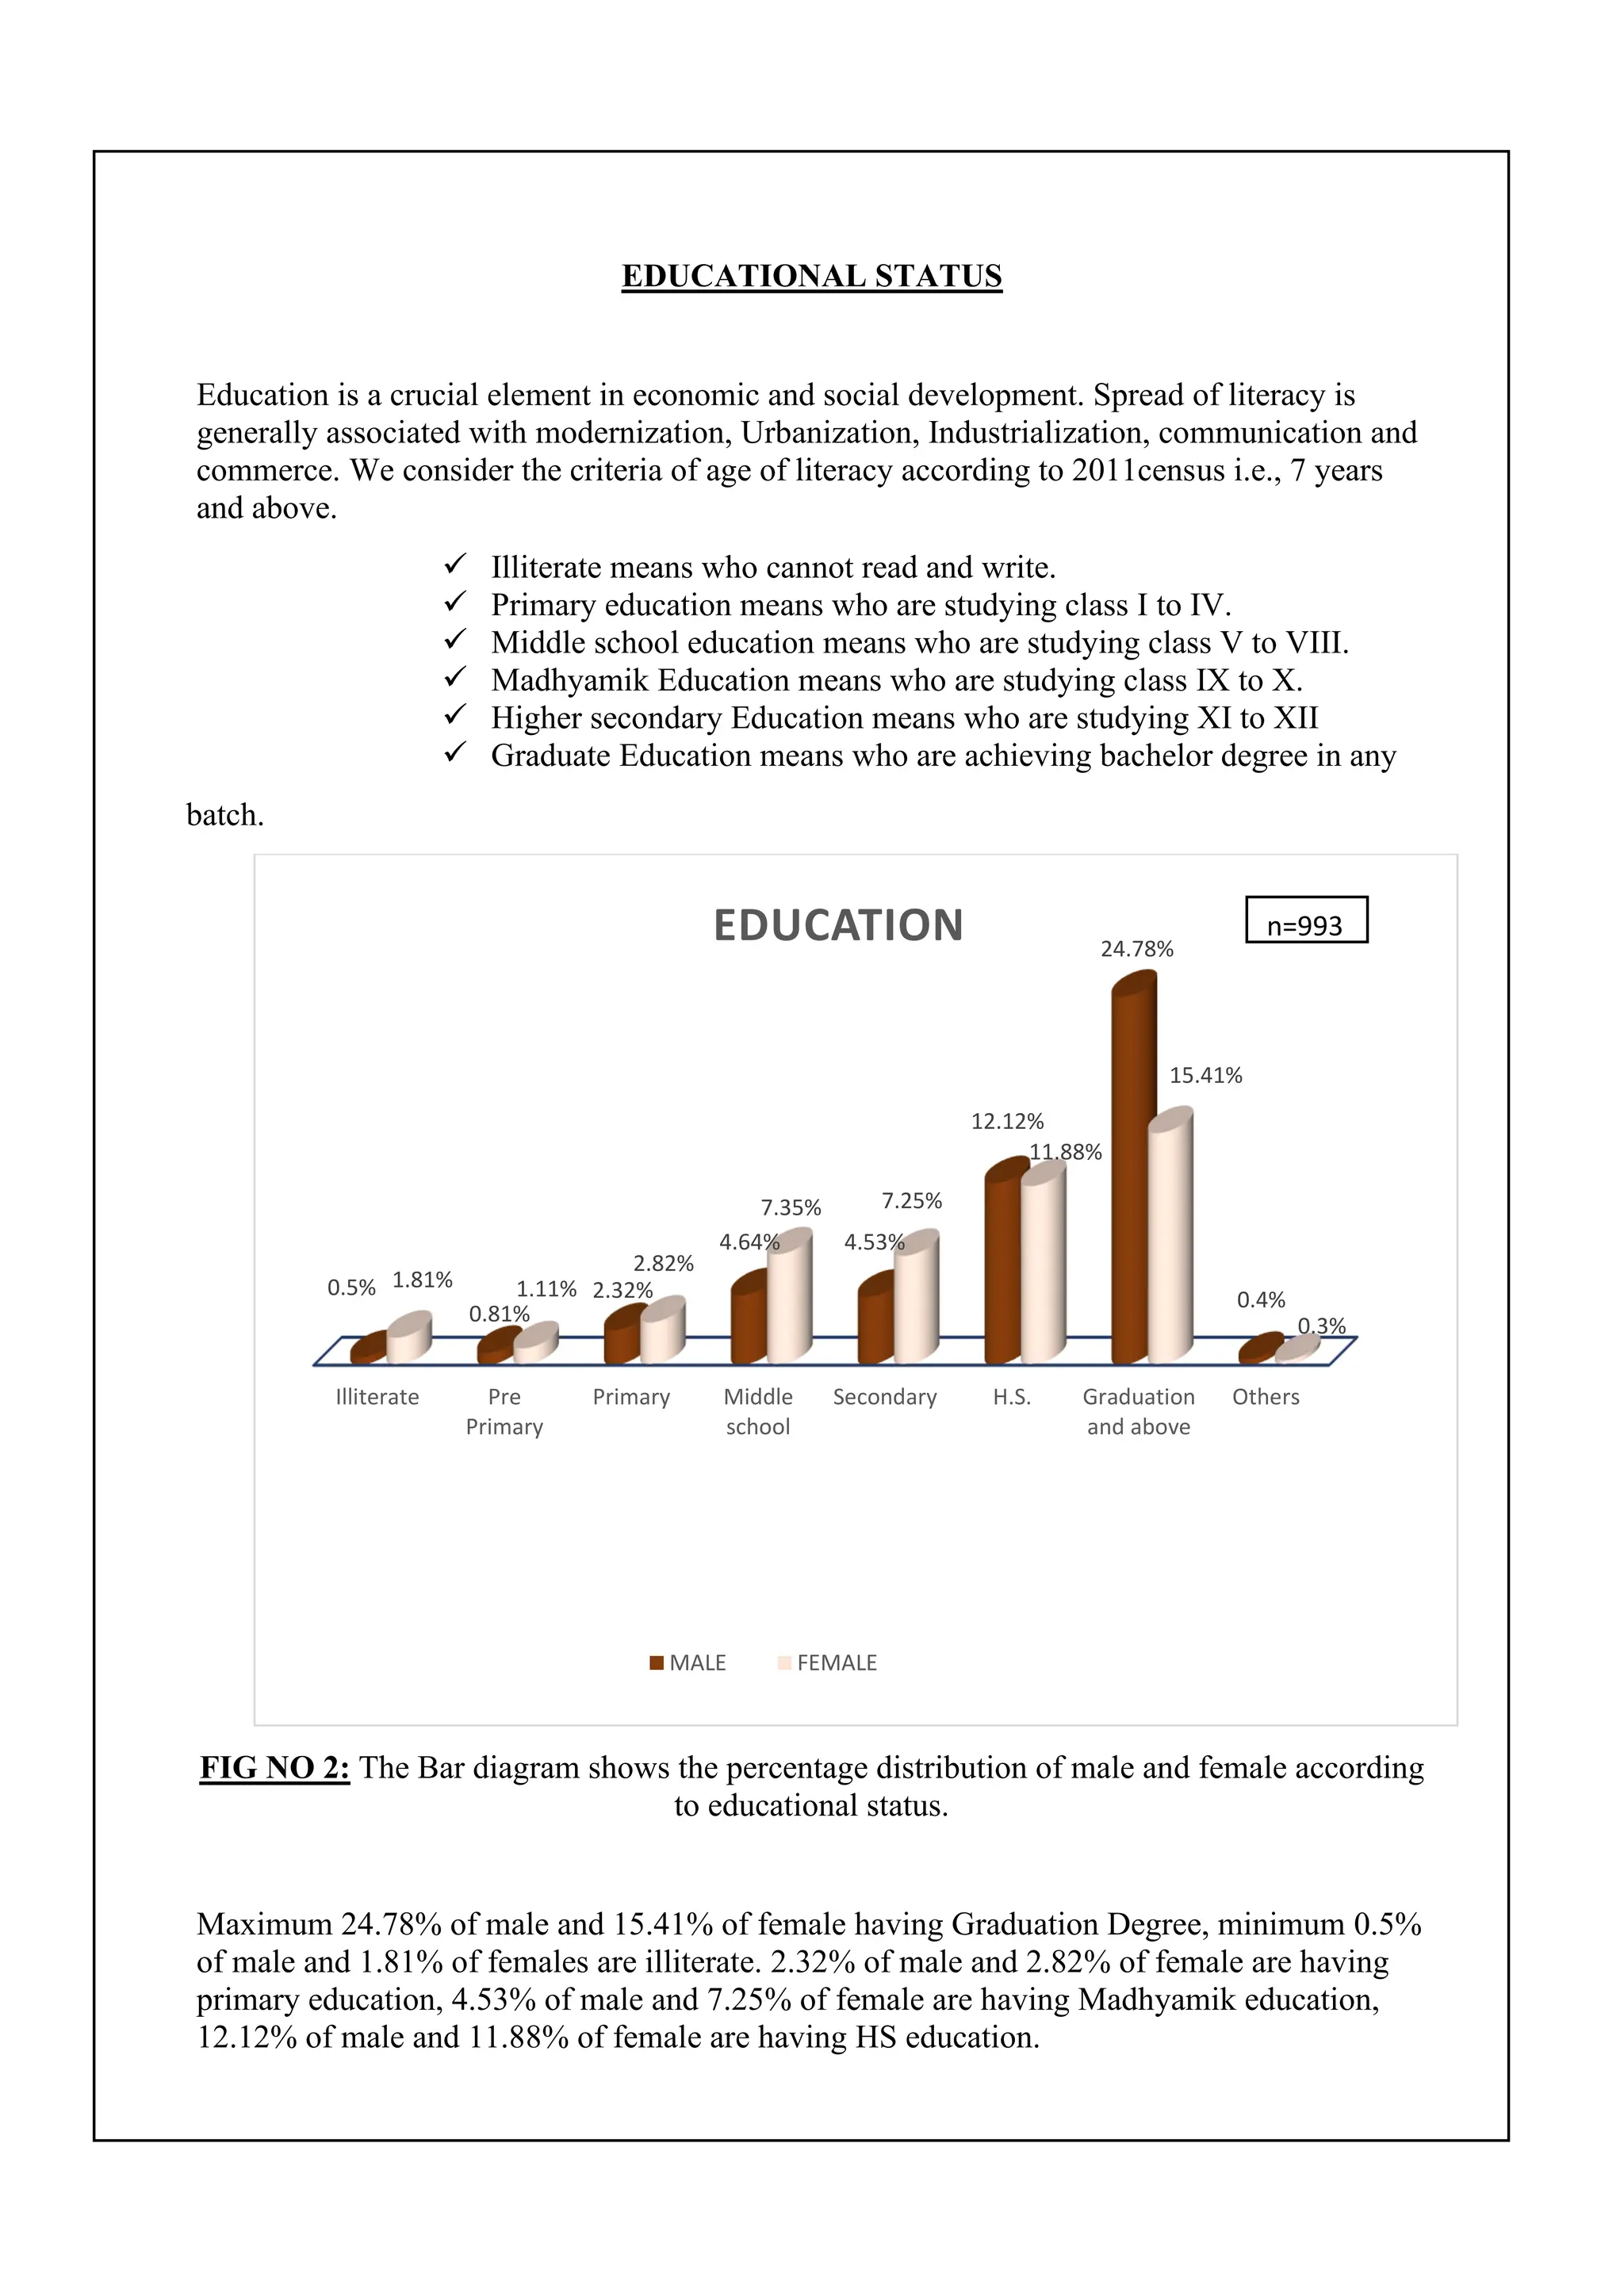
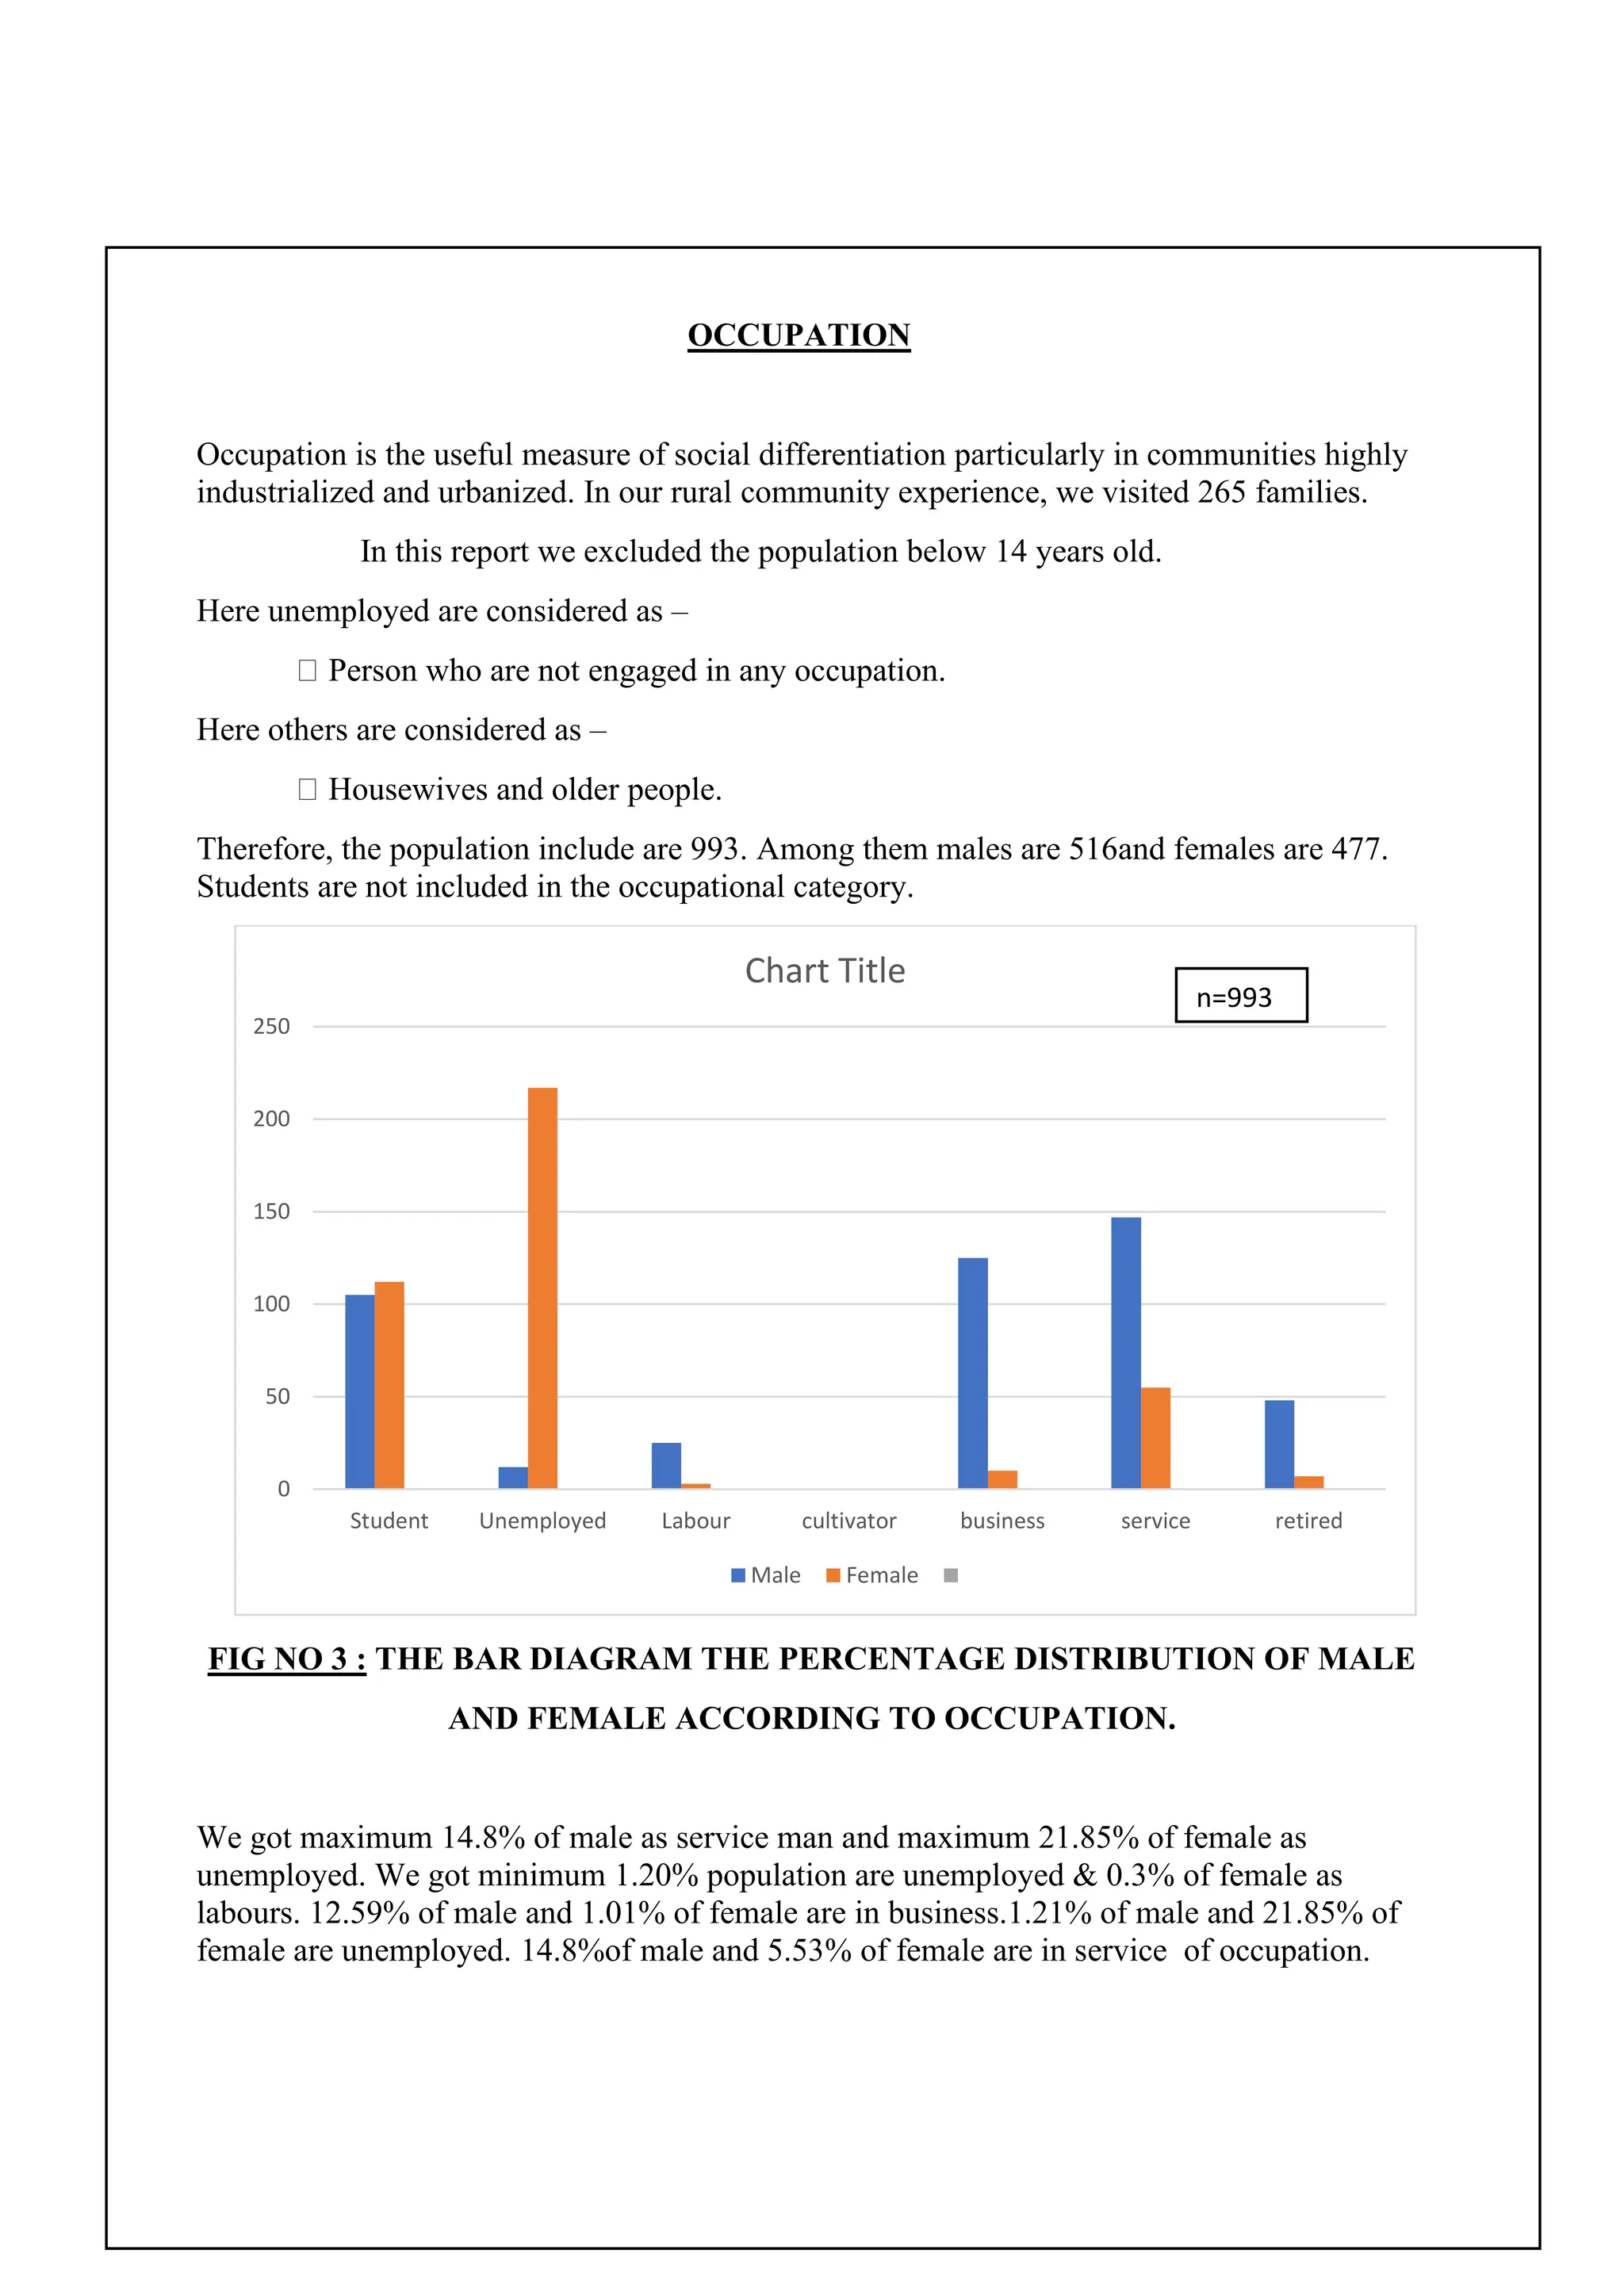
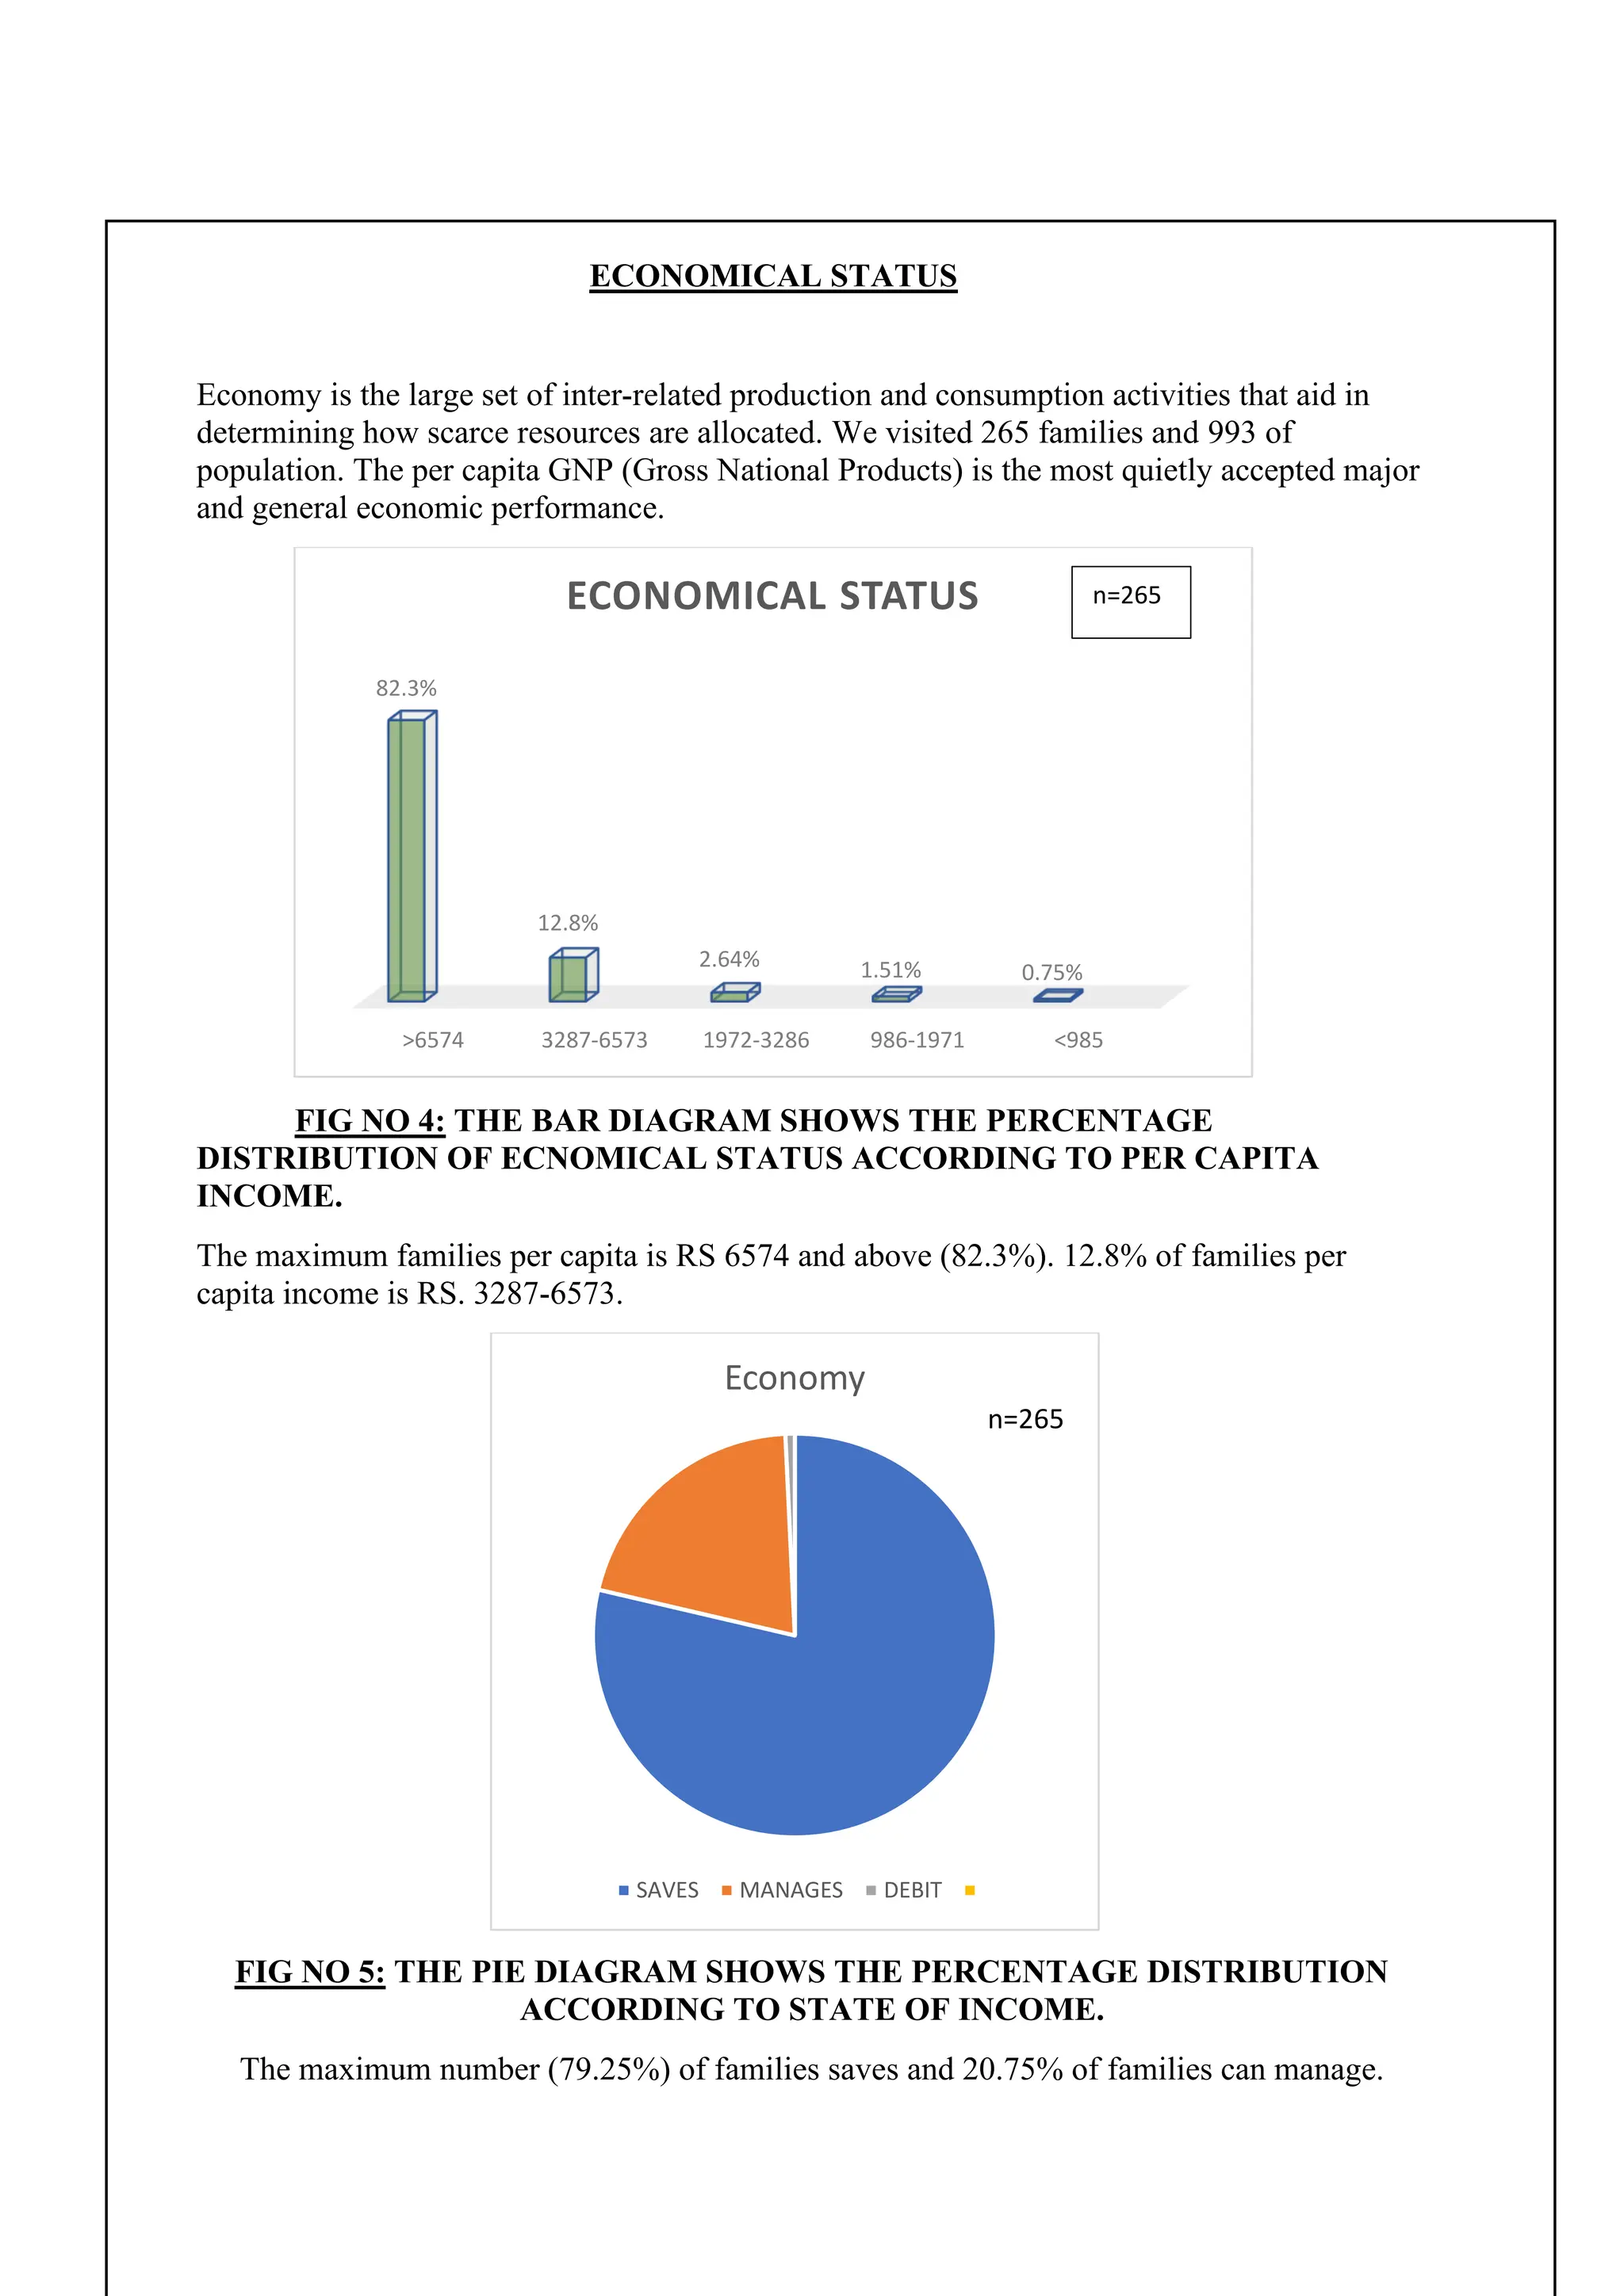
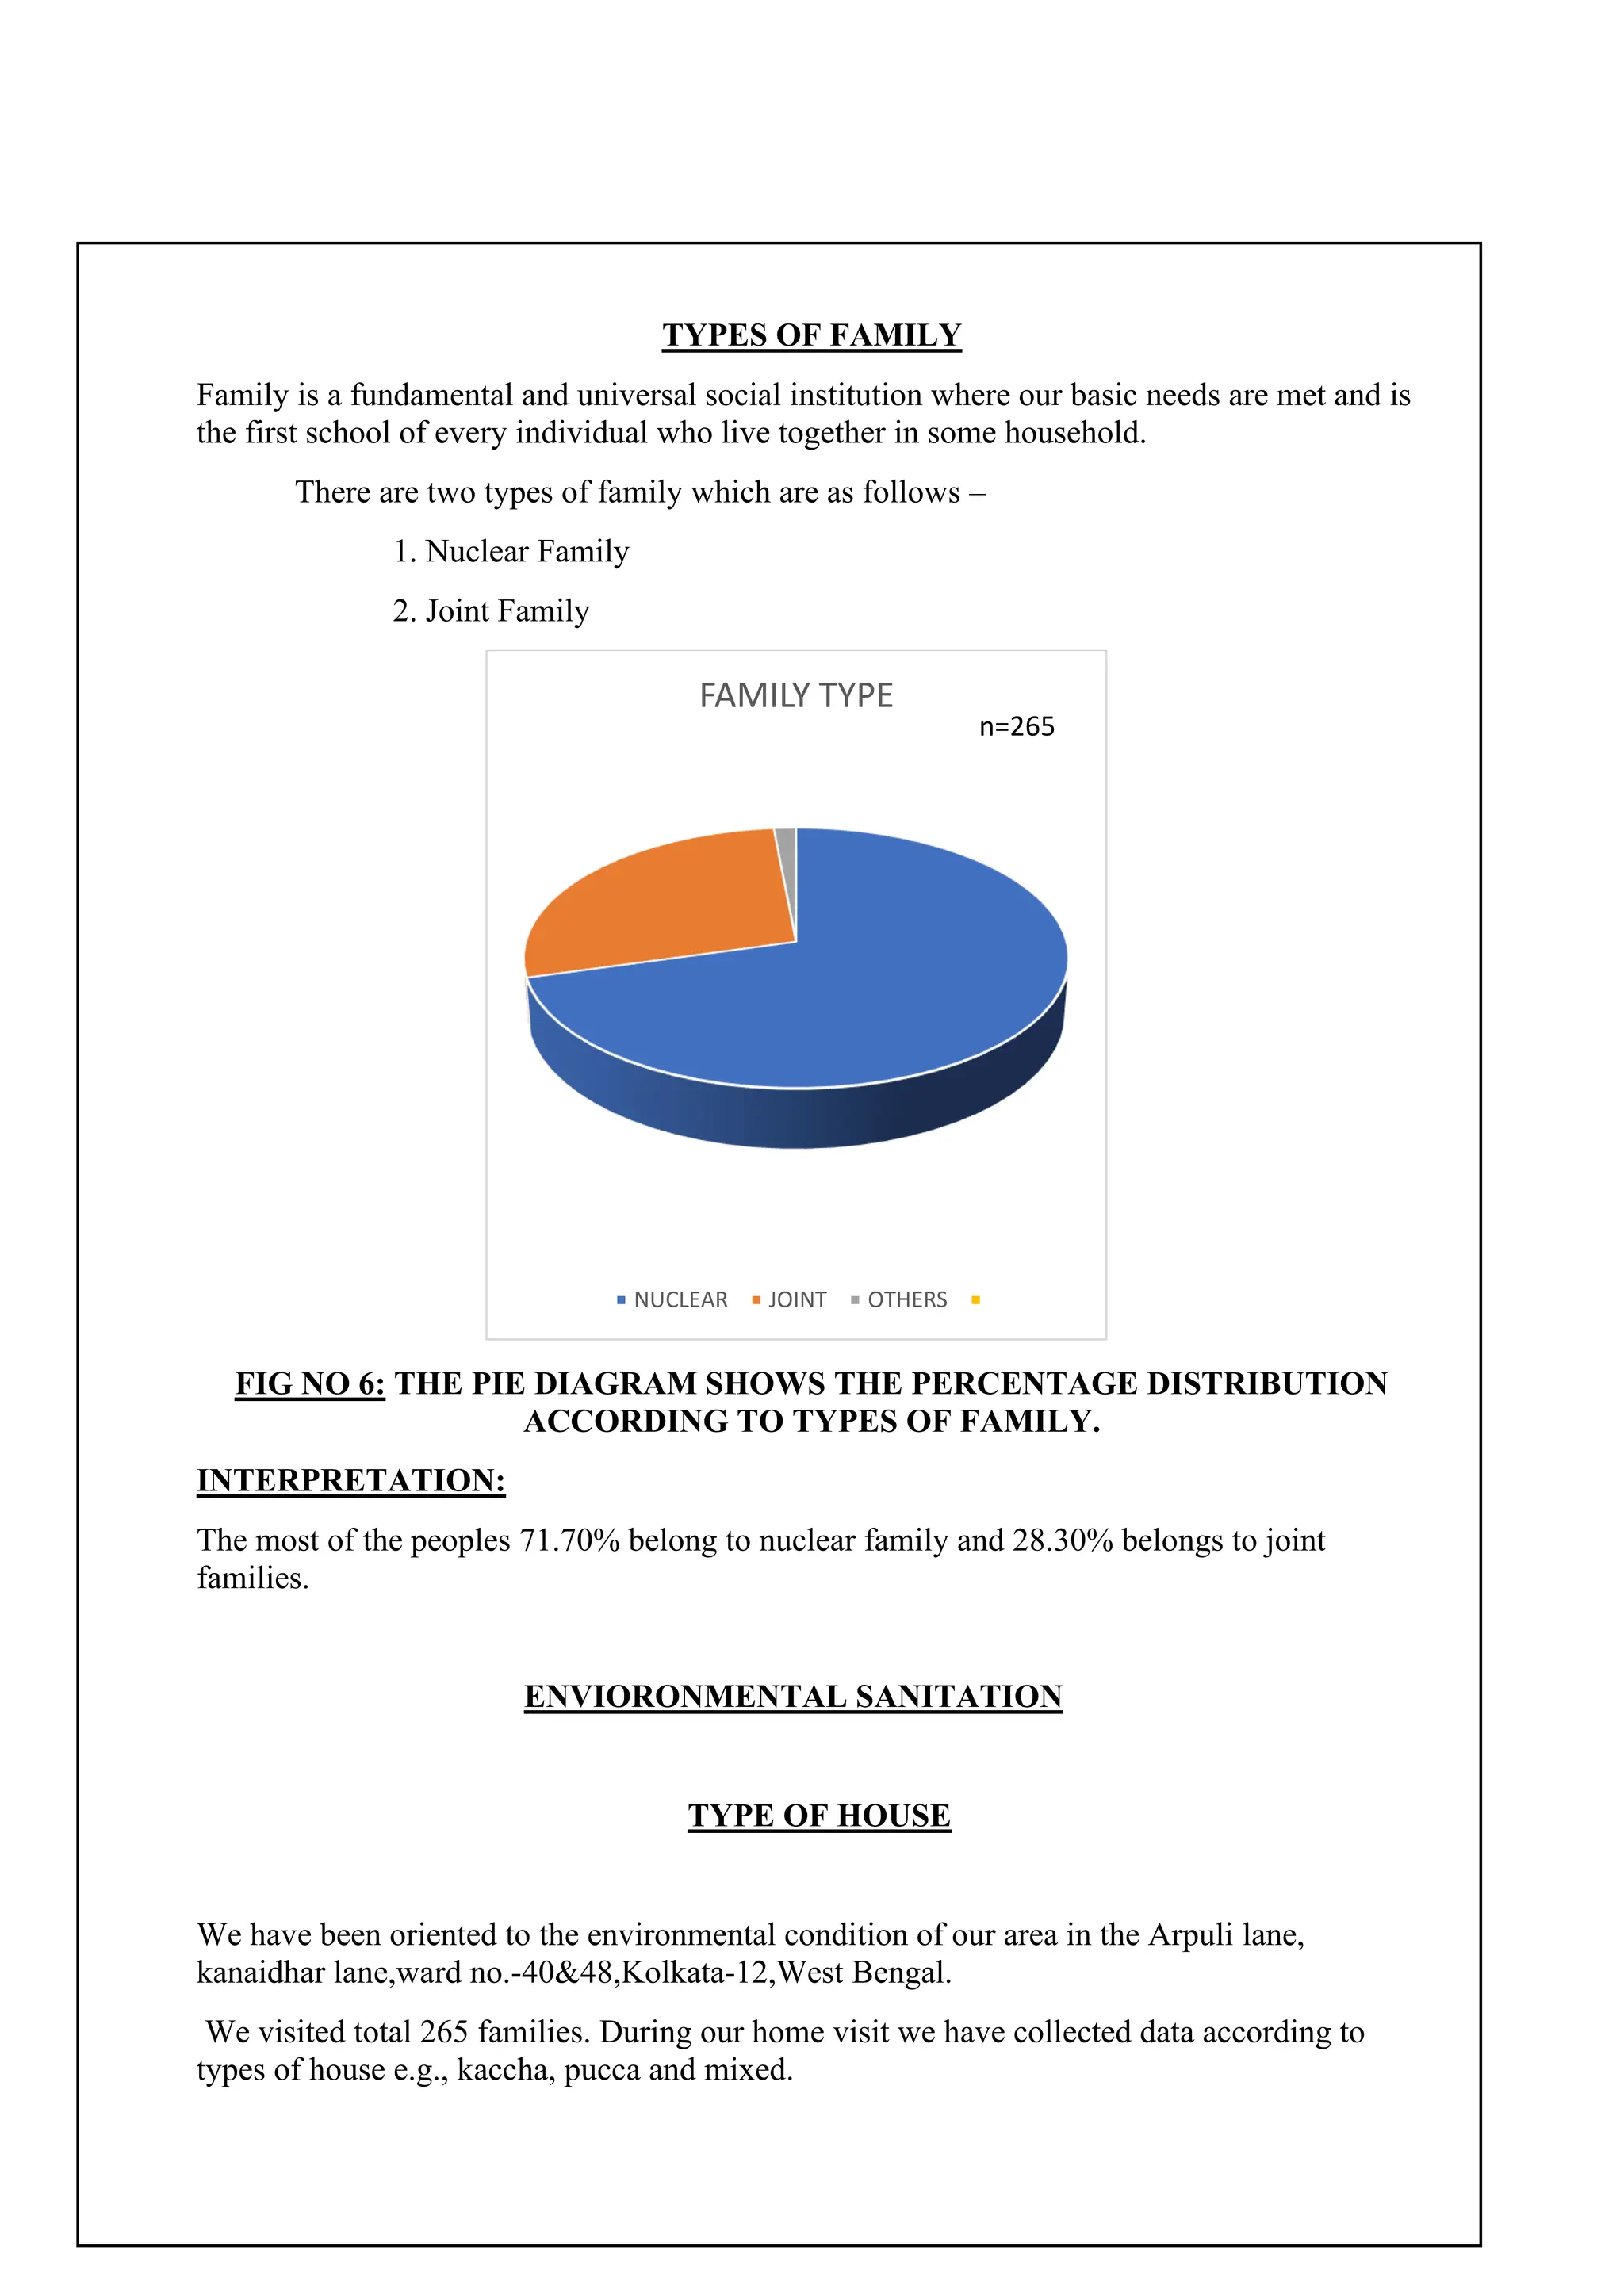
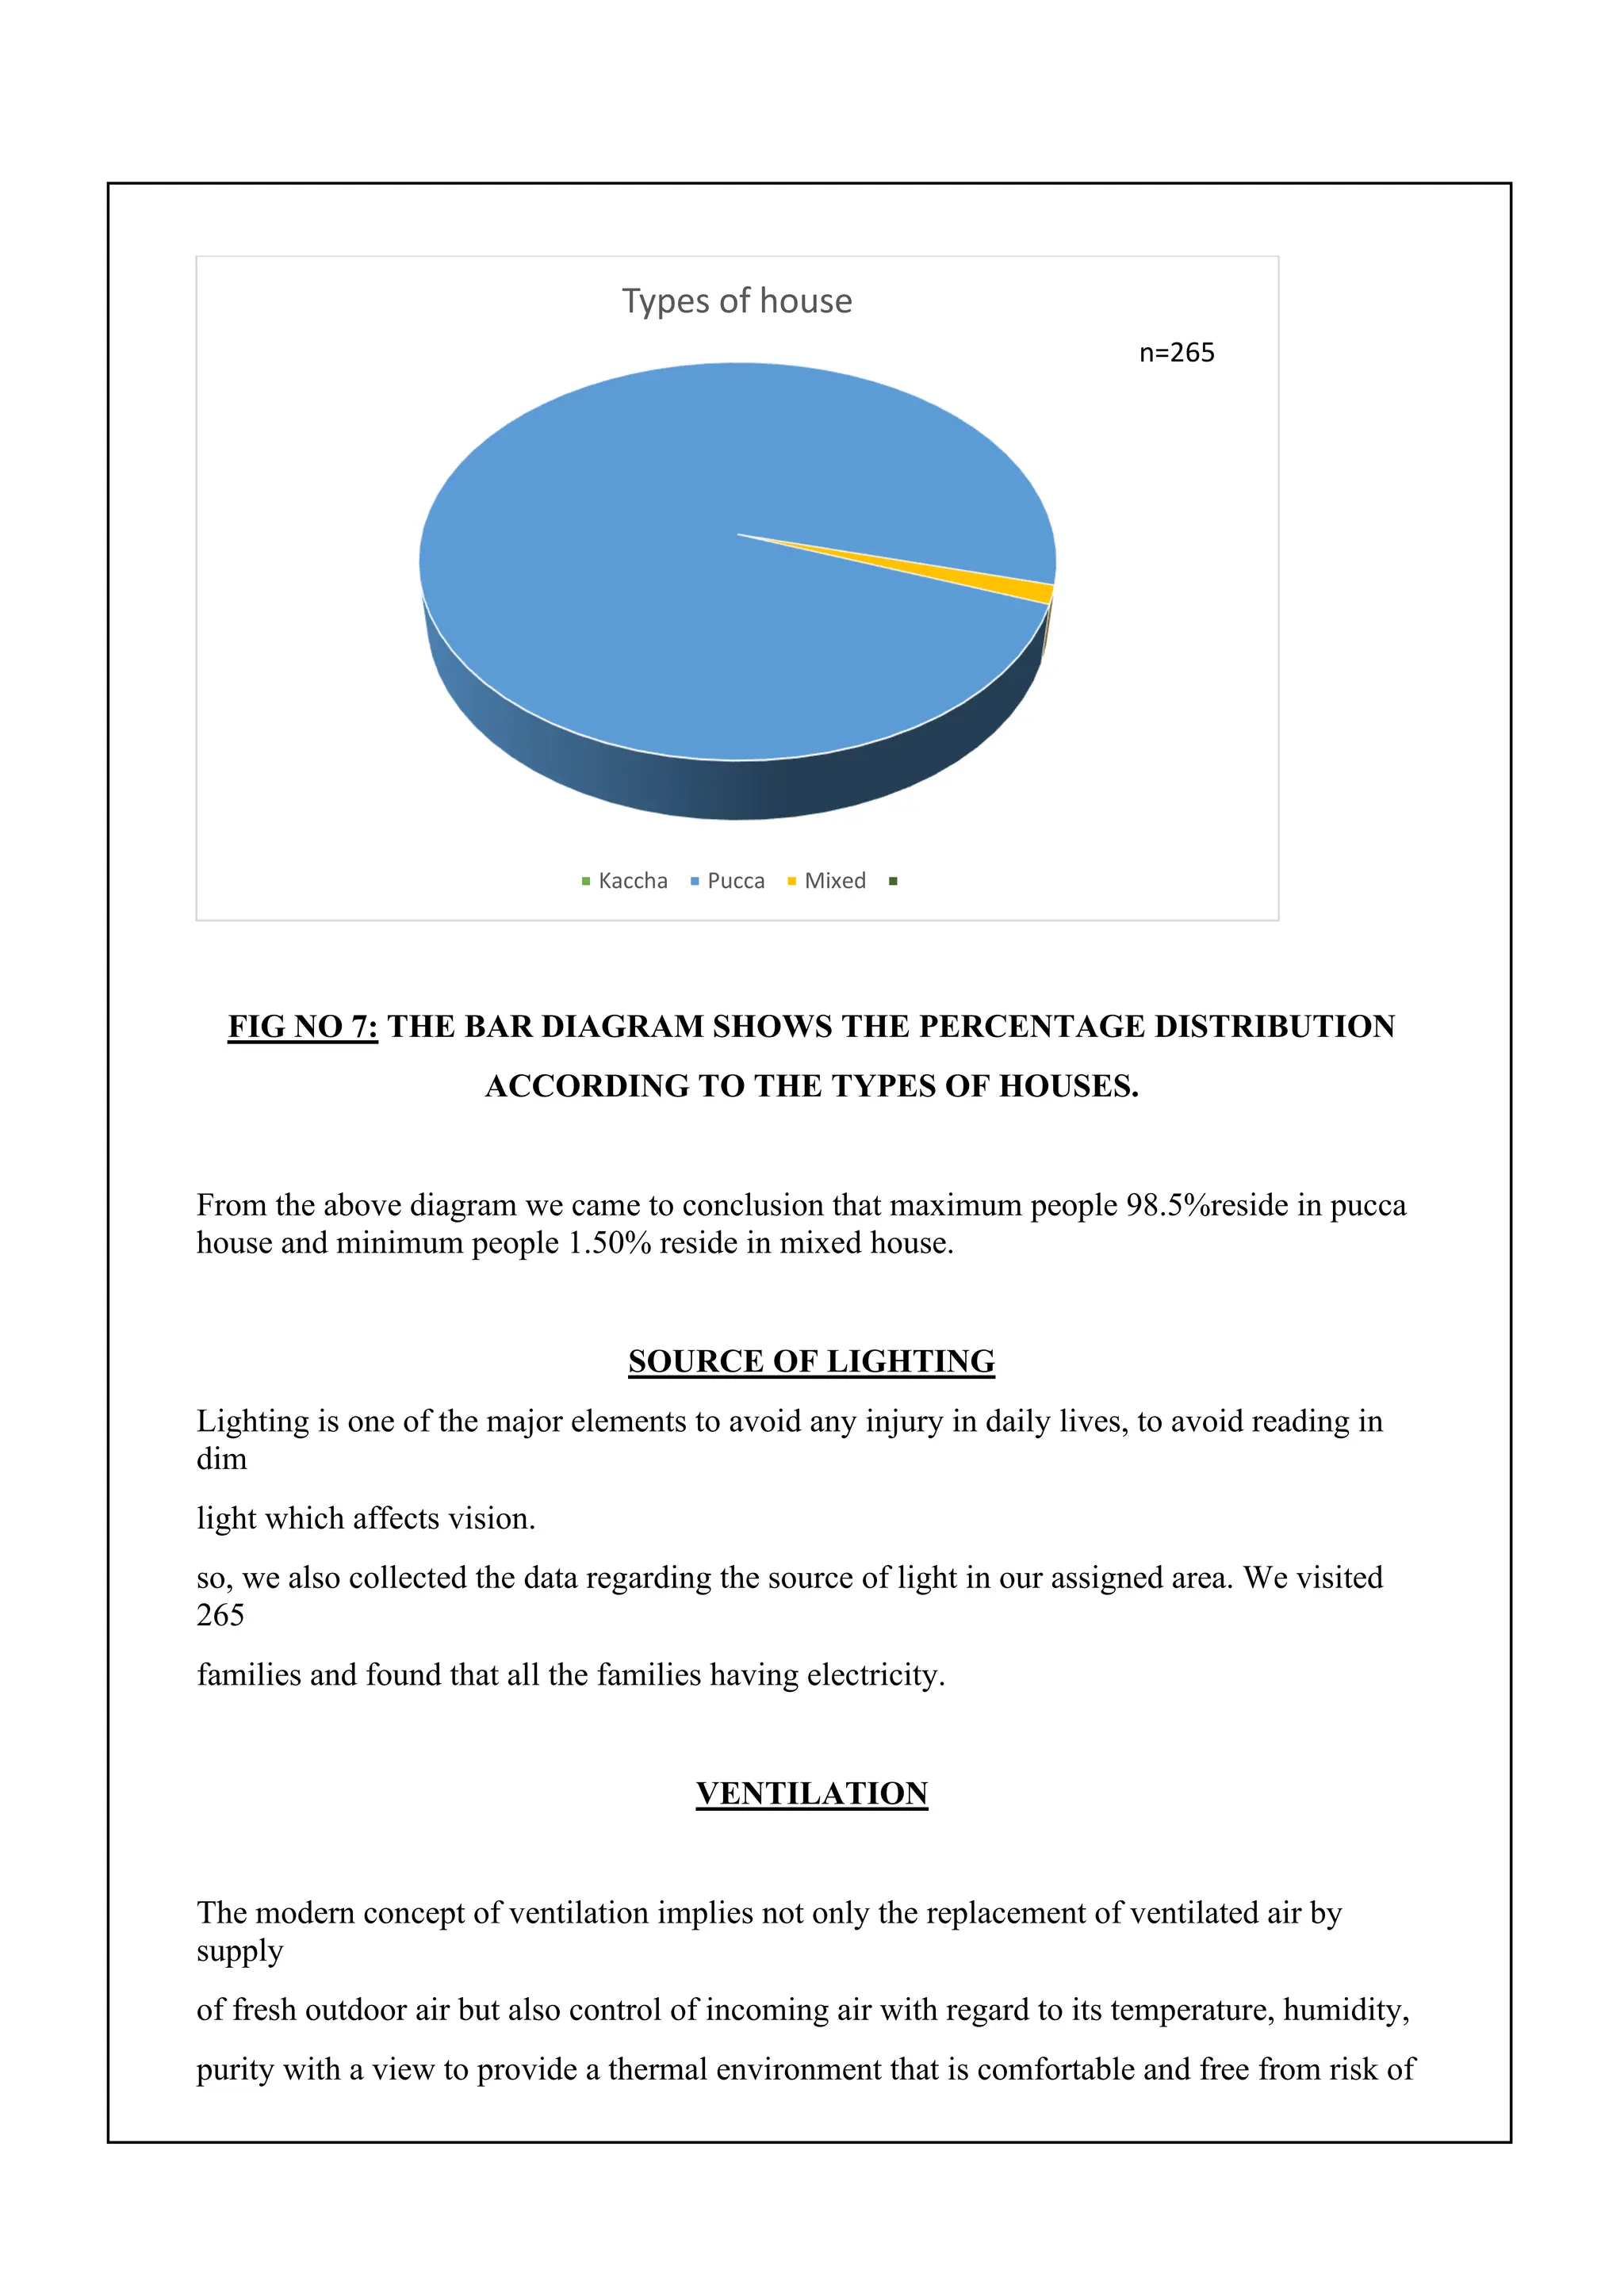
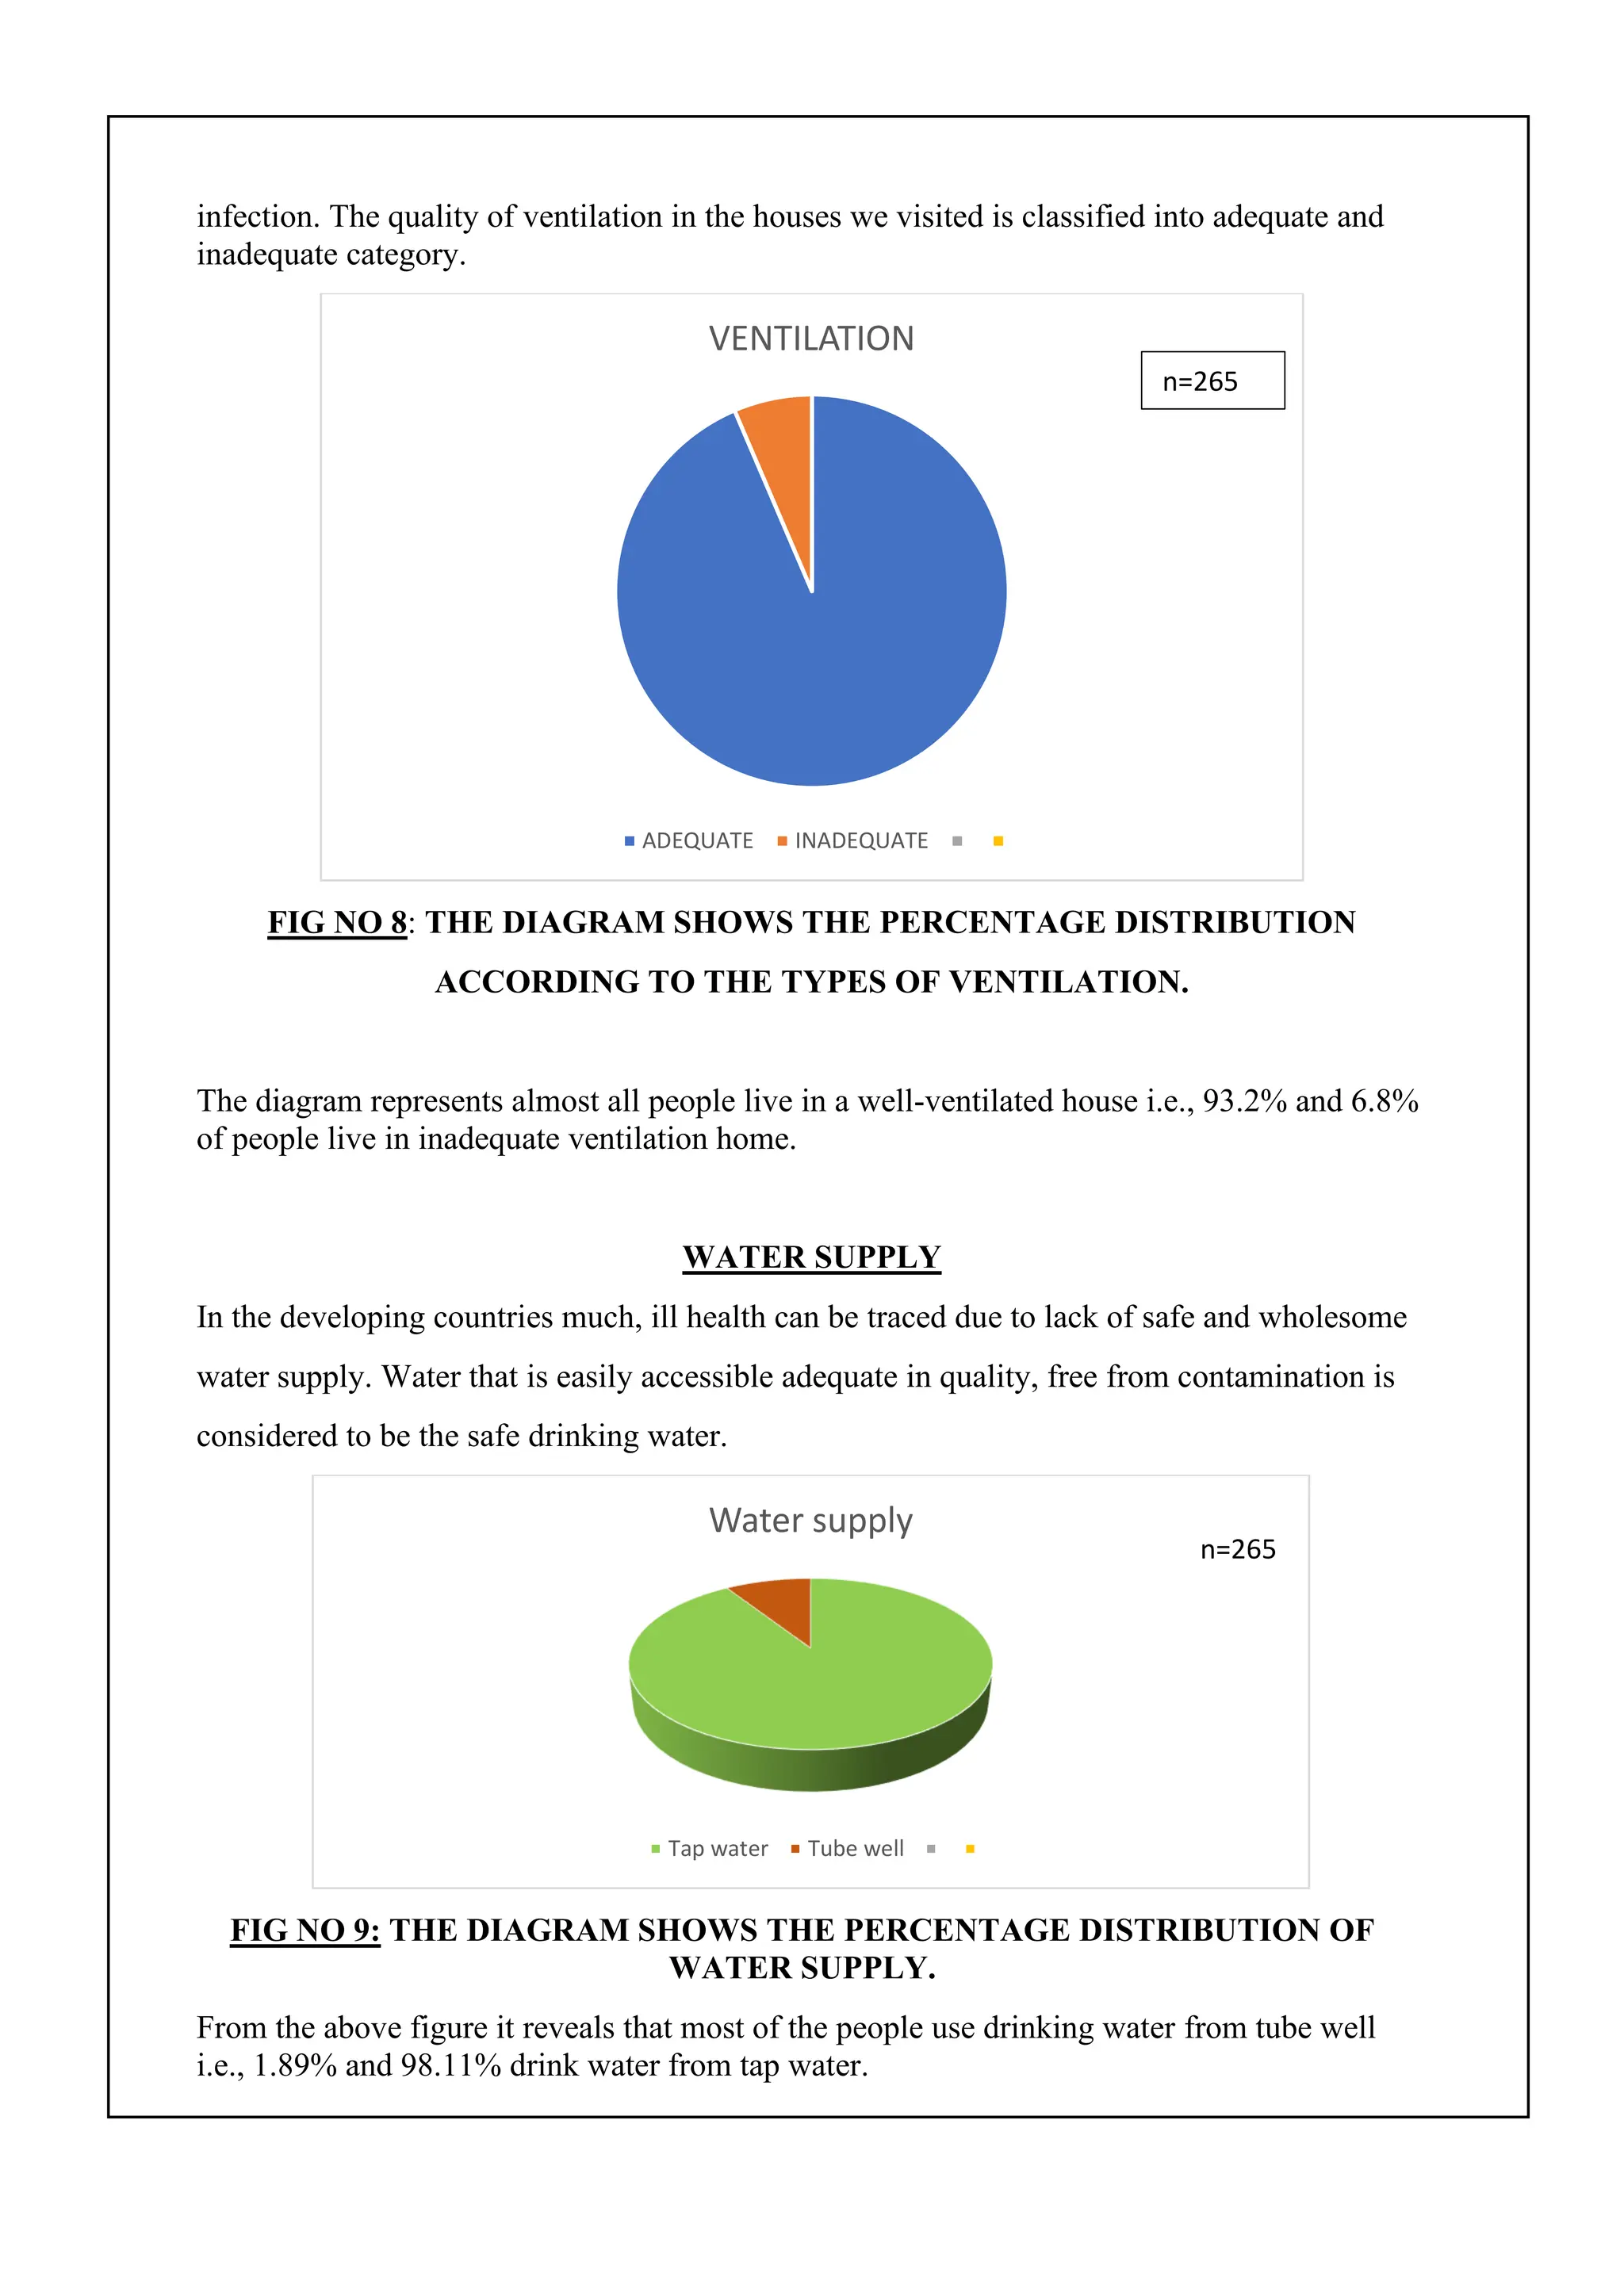
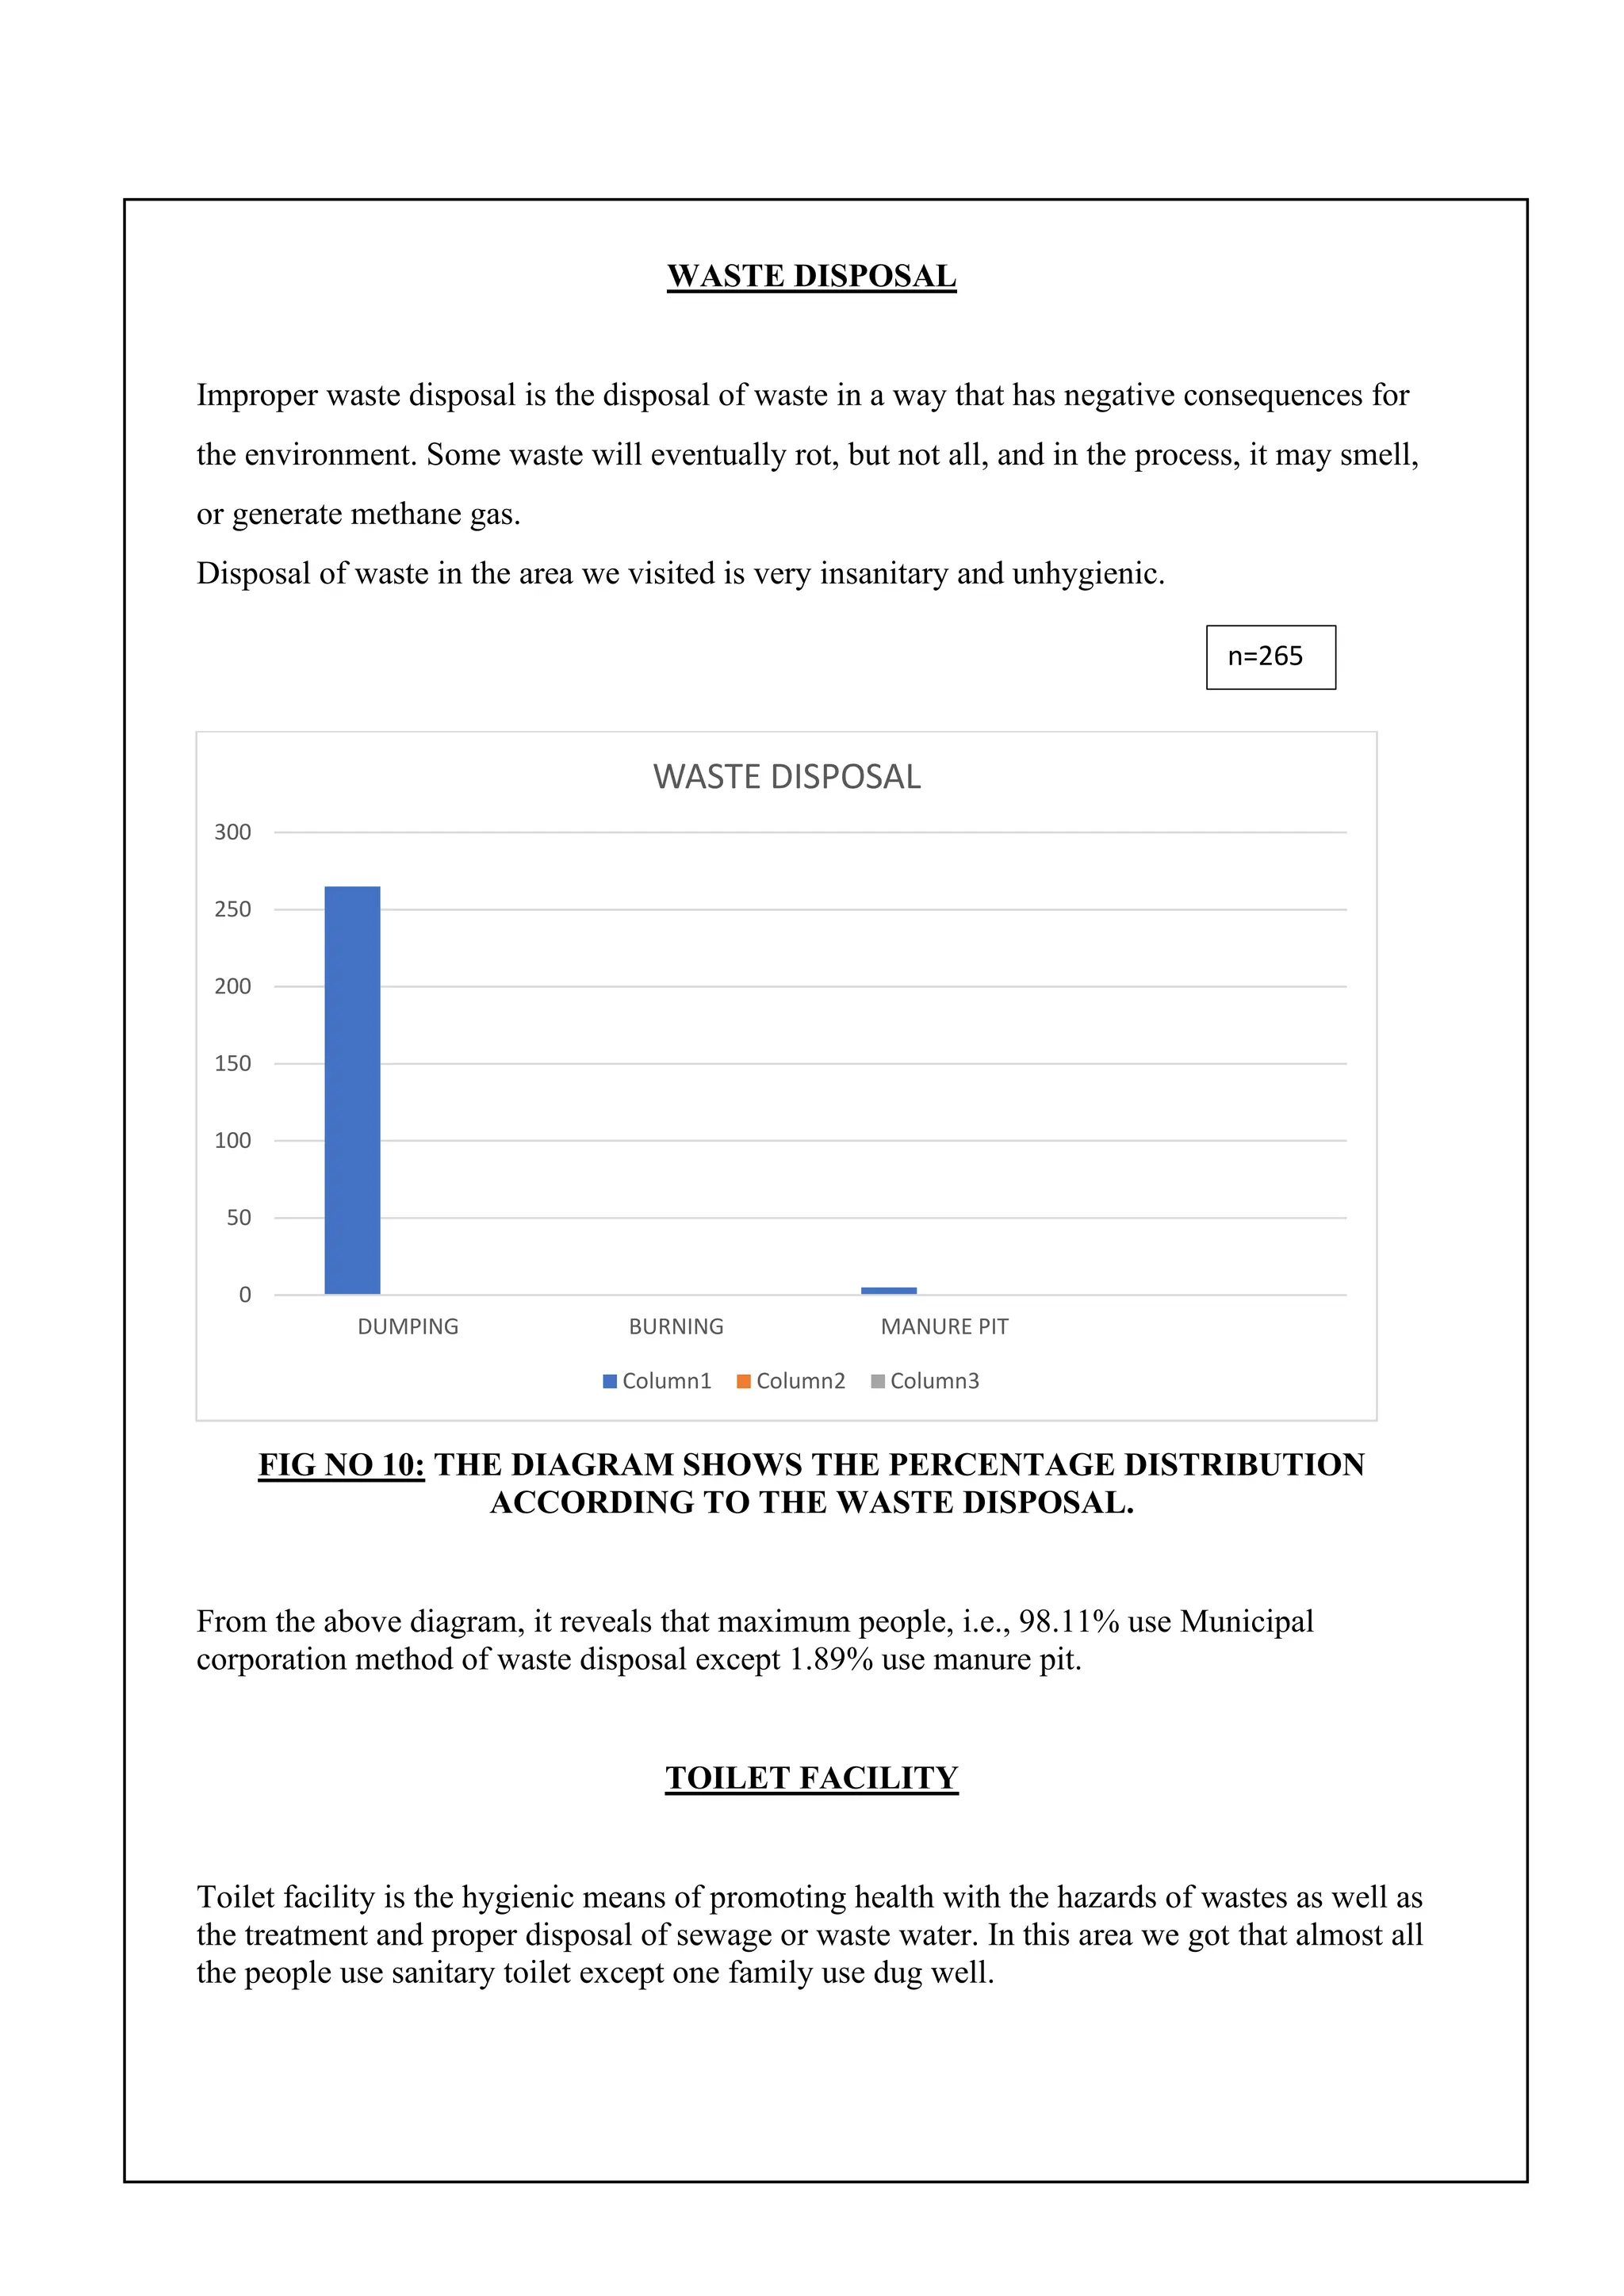
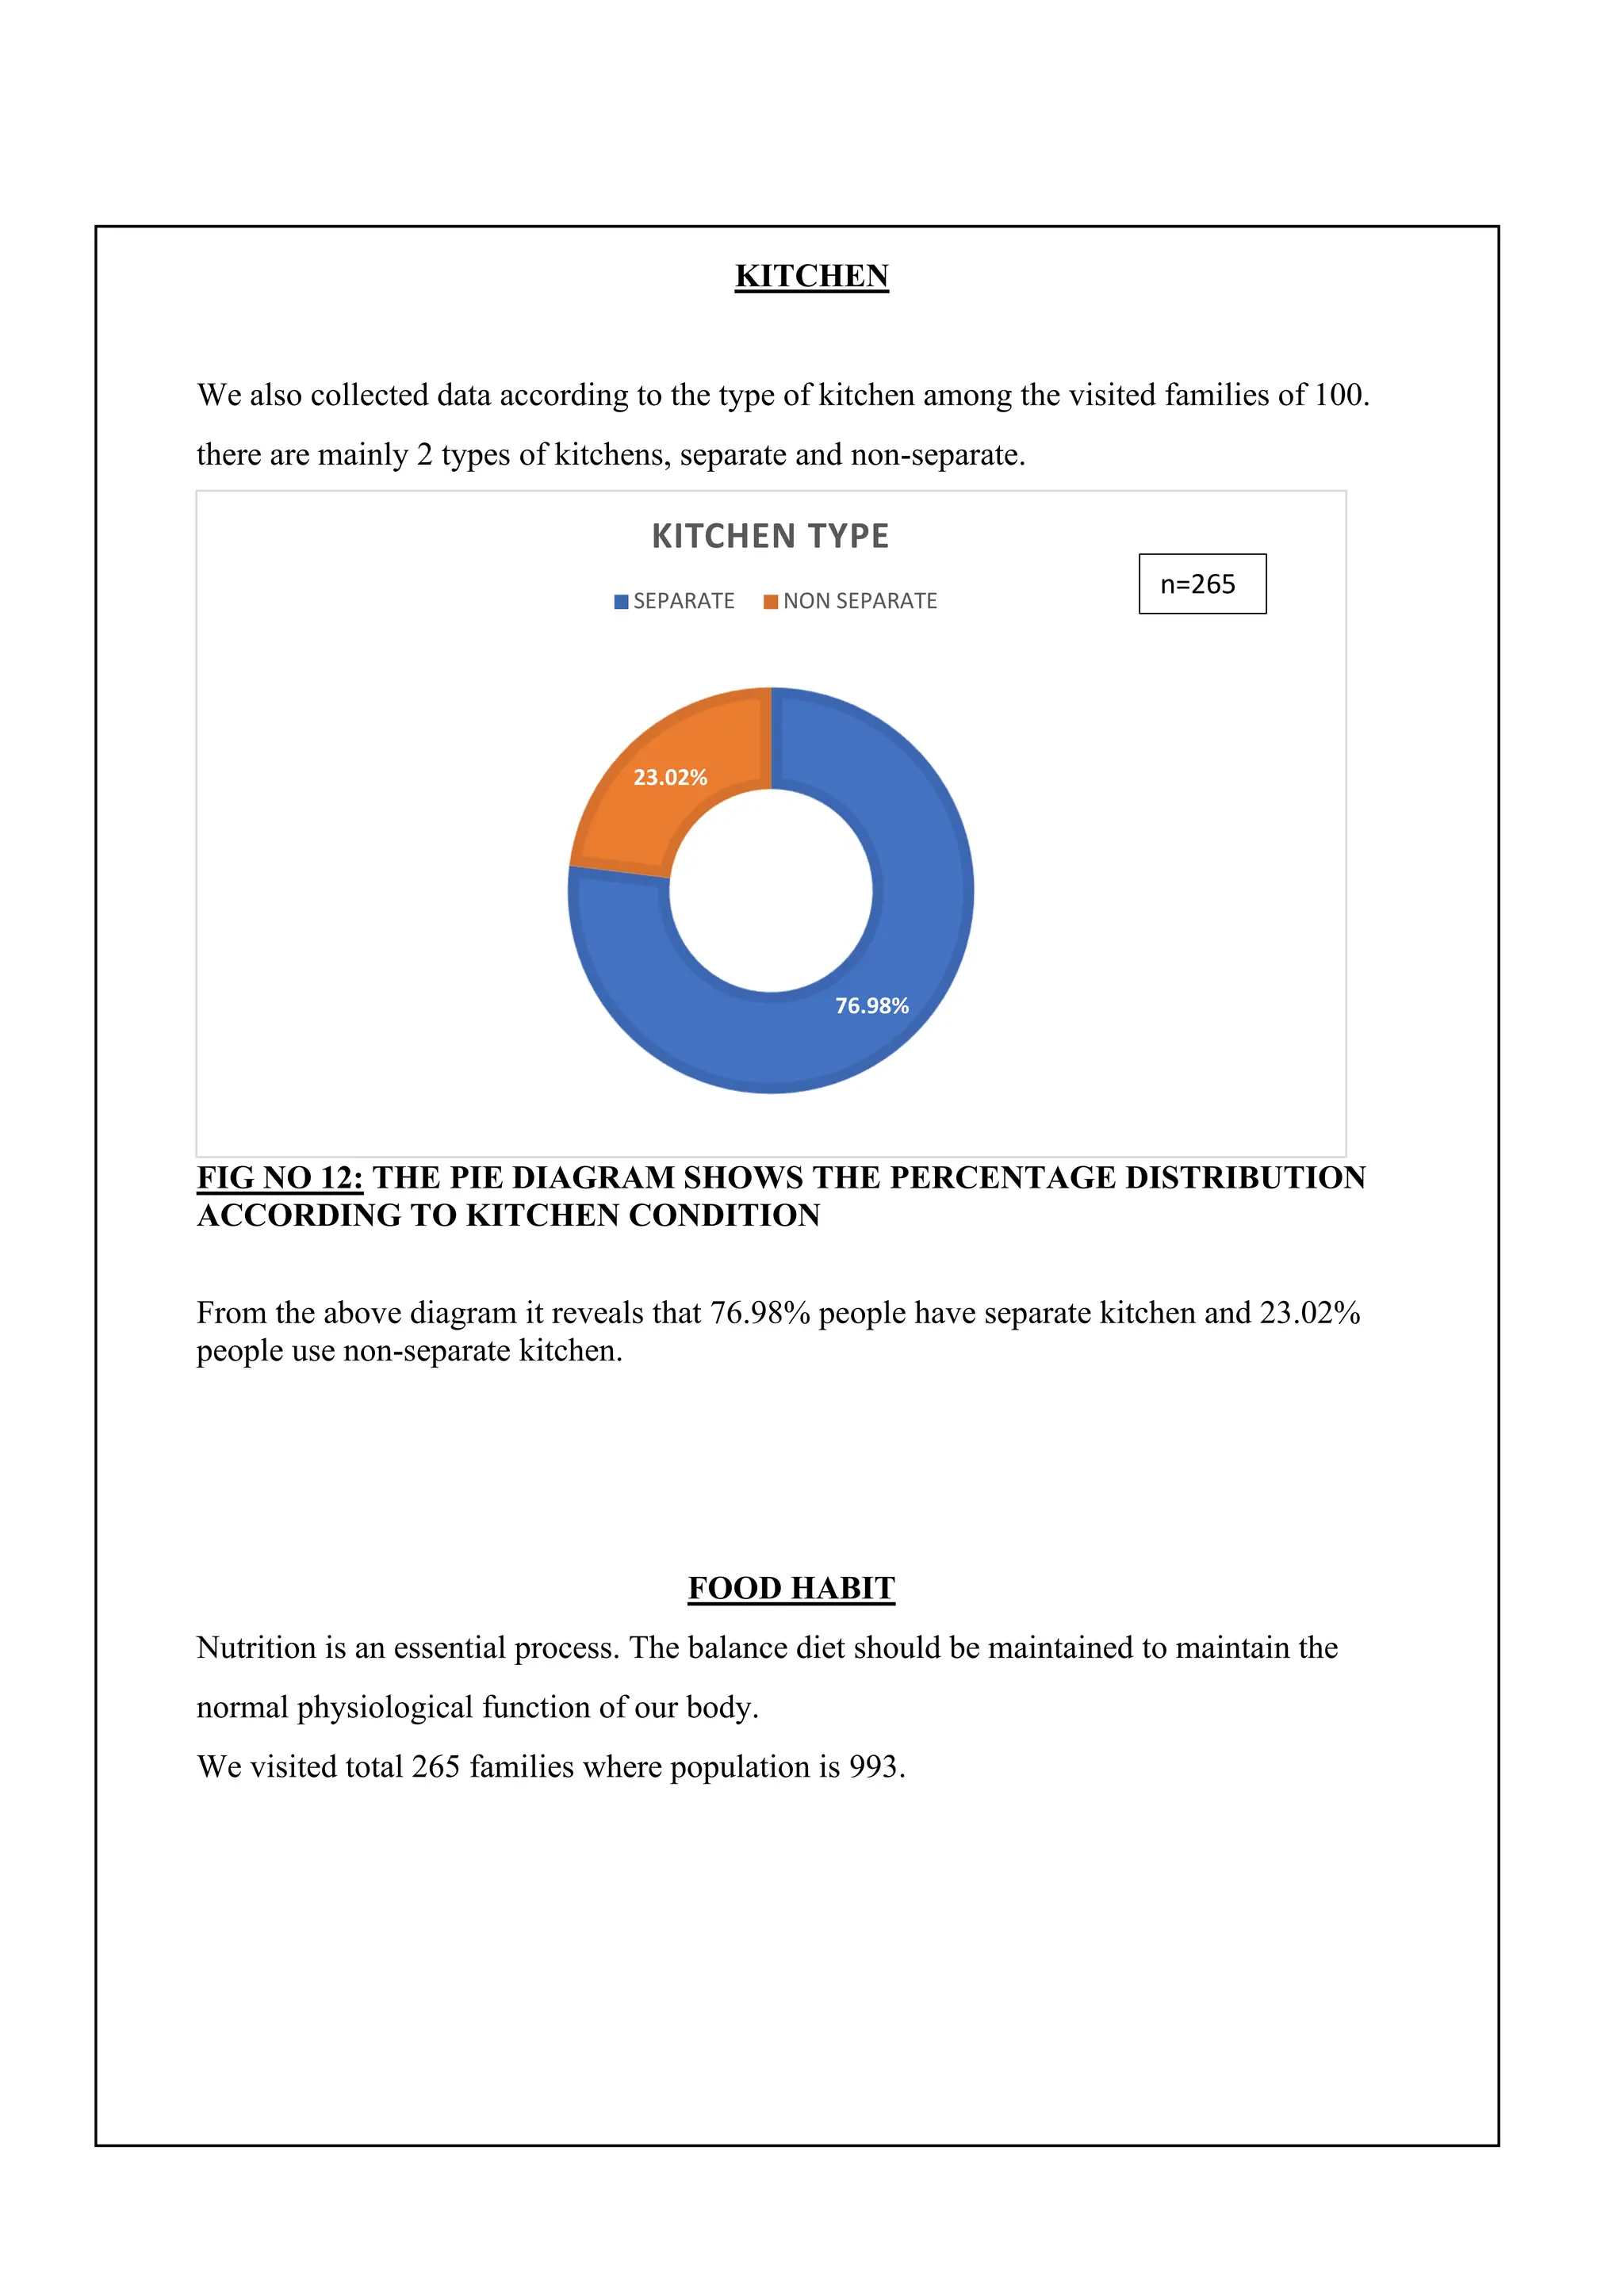
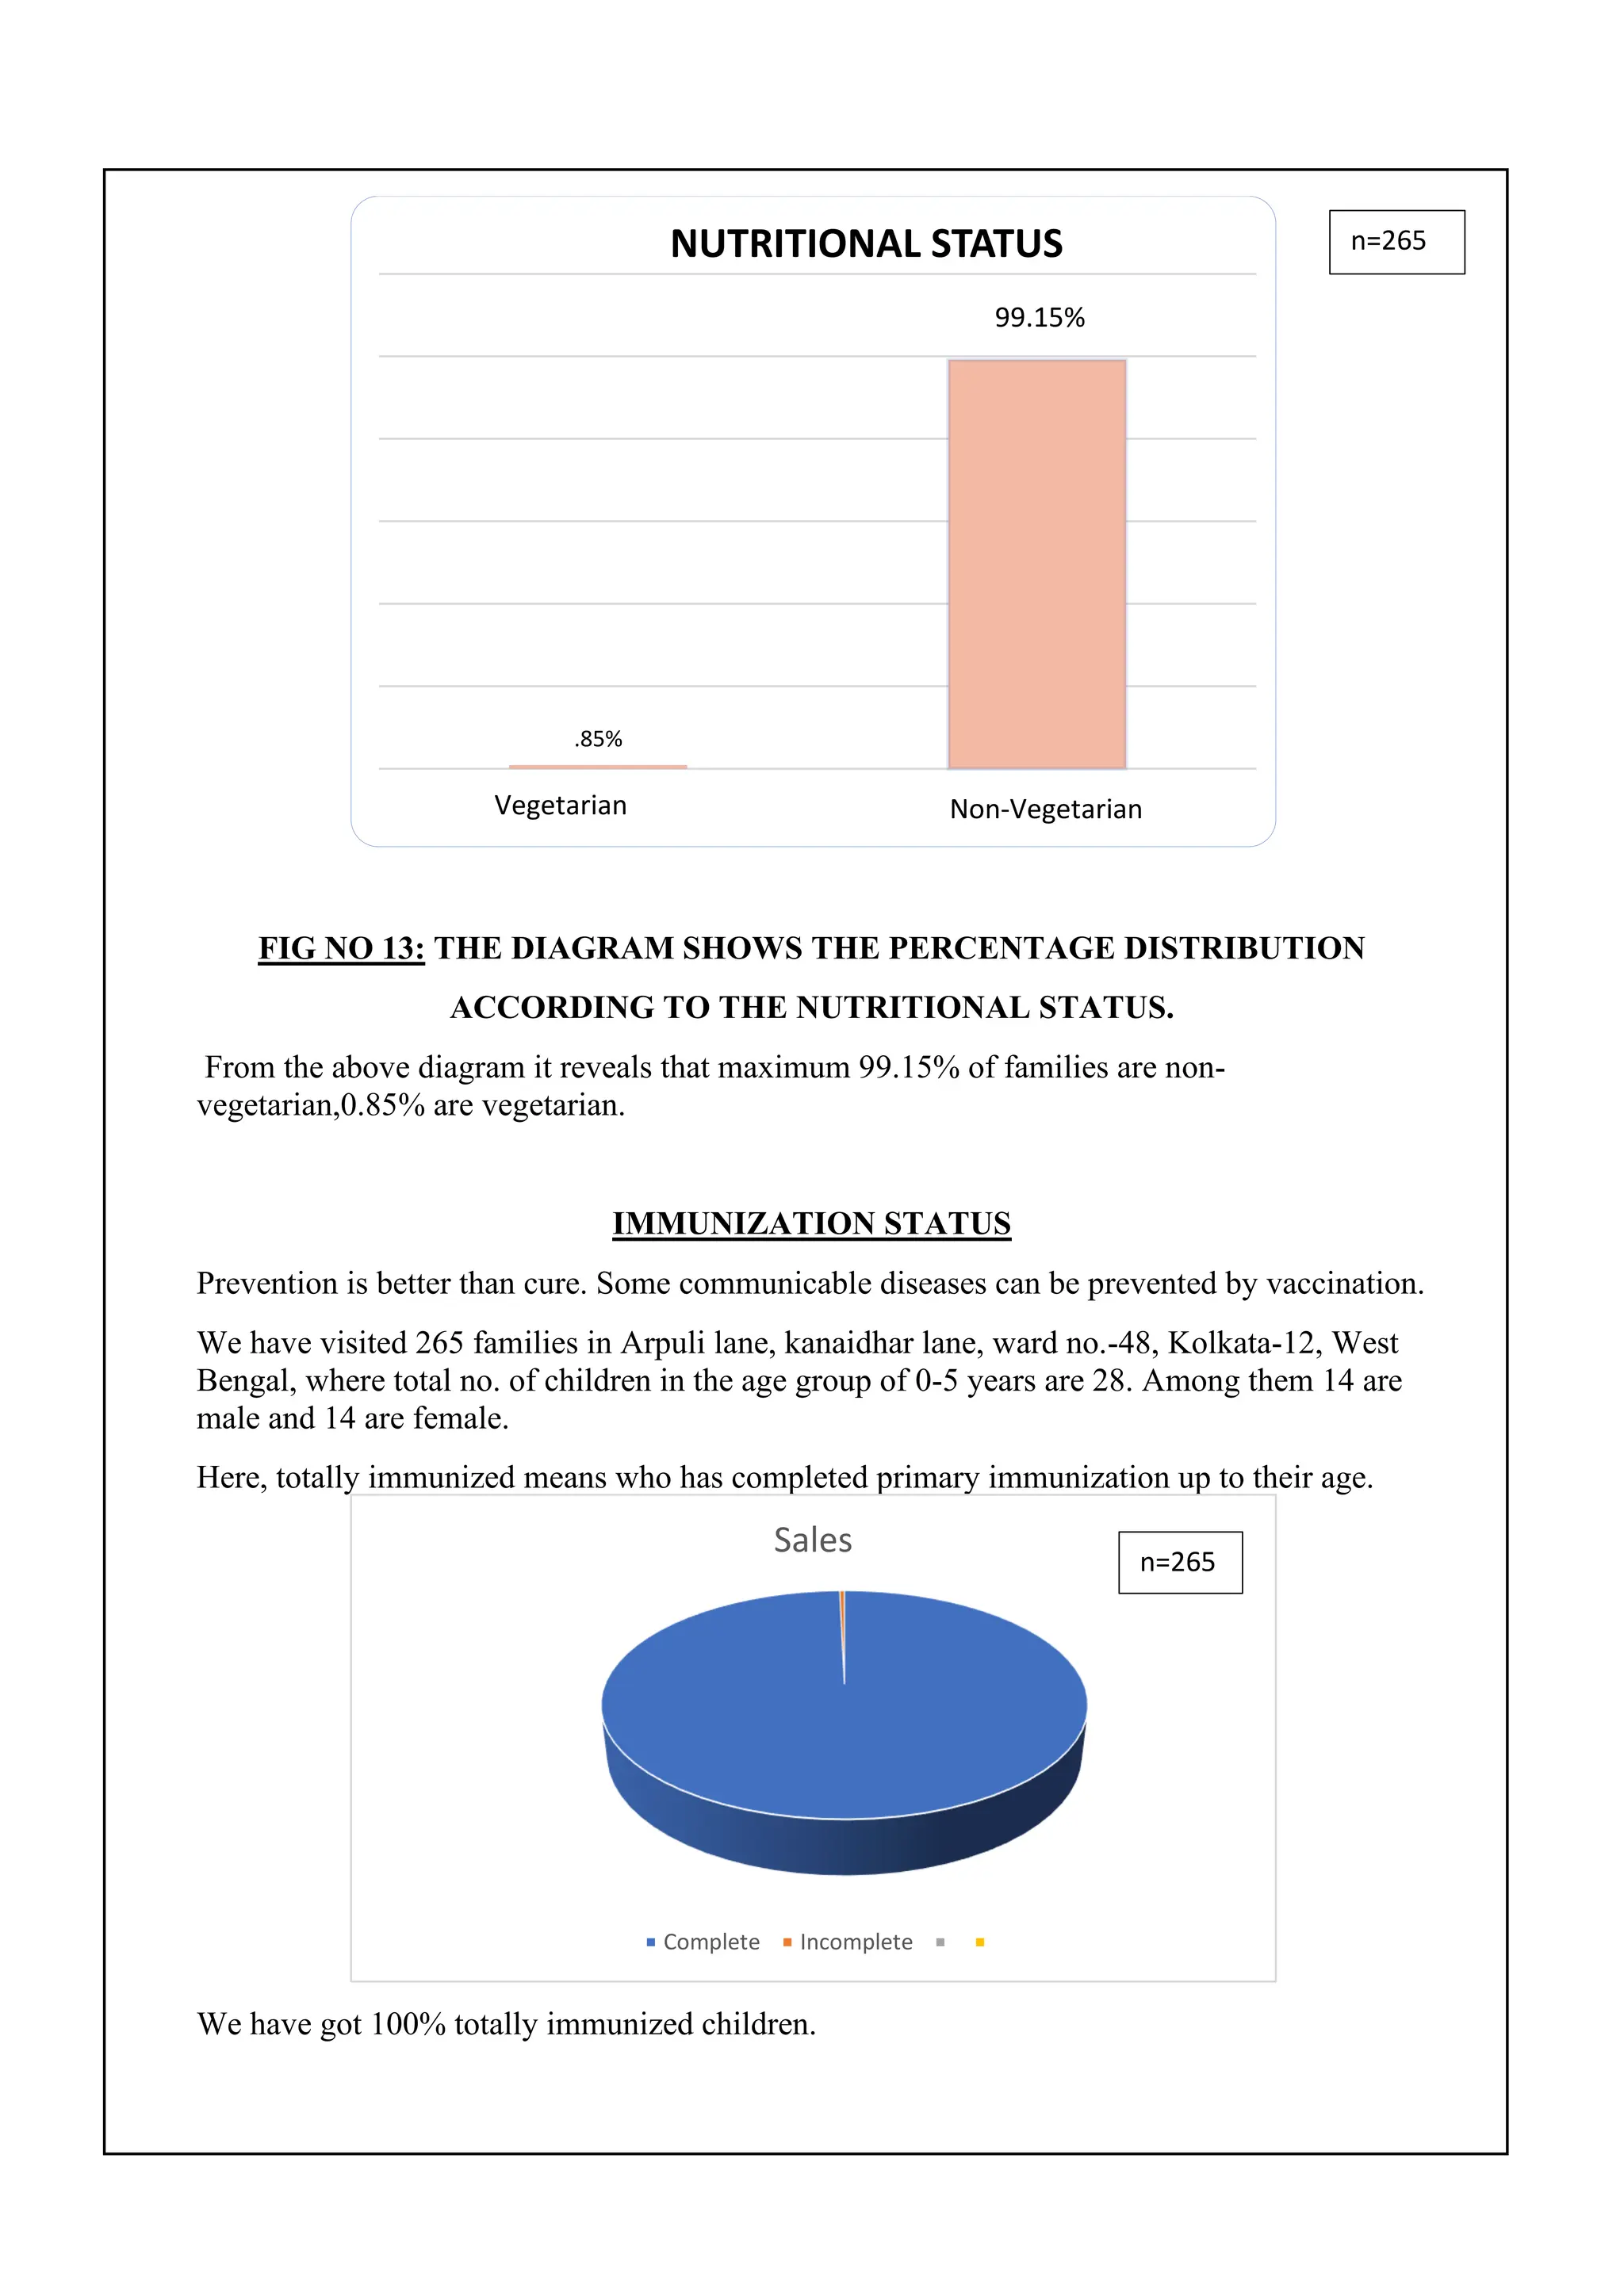
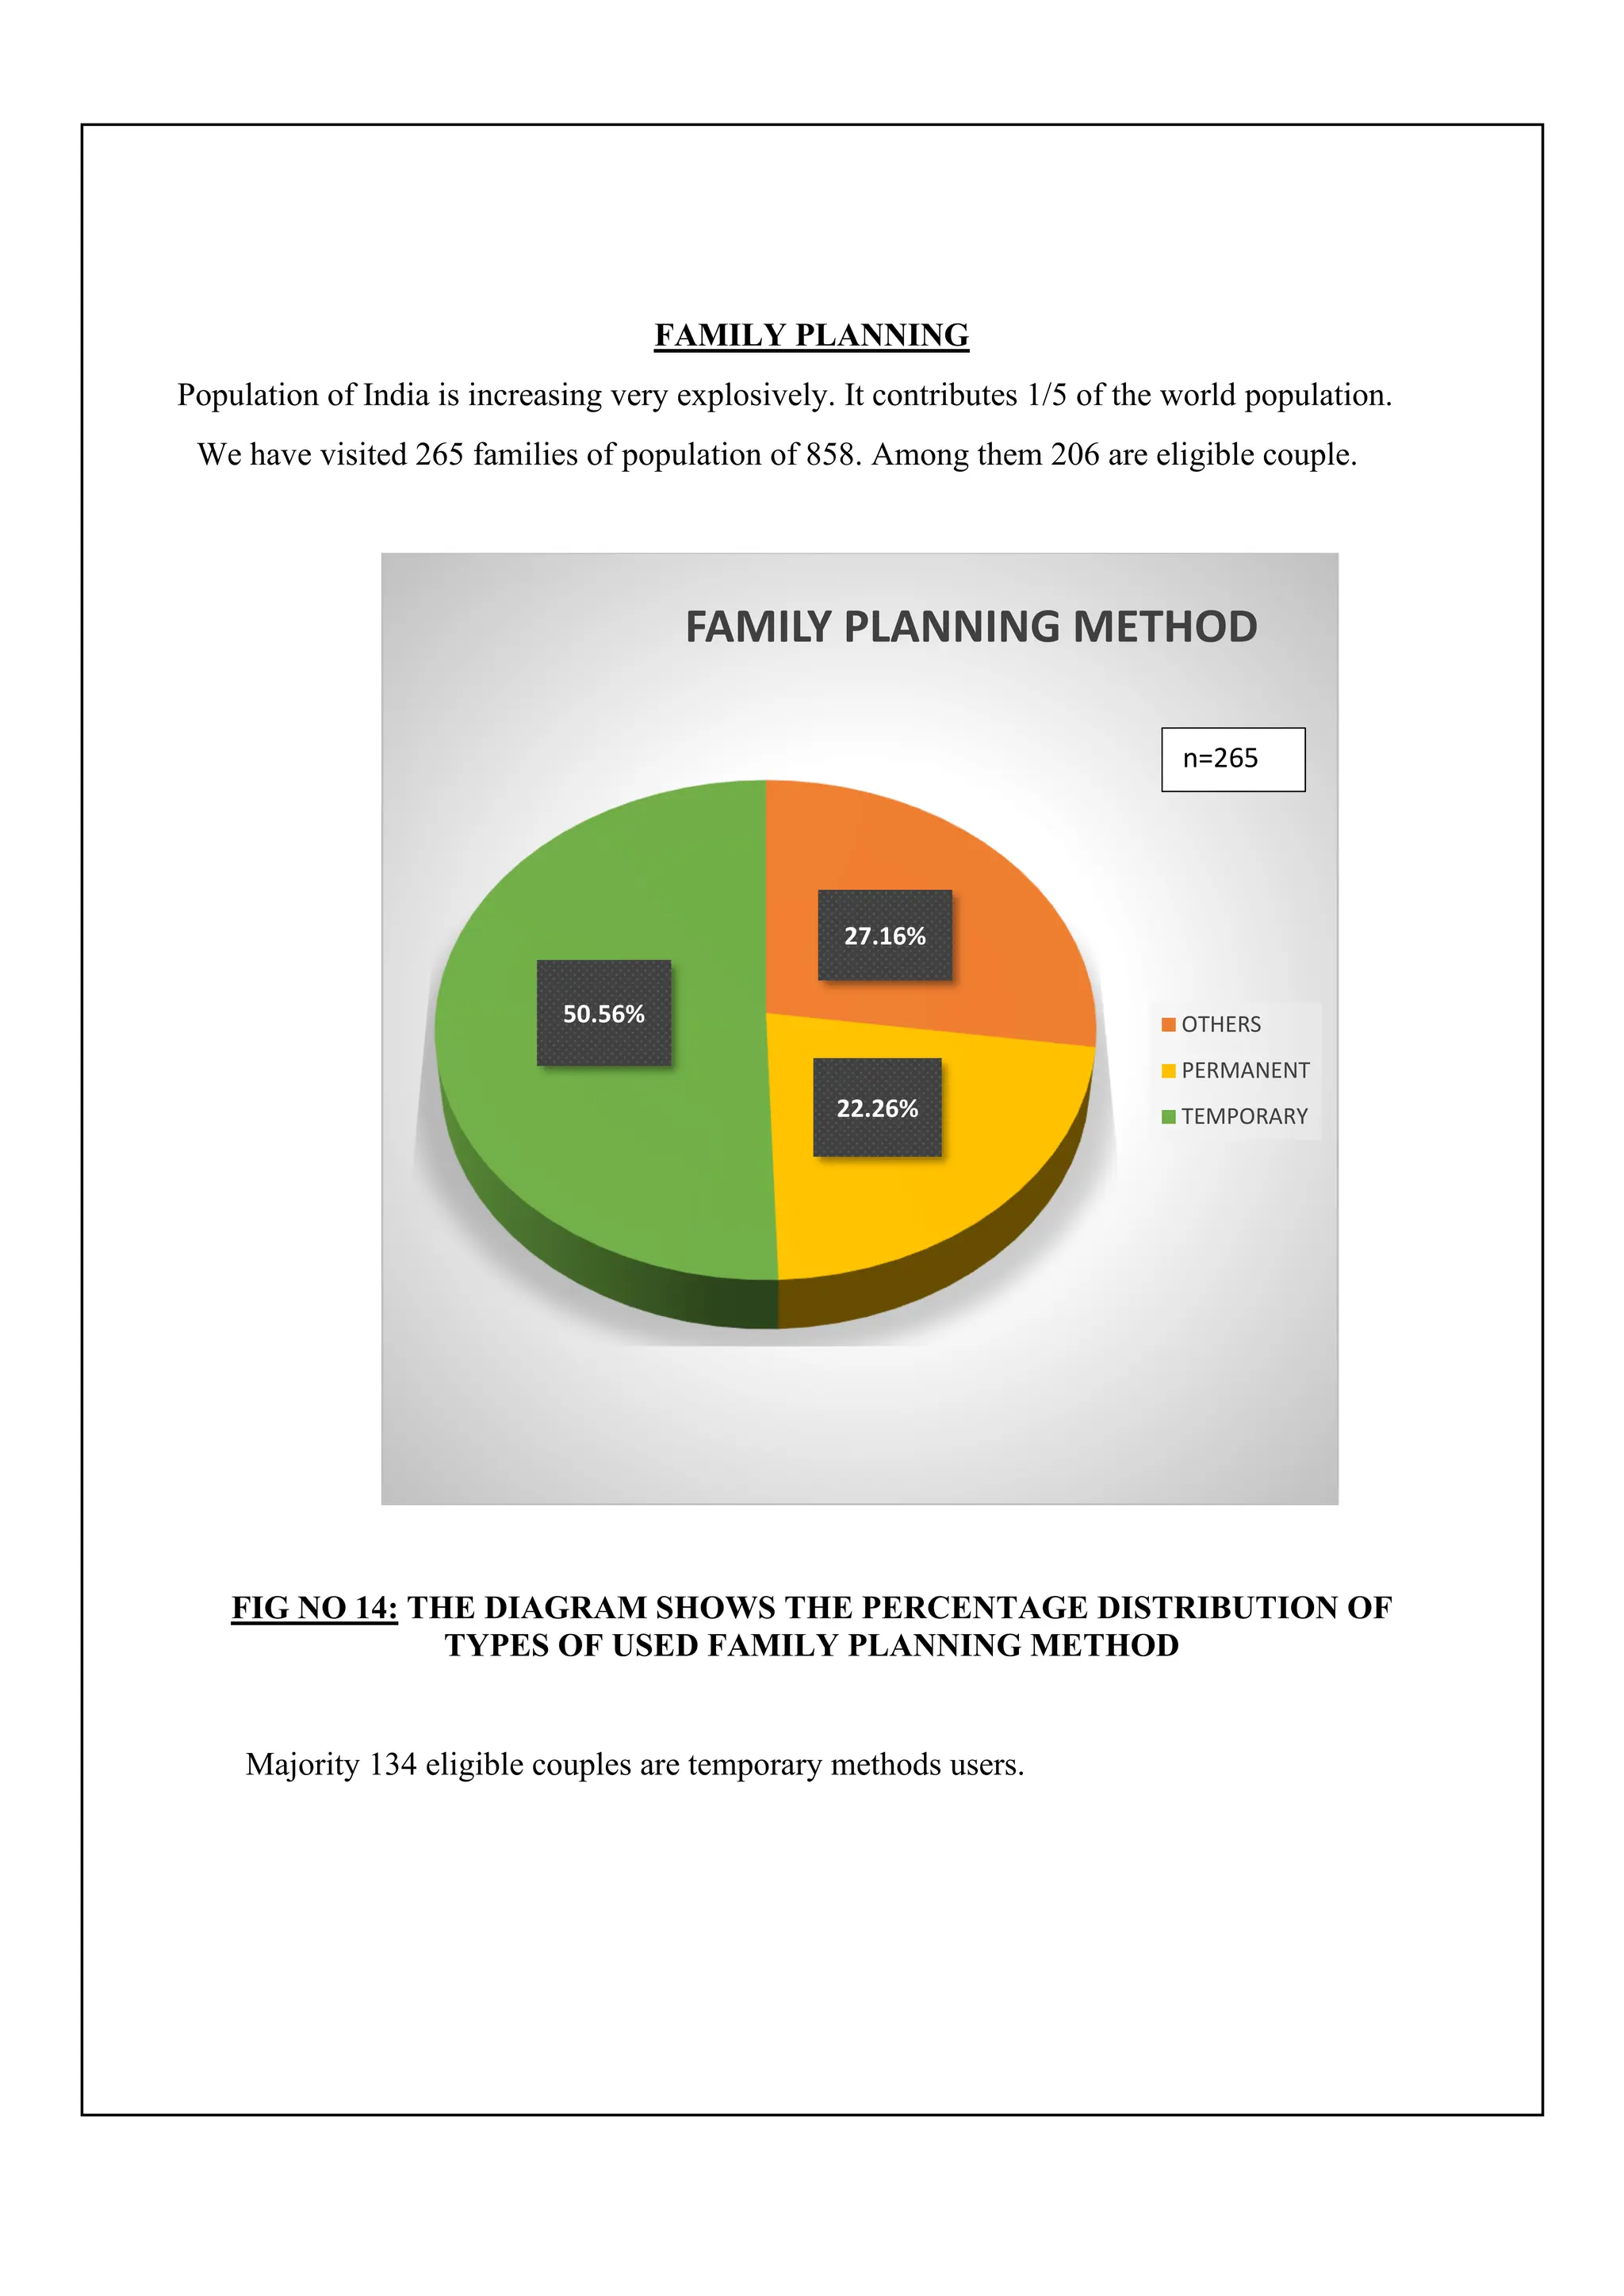
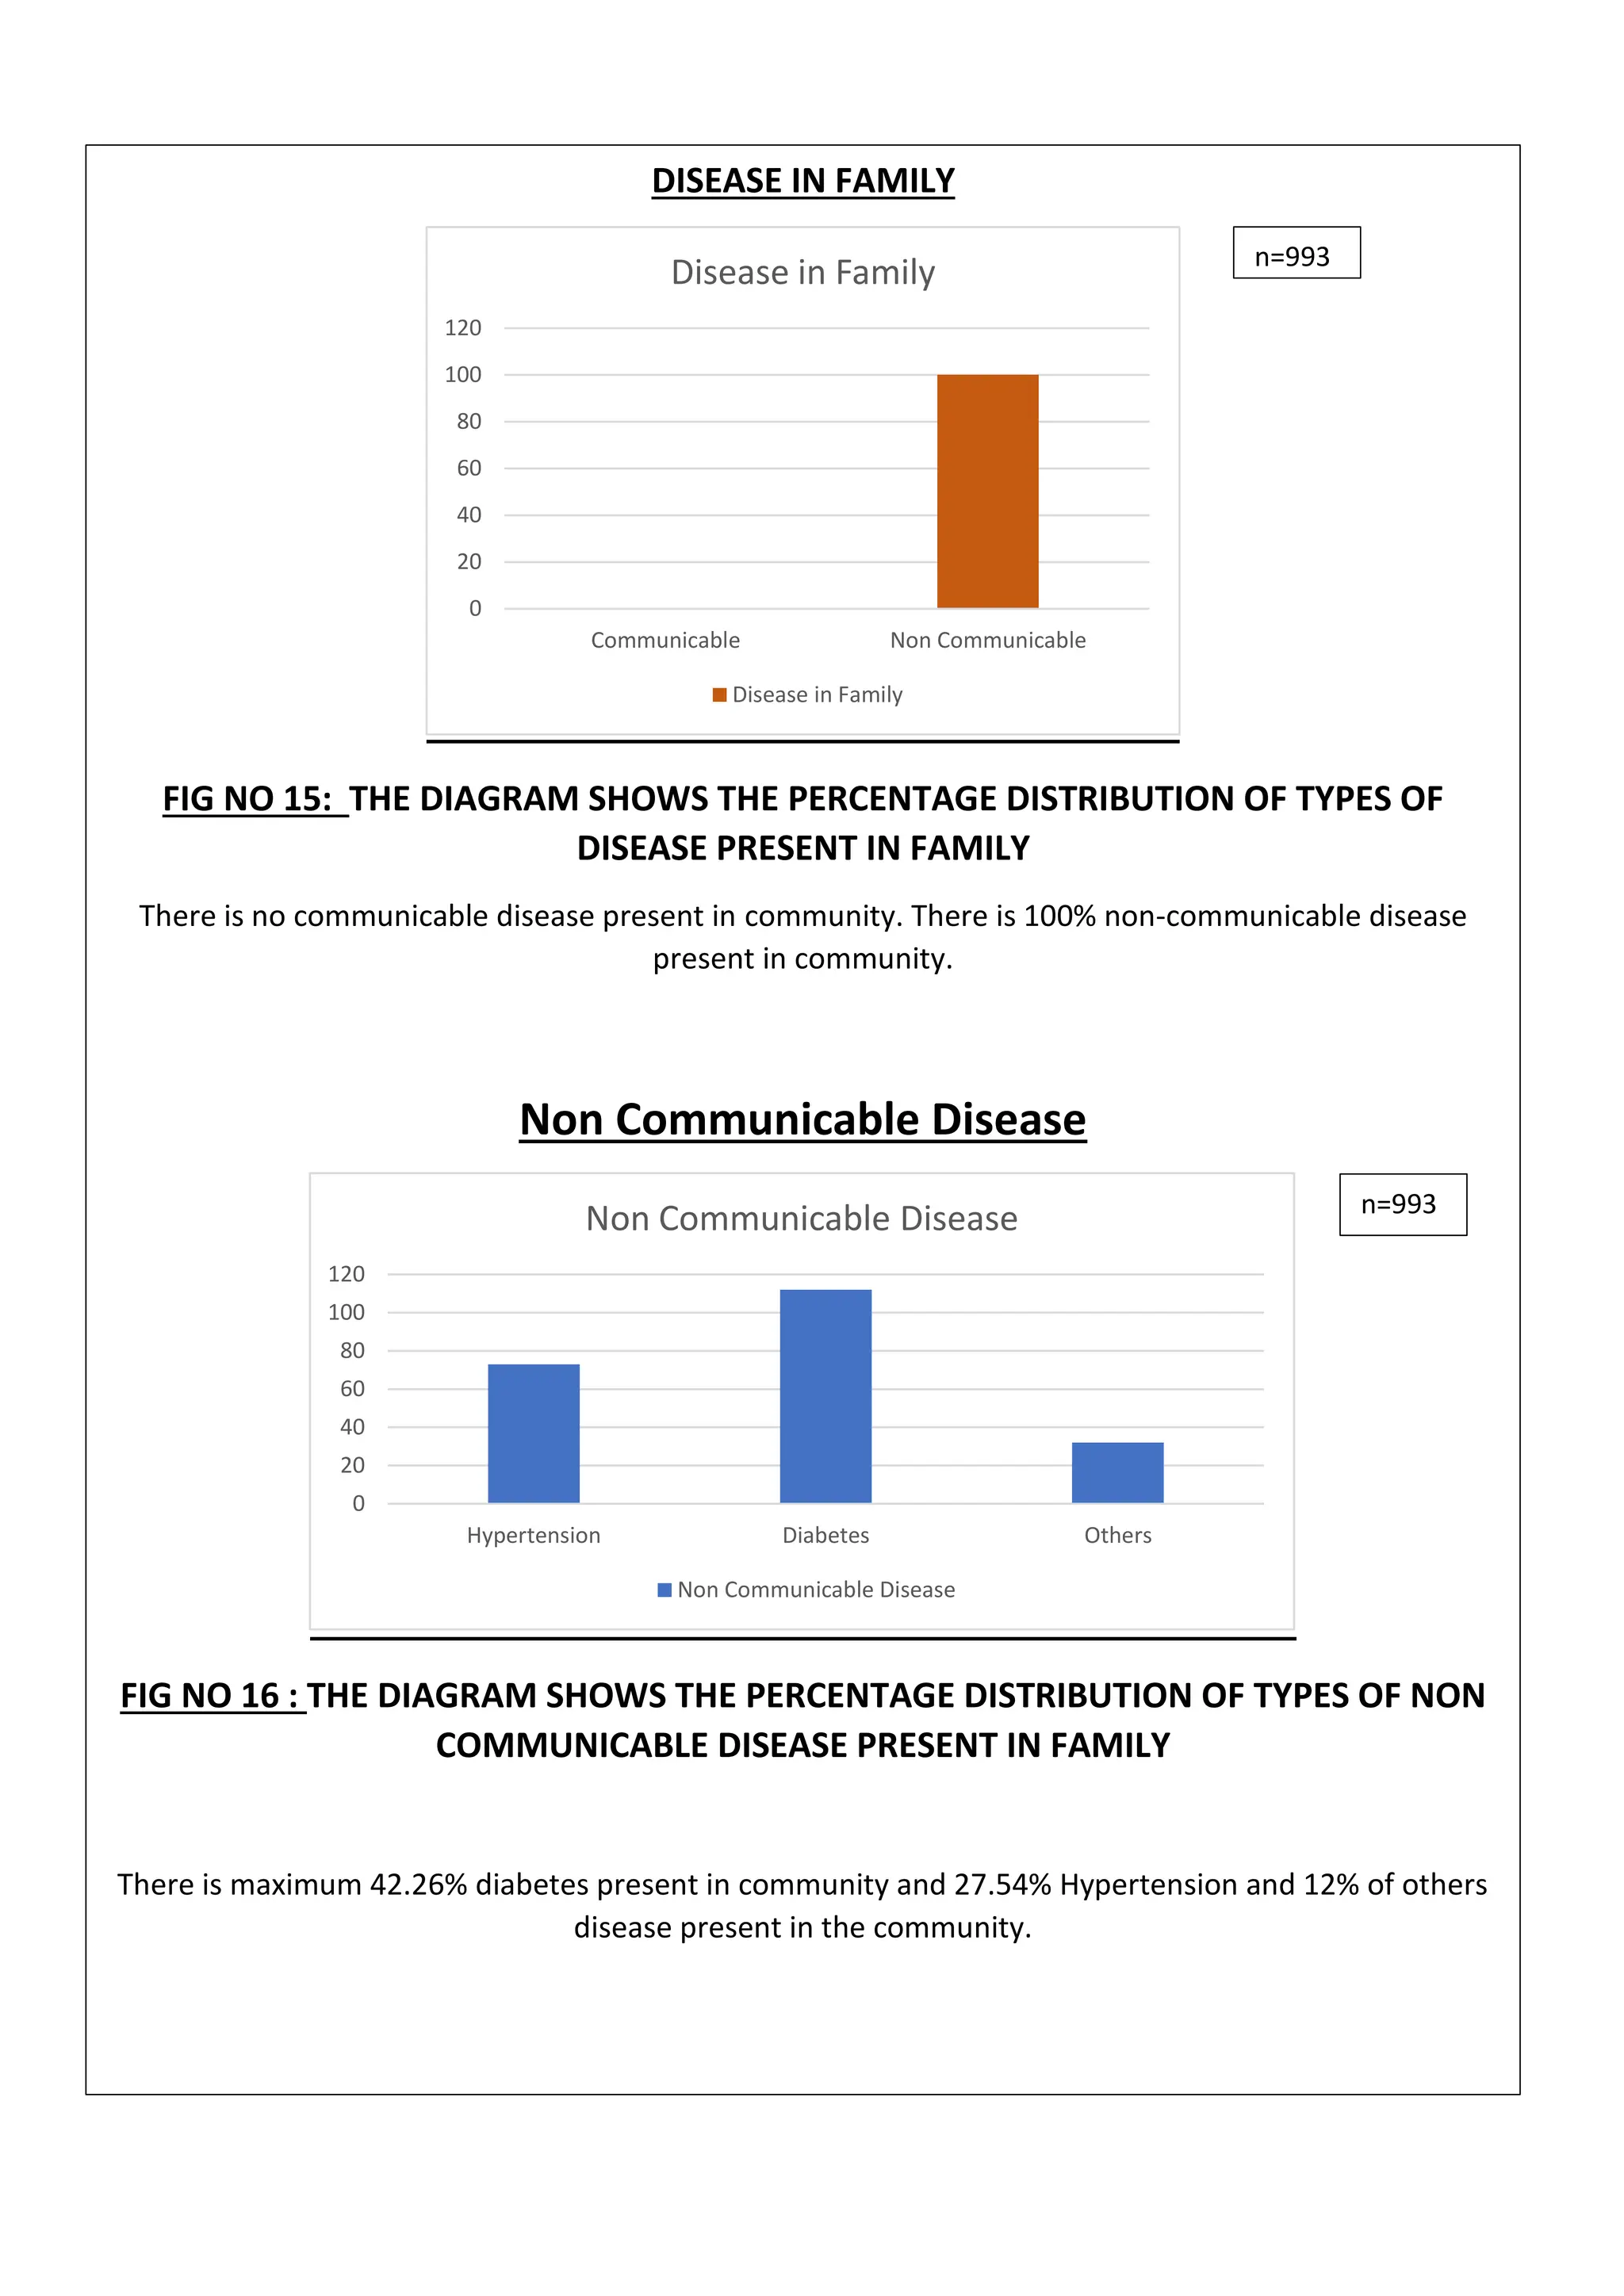
Survey
INTRODUCTION: The survey is one of the most important aspects of community health
services to identify distribution, frequency and determinants of health-related events in the
community. Health surveys help in assessing the community and making community
diagnosis. Health services in the home require technical skill, knowledge of preventive,
promotive measures, technical ability, and a full understanding in human relation.
We 53 3rd
year GNM students of School of Nursing, Medical College
and Hospital, kol-73, were assigned for community experience in urban community in the
month ofJanuary. We have surveyed the Arpuli lane,ward no-40 & 48 (kanaidhar lane,Sri
Gopal Mullick Lane, Madhu Gupta Lane, Radhanat Mullick Lane, Chhutor Para Lane, Harish
Sikdar Path)Kolkata-12,West Bengal.
OBJECTIVES:
• To Identify the geographical area of the community.
• To establish working relationship with the community people.
• To collect information regarding the socio-economic condition of the community.
• To observe the family and assess the health problems of the community people.
• To identify available community resources.
• To provide need base care to the community people.
• To maintain records and prepare community profile.
METHODS:
• Questioning
• Health assessment
• Record Review
• Observation.
DURATION:
Month of January 15th
,2024
To
Month of January 28th
,2024
AREA ORIENTATION
Area orientation is a pictorial presentation of the organized area for the purpose of gaining
experience in the urban community. For this purpose, we have surveyed the total area of
the Arpuli lane, ward no-48(,kanaidhar lane, ,Sri Gopal Mullick Lane, Madhu Gupta Lane,
Radhanat Mullick Lane, Chhutor Para Lane, Harish Sikdar Path)Kolkata-12,West Bengal.
LOCATION:
Our assigned area is Arpuli lane,ward no-40 & 48(kanaidhar lane,Sri Gopal
Mullick Lane, Madhu Gupta Lane, Radhanath Mullick Lane, Chhutor Para Lane, Harish
Sikdar Path)Kolkata-12,West Bengal.
ECONOMIC ORGANIZATION:
Many ATMs and bank facilities are present in the locality.
RECREATION FACILITY:
One playground and club are present in the locality.
OTHER FACILITIES:
• Many grocery shops are present in the urban.
• Many medicine shops is present.
• Many temples are present.
Demographic variables: Total Population of locality – 5236
We have worked on 265 families including 993 population at the Arpuli lane,ward no -40 &
48(Kanaidhar lane,Sri Gopal Mullick Lane, Madhu Gupta Lane, Radhanath Mullick Lane,
Chhutor Para Lane, Harish Sikdar Path)Kolkata-12,West Bengal.
DEMOGRAPHIC CHARACTERISTICS
The characteristics and attributes of the population are called demographic variable.
Community medicine is vitally concern with population because health status in the group
depends upon the dynamic relationship between the number of people. The space which they
occupied and skill that they have acquired in providing their needs.
So, health information system is population based. The house visit was concerned in the
families.
POPULATION DISTRIBUTION:
n=993
FIG NO 1: The population pyramid shows the percentage distribution according to age
and sex.
On age distribution of the world’s population sex and age distribution shows that less
developed countries have significantly younger population than more developed countries.
Globally, about 26% of the world population is under 15 years of age whereas surveyed area
16.05% is under the age of 15 years. 9% of the world’s population is over 64 years of age
whereas in our surveyed areas 10.48% is over the age of 64 years. This gap is much closer
with World’s population and our surveyed areas. Figure 1 (Population Pyramid): reveals that
the maximum population of male lies 55-59 years age group and of female it lies >65 years
age. Minimum population of male lies between 0-4 years age group and of female it lies 0-4
years age group.
5.34%
3.73%
5.74%
3.32%
4.63%
3.32%
2.42%
3.42%
4.33%
4.73%
3.32%
3.32%
2.11%
0.7%
5.14%
2.42%
4.83%
4.93%
4.53%
3.73%
5.04%
3.22%
4.83%
3.83%
2.82%
2.01%
1.31%
0.91%
>65 60 - 64 55 - 59 50 - 54 45 - 49 40 - 44 35 - 39 30 - 34 25 - 29 20 - 24 15 - 19 10. - 14 05 - 09. 0- 4
POPULATION
Male Female
EDUCATIONAL STATUS
Education is a crucial element in economic and social development. Spread of literacy is
generally associated with modernization, Urbanization, Industrialization, communication and
commerce. We consider the criteria of age of literacy according to 2011census i.e., 7 years
and above.
✓ Illiterate means who cannot read and write.
✓ Primary education means who are studying class I to IV.
✓ Middle school education means who are studying class V to VIII.
✓ Madhyamik Education means who are studying class IX to X.
✓ Higher secondary Education means who are studying XI to XII
✓ Graduate Education means who are achieving bachelor degree in any
batch.
FIG NO 2: The Bar diagram shows the percentage distribution of male and female according
to educational status.
Maximum 24.78% of male and 15.41% of female having Graduation Degree, minimum 0.5%
of male and 1.81% of females are illiterate. 2.32% of male and 2.82% of female are having
primary education, 4.53% of male and 7.25% of female are having Madhyamik education,
12.12% of male and 11.88% of female are having HS education.
Illiterate Pre
Primary
Primary Middle
school
Secondary H.S. Graduation
and above
Others
0.5%
0.81%
2.32%
4.64% 4.53%
12.12%
24.78%
0.4%
1.81% 1.11%
2.82%
7.35% 7.25%
11.88%
15.41%
0.3%
EDUCATION
MALE FEMALE
n=993
OCCUPATION
Occupation is the useful measure of social differentiation particularly in communities highly
industrialized and urbanized. In our rural community experience, we visited 265 families.
In this report we excluded the population below 14 years old.
Here unemployed are considered as –
Person who are not engaged in any occupation.
Here others are considered as –
Housewives and older people.
Therefore, the population include are 993. Among them males are 516and females are 477.
Students are not included in the occupational category.
FIG NO 3 : THE BAR DIAGRAM THE PERCENTAGE DISTRIBUTION OF MALE
AND FEMALE ACCORDING TO OCCUPATION.
We got maximum 14.8% of male as service man and maximum 21.85% of female as
unemployed. We got minimum 1.20% population are unemployed & 0.3% of female as
labours. 12.59% of male and 1.01% of female are in business.1.21% of male and 21.85% of
female are unemployed. 14.8%of male and 5.53% of female are in service of occupation.
0
50
100
150
200
250
Student Unemployed Labour cultivator business service retired
Chart Title
Male Female
n=993
ECONOMICAL STATUS
Economy is the large set of inter-related production and consumption activities that aid in
determining how scarce resources are allocated. We visited 265 families and 993 of
population. The per capita GNP (Gross National Products) is the most quietly accepted major
and general economic performance.
FIG NO 4: THE BAR DIAGRAM SHOWS THE PERCENTAGE
DISTRIBUTION OF ECNOMICAL STATUS ACCORDING TO PER CAPITA
INCOME.
The maximum families per capita is RS 6574 and above (82.3%). 12.8% of families per
capita income is RS. 3287-6573.
FIG NO 5: THE PIE DIAGRAM SHOWS THE PERCENTAGE DISTRIBUTION
ACCORDING TO STATE OF INCOME.
The maximum number (79.25%) of families saves and 20.75% of families can manage.
>6574 3287-6573 1972-3286 986-1971 <985
82.3%
12.8%
2.64% 1.51% 0.75%
ECONOMICAL STATUS
Economy
SAVES MANAGES DEBIT
n=265
n=265
265=2
65
TYPES OF FAMILY
Family is a fundamental and universal social institution where our basic needs are met and is
the first school of every individual who live together in some household.
There are two types of family which are as follows –
1. Nuclear Family
2. Joint Family
FIG NO 6: THE PIE DIAGRAM SHOWS THE PERCENTAGE DISTRIBUTION
ACCORDING TO TYPES OF FAMILY.
INTERPRETATION:
The most of the peoples 71.70% belong to nuclear family and 28.30% belongs to joint
families.
ENVIORONMENTAL SANITATION
TYPE OF HOUSE
We have been oriented to the environmental condition of our area in the Arpuli lane,
kanaidhar lane,ward no.-40&48,Kolkata-12,West Bengal.
We visited total 265 families. During our home visit we have collected data according to
types of house e.g., kaccha, pucca and mixed.
FAMILY TYPE
NUCLEAR JOINT OTHERS
n=265
FIG NO 7: THE BAR DIAGRAM SHOWS THE PERCENTAGE DISTRIBUTION
ACCORDING TO THE TYPES OF HOUSES.
From the above diagram we came to conclusion that maximum people 98.5%reside in pucca
house and minimum people 1.50% reside in mixed house.
SOURCE OF LIGHTING
Lighting is one of the major elements to avoid any injury in daily lives, to avoid reading in
dim
light which affects vision.
so, we also collected the data regarding the source of light in our assigned area. We visited
265
families and found that all the families having electricity.
VENTILATION
The modern concept of ventilation implies not only the replacement of ventilated air by
supply
of fresh outdoor air but also control of incoming air with regard to its temperature, humidity,
purity with a view to provide a thermal environment that is comfortable and free from risk of
Types of house
Kaccha Pucca Mixed
n=265
infection. The quality of ventilation in the houses we visited is classified into adequate and
inadequate category.
FIG NO 8: THE DIAGRAM SHOWS THE PERCENTAGE DISTRIBUTION
ACCORDING TO THE TYPES OF VENTILATION.
The diagram represents almost all people live in a well-ventilated house i.e., 93.2% and 6.8%
of people live in inadequate ventilation home.
WATER SUPPLY
In the developing countries much, ill health can be traced due to lack of safe and wholesome
water supply. Water that is easily accessible adequate in quality, free from contamination is
considered to be the safe drinking water.
FIG NO 9: THE DIAGRAM SHOWS THE PERCENTAGE DISTRIBUTION OF
WATER SUPPLY.
From the above figure it reveals that most of the people use drinking water from tube well
i.e., 1.89% and 98.11% drink water from tap water.
VENTILATION
ADEQUATE INADEQUATE
Water supply
Tap water Tube well
n=265
n=265
WASTE DISPOSAL
Improper waste disposal is the disposal of waste in a way that has negative consequences for
the environment. Some waste will eventually rot, but not all, and in the process, it may smell,
or generate methane gas.
Disposal of waste in the area we visited is very insanitary and unhygienic.
FIG NO 10: THE DIAGRAM SHOWS THE PERCENTAGE DISTRIBUTION
ACCORDING TO THE WASTE DISPOSAL.
From the above diagram, it reveals that maximum people, i.e., 98.11% use Municipal
corporation method of waste disposal except 1.89% use manure pit.
TOILET FACILITY
Toilet facility is the hygienic means of promoting health with the hazards of wastes as well as
the treatment and proper disposal of sewage or waste water. In this area we got that almost all
the people use sanitary toilet except one family use dug well.
0
50
100
150
200
250
300
DUMPING BURNING MANURE PIT
WASTE DISPOSAL
Column1 Column2 Column3
n=265
KITCHEN
We also collected data according to the type of kitchen among the visited families of 100.
there are mainly 2 types of kitchens, separate and non-separate.
FIG NO 12: THE PIE DIAGRAM SHOWS THE PERCENTAGE DISTRIBUTION
ACCORDING TO KITCHEN CONDITION
From the above diagram it reveals that 76.98% people have separate kitchen and 23.02%
people use non-separate kitchen.
FOOD HABIT
Nutrition is an essential process. The balance diet should be maintained to maintain the
normal physiological function of our body.
We visited total 265 families where population is 993.
76.98%
23.02%
KITCHEN TYPE
SEPARATE NON SEPARATE
n=265
FIG NO 13: THE DIAGRAM SHOWS THE PERCENTAGE DISTRIBUTION
ACCORDING TO THE NUTRITIONAL STATUS.
From the above diagram it reveals that maximum 99.15% of families are non-
vegetarian,0.85% are vegetarian.
IMMUNIZATION STATUS
Prevention is better than cure. Some communicable diseases can be prevented by vaccination.
We have visited 265 families in Arpuli lane, kanaidhar lane, ward no.-48, Kolkata-12, West
Bengal, where total no. of children in the age group of 0-5 years are 28. Among them 14 are
male and 14 are female.
Here, totally immunized means who has completed primary immunization up to their age.
We have got 100% totally immunized children.
.85%
NUTRITIONAL STATUS
99.15%
Sales
Complete Incomplete
Vegetarian Non-Vegetarian
n=265
n=265
FAMILY PLANNING
Population of India is increasing very explosively. It contributes 1/5 of the world population.
We have visited 265 families of population of 858. Among them 206 are eligible couple.
FIG NO 14: THE DIAGRAM SHOWS THE PERCENTAGE DISTRIBUTION OF
TYPES OF USED FAMILY PLANNING METHOD
Majority 134 eligible couples are temporary methods users.
27.16%
22.26%
50.56%
FAMILY PLANNING METHOD
OTHERS
PERMANENT
TEMPORARY
n=265
DISEASE IN FAMILY
FIG NO 15: THE DIAGRAM SHOWS THE PERCENTAGE DISTRIBUTION OF TYPES OF
DISEASE PRESENT IN FAMILY
There is no communicable disease present in community. There is 100% non-communicable disease
present in community.
Non Communicable Disease
FIG NO 16 : THE DIAGRAM SHOWS THE PERCENTAGE DISTRIBUTION OF TYPES OF NON
COMMUNICABLE DISEASE PRESENT IN FAMILY
There is maximum 42.26% diabetes present in community and 27.54% Hypertension and 12% of others
disease present in the community.
0
20
40
60
80
100
120
Communicable Non Communicable
Disease in Family
Disease in Family
0
20
40
60
80
100
120
Hypertension Diabetes Others
Non Communicable Disease
n=993
n=993
CONCLUSION
So, now we have reached the end of report of our various functions.
We GNM Nursing 3rd year students of Medical College & Hospital, Kolkata have given real
figures to our dreams i.e., of performing very valuable programme like health talks and
showing chart & posters where participation is done by all of us.
We made home visit to identify problem and to provide problem-based education and
care. We learned about the community people’s problems, their lifestyle etc, which helps us
to
enrich our community knowledge.
SIGNATURE OF SISTER TUTOR SIGNATURE OF STUDENT

3rd year urban compilation final 2.pdf for third year GNM students

  • 1.
    Survey INTRODUCTION: The surveyis one of the most important aspects of community health services to identify distribution, frequency and determinants of health-related events in the community. Health surveys help in assessing the community and making community diagnosis. Health services in the home require technical skill, knowledge of preventive, promotive measures, technical ability, and a full understanding in human relation. We 53 3rd year GNM students of School of Nursing, Medical College and Hospital, kol-73, were assigned for community experience in urban community in the month ofJanuary. We have surveyed the Arpuli lane,ward no-40 & 48 (kanaidhar lane,Sri Gopal Mullick Lane, Madhu Gupta Lane, Radhanat Mullick Lane, Chhutor Para Lane, Harish Sikdar Path)Kolkata-12,West Bengal. OBJECTIVES: • To Identify the geographical area of the community. • To establish working relationship with the community people. • To collect information regarding the socio-economic condition of the community. • To observe the family and assess the health problems of the community people. • To identify available community resources. • To provide need base care to the community people. • To maintain records and prepare community profile. METHODS: • Questioning • Health assessment • Record Review • Observation. DURATION: Month of January 15th ,2024 To Month of January 28th ,2024
  • 2.
    AREA ORIENTATION Area orientationis a pictorial presentation of the organized area for the purpose of gaining experience in the urban community. For this purpose, we have surveyed the total area of the Arpuli lane, ward no-48(,kanaidhar lane, ,Sri Gopal Mullick Lane, Madhu Gupta Lane, Radhanat Mullick Lane, Chhutor Para Lane, Harish Sikdar Path)Kolkata-12,West Bengal. LOCATION: Our assigned area is Arpuli lane,ward no-40 & 48(kanaidhar lane,Sri Gopal Mullick Lane, Madhu Gupta Lane, Radhanath Mullick Lane, Chhutor Para Lane, Harish Sikdar Path)Kolkata-12,West Bengal. ECONOMIC ORGANIZATION: Many ATMs and bank facilities are present in the locality. RECREATION FACILITY: One playground and club are present in the locality. OTHER FACILITIES: • Many grocery shops are present in the urban. • Many medicine shops is present. • Many temples are present. Demographic variables: Total Population of locality – 5236 We have worked on 265 families including 993 population at the Arpuli lane,ward no -40 & 48(Kanaidhar lane,Sri Gopal Mullick Lane, Madhu Gupta Lane, Radhanath Mullick Lane, Chhutor Para Lane, Harish Sikdar Path)Kolkata-12,West Bengal. DEMOGRAPHIC CHARACTERISTICS The characteristics and attributes of the population are called demographic variable. Community medicine is vitally concern with population because health status in the group depends upon the dynamic relationship between the number of people. The space which they occupied and skill that they have acquired in providing their needs. So, health information system is population based. The house visit was concerned in the families.
  • 3.
    POPULATION DISTRIBUTION: n=993 FIG NO1: The population pyramid shows the percentage distribution according to age and sex. On age distribution of the world’s population sex and age distribution shows that less developed countries have significantly younger population than more developed countries. Globally, about 26% of the world population is under 15 years of age whereas surveyed area 16.05% is under the age of 15 years. 9% of the world’s population is over 64 years of age whereas in our surveyed areas 10.48% is over the age of 64 years. This gap is much closer with World’s population and our surveyed areas. Figure 1 (Population Pyramid): reveals that the maximum population of male lies 55-59 years age group and of female it lies >65 years age. Minimum population of male lies between 0-4 years age group and of female it lies 0-4 years age group. 5.34% 3.73% 5.74% 3.32% 4.63% 3.32% 2.42% 3.42% 4.33% 4.73% 3.32% 3.32% 2.11% 0.7% 5.14% 2.42% 4.83% 4.93% 4.53% 3.73% 5.04% 3.22% 4.83% 3.83% 2.82% 2.01% 1.31% 0.91% >65 60 - 64 55 - 59 50 - 54 45 - 49 40 - 44 35 - 39 30 - 34 25 - 29 20 - 24 15 - 19 10. - 14 05 - 09. 0- 4 POPULATION Male Female
  • 4.
    EDUCATIONAL STATUS Education isa crucial element in economic and social development. Spread of literacy is generally associated with modernization, Urbanization, Industrialization, communication and commerce. We consider the criteria of age of literacy according to 2011census i.e., 7 years and above. ✓ Illiterate means who cannot read and write. ✓ Primary education means who are studying class I to IV. ✓ Middle school education means who are studying class V to VIII. ✓ Madhyamik Education means who are studying class IX to X. ✓ Higher secondary Education means who are studying XI to XII ✓ Graduate Education means who are achieving bachelor degree in any batch. FIG NO 2: The Bar diagram shows the percentage distribution of male and female according to educational status. Maximum 24.78% of male and 15.41% of female having Graduation Degree, minimum 0.5% of male and 1.81% of females are illiterate. 2.32% of male and 2.82% of female are having primary education, 4.53% of male and 7.25% of female are having Madhyamik education, 12.12% of male and 11.88% of female are having HS education. Illiterate Pre Primary Primary Middle school Secondary H.S. Graduation and above Others 0.5% 0.81% 2.32% 4.64% 4.53% 12.12% 24.78% 0.4% 1.81% 1.11% 2.82% 7.35% 7.25% 11.88% 15.41% 0.3% EDUCATION MALE FEMALE n=993
  • 5.
    OCCUPATION Occupation is theuseful measure of social differentiation particularly in communities highly industrialized and urbanized. In our rural community experience, we visited 265 families. In this report we excluded the population below 14 years old. Here unemployed are considered as – Person who are not engaged in any occupation. Here others are considered as – Housewives and older people. Therefore, the population include are 993. Among them males are 516and females are 477. Students are not included in the occupational category. FIG NO 3 : THE BAR DIAGRAM THE PERCENTAGE DISTRIBUTION OF MALE AND FEMALE ACCORDING TO OCCUPATION. We got maximum 14.8% of male as service man and maximum 21.85% of female as unemployed. We got minimum 1.20% population are unemployed & 0.3% of female as labours. 12.59% of male and 1.01% of female are in business.1.21% of male and 21.85% of female are unemployed. 14.8%of male and 5.53% of female are in service of occupation. 0 50 100 150 200 250 Student Unemployed Labour cultivator business service retired Chart Title Male Female n=993
  • 6.
    ECONOMICAL STATUS Economy isthe large set of inter-related production and consumption activities that aid in determining how scarce resources are allocated. We visited 265 families and 993 of population. The per capita GNP (Gross National Products) is the most quietly accepted major and general economic performance. FIG NO 4: THE BAR DIAGRAM SHOWS THE PERCENTAGE DISTRIBUTION OF ECNOMICAL STATUS ACCORDING TO PER CAPITA INCOME. The maximum families per capita is RS 6574 and above (82.3%). 12.8% of families per capita income is RS. 3287-6573. FIG NO 5: THE PIE DIAGRAM SHOWS THE PERCENTAGE DISTRIBUTION ACCORDING TO STATE OF INCOME. The maximum number (79.25%) of families saves and 20.75% of families can manage. >6574 3287-6573 1972-3286 986-1971 <985 82.3% 12.8% 2.64% 1.51% 0.75% ECONOMICAL STATUS Economy SAVES MANAGES DEBIT n=265 n=265 265=2 65
  • 7.
    TYPES OF FAMILY Familyis a fundamental and universal social institution where our basic needs are met and is the first school of every individual who live together in some household. There are two types of family which are as follows – 1. Nuclear Family 2. Joint Family FIG NO 6: THE PIE DIAGRAM SHOWS THE PERCENTAGE DISTRIBUTION ACCORDING TO TYPES OF FAMILY. INTERPRETATION: The most of the peoples 71.70% belong to nuclear family and 28.30% belongs to joint families. ENVIORONMENTAL SANITATION TYPE OF HOUSE We have been oriented to the environmental condition of our area in the Arpuli lane, kanaidhar lane,ward no.-40&48,Kolkata-12,West Bengal. We visited total 265 families. During our home visit we have collected data according to types of house e.g., kaccha, pucca and mixed. FAMILY TYPE NUCLEAR JOINT OTHERS n=265
  • 8.
    FIG NO 7:THE BAR DIAGRAM SHOWS THE PERCENTAGE DISTRIBUTION ACCORDING TO THE TYPES OF HOUSES. From the above diagram we came to conclusion that maximum people 98.5%reside in pucca house and minimum people 1.50% reside in mixed house. SOURCE OF LIGHTING Lighting is one of the major elements to avoid any injury in daily lives, to avoid reading in dim light which affects vision. so, we also collected the data regarding the source of light in our assigned area. We visited 265 families and found that all the families having electricity. VENTILATION The modern concept of ventilation implies not only the replacement of ventilated air by supply of fresh outdoor air but also control of incoming air with regard to its temperature, humidity, purity with a view to provide a thermal environment that is comfortable and free from risk of Types of house Kaccha Pucca Mixed n=265
  • 9.
    infection. The qualityof ventilation in the houses we visited is classified into adequate and inadequate category. FIG NO 8: THE DIAGRAM SHOWS THE PERCENTAGE DISTRIBUTION ACCORDING TO THE TYPES OF VENTILATION. The diagram represents almost all people live in a well-ventilated house i.e., 93.2% and 6.8% of people live in inadequate ventilation home. WATER SUPPLY In the developing countries much, ill health can be traced due to lack of safe and wholesome water supply. Water that is easily accessible adequate in quality, free from contamination is considered to be the safe drinking water. FIG NO 9: THE DIAGRAM SHOWS THE PERCENTAGE DISTRIBUTION OF WATER SUPPLY. From the above figure it reveals that most of the people use drinking water from tube well i.e., 1.89% and 98.11% drink water from tap water. VENTILATION ADEQUATE INADEQUATE Water supply Tap water Tube well n=265 n=265
  • 10.
    WASTE DISPOSAL Improper wastedisposal is the disposal of waste in a way that has negative consequences for the environment. Some waste will eventually rot, but not all, and in the process, it may smell, or generate methane gas. Disposal of waste in the area we visited is very insanitary and unhygienic. FIG NO 10: THE DIAGRAM SHOWS THE PERCENTAGE DISTRIBUTION ACCORDING TO THE WASTE DISPOSAL. From the above diagram, it reveals that maximum people, i.e., 98.11% use Municipal corporation method of waste disposal except 1.89% use manure pit. TOILET FACILITY Toilet facility is the hygienic means of promoting health with the hazards of wastes as well as the treatment and proper disposal of sewage or waste water. In this area we got that almost all the people use sanitary toilet except one family use dug well. 0 50 100 150 200 250 300 DUMPING BURNING MANURE PIT WASTE DISPOSAL Column1 Column2 Column3 n=265
  • 11.
    KITCHEN We also collecteddata according to the type of kitchen among the visited families of 100. there are mainly 2 types of kitchens, separate and non-separate. FIG NO 12: THE PIE DIAGRAM SHOWS THE PERCENTAGE DISTRIBUTION ACCORDING TO KITCHEN CONDITION From the above diagram it reveals that 76.98% people have separate kitchen and 23.02% people use non-separate kitchen. FOOD HABIT Nutrition is an essential process. The balance diet should be maintained to maintain the normal physiological function of our body. We visited total 265 families where population is 993. 76.98% 23.02% KITCHEN TYPE SEPARATE NON SEPARATE n=265
  • 12.
    FIG NO 13:THE DIAGRAM SHOWS THE PERCENTAGE DISTRIBUTION ACCORDING TO THE NUTRITIONAL STATUS. From the above diagram it reveals that maximum 99.15% of families are non- vegetarian,0.85% are vegetarian. IMMUNIZATION STATUS Prevention is better than cure. Some communicable diseases can be prevented by vaccination. We have visited 265 families in Arpuli lane, kanaidhar lane, ward no.-48, Kolkata-12, West Bengal, where total no. of children in the age group of 0-5 years are 28. Among them 14 are male and 14 are female. Here, totally immunized means who has completed primary immunization up to their age. We have got 100% totally immunized children. .85% NUTRITIONAL STATUS 99.15% Sales Complete Incomplete Vegetarian Non-Vegetarian n=265 n=265
  • 13.
    FAMILY PLANNING Population ofIndia is increasing very explosively. It contributes 1/5 of the world population. We have visited 265 families of population of 858. Among them 206 are eligible couple. FIG NO 14: THE DIAGRAM SHOWS THE PERCENTAGE DISTRIBUTION OF TYPES OF USED FAMILY PLANNING METHOD Majority 134 eligible couples are temporary methods users. 27.16% 22.26% 50.56% FAMILY PLANNING METHOD OTHERS PERMANENT TEMPORARY n=265
  • 14.
    DISEASE IN FAMILY FIGNO 15: THE DIAGRAM SHOWS THE PERCENTAGE DISTRIBUTION OF TYPES OF DISEASE PRESENT IN FAMILY There is no communicable disease present in community. There is 100% non-communicable disease present in community. Non Communicable Disease FIG NO 16 : THE DIAGRAM SHOWS THE PERCENTAGE DISTRIBUTION OF TYPES OF NON COMMUNICABLE DISEASE PRESENT IN FAMILY There is maximum 42.26% diabetes present in community and 27.54% Hypertension and 12% of others disease present in the community. 0 20 40 60 80 100 120 Communicable Non Communicable Disease in Family Disease in Family 0 20 40 60 80 100 120 Hypertension Diabetes Others Non Communicable Disease Non Communicable Disease n=993 n=993
  • 15.
    CONCLUSION So, now wehave reached the end of report of our various functions. We GNM Nursing 3rd year students of Medical College & Hospital, Kolkata have given real figures to our dreams i.e., of performing very valuable programme like health talks and showing chart & posters where participation is done by all of us. We made home visit to identify problem and to provide problem-based education and care. We learned about the community people’s problems, their lifestyle etc, which helps us to enrich our community knowledge. SIGNATURE OF SISTER TUTOR SIGNATURE OF STUDENT