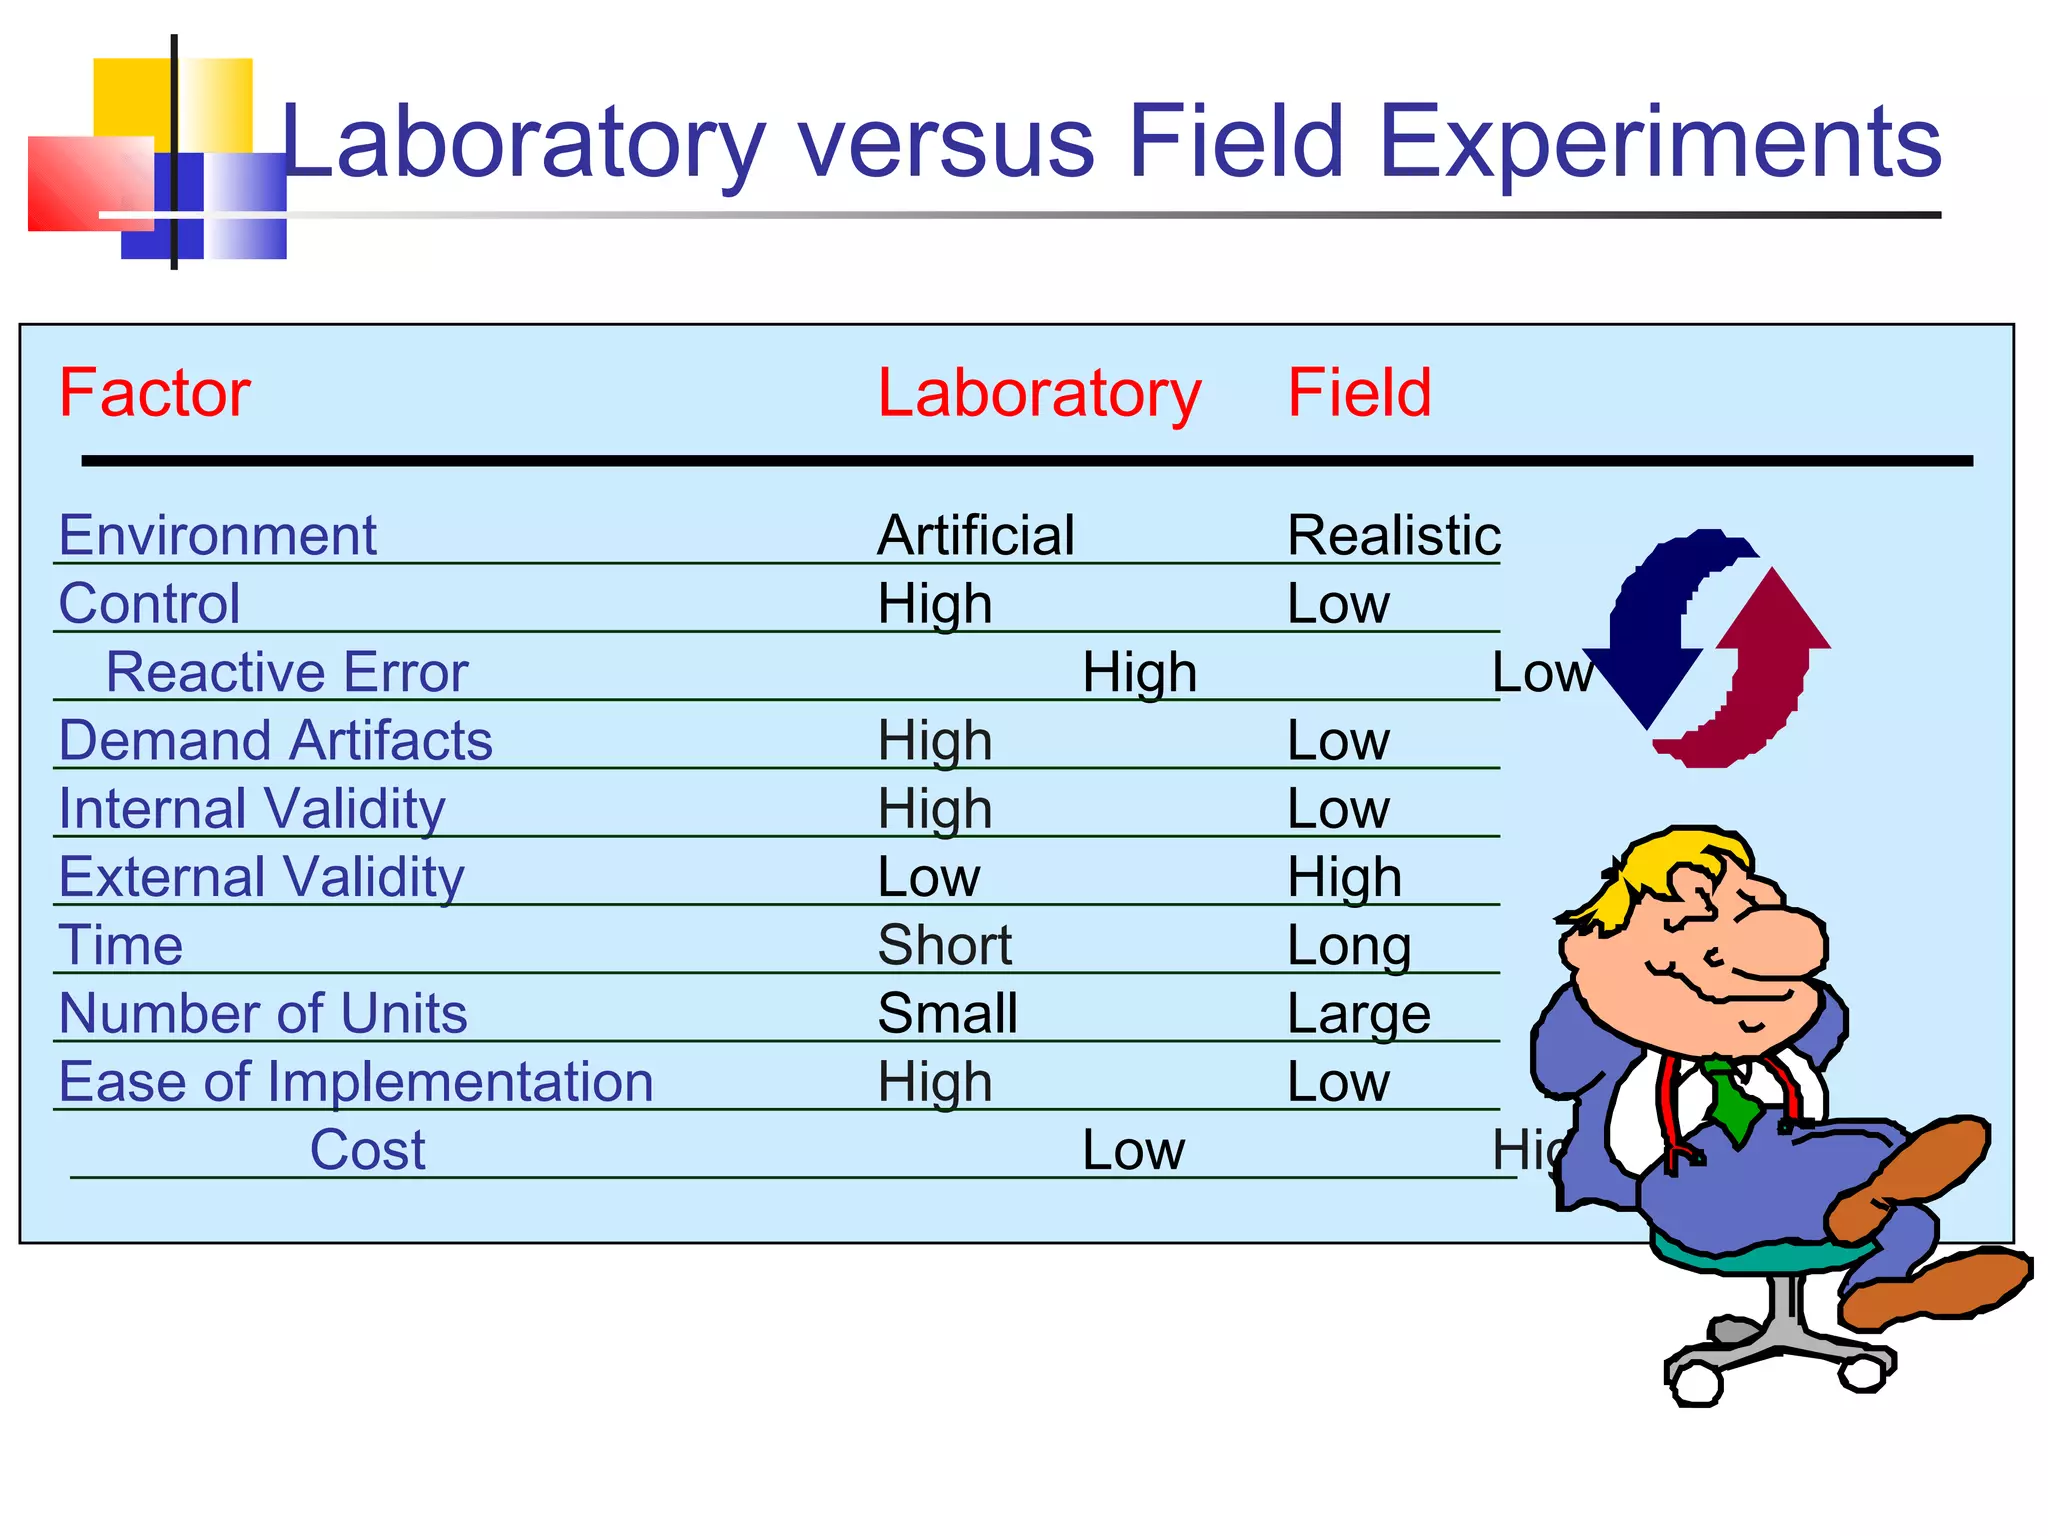
Causal Research Design:
Experimentation
Chapter Outline
1) Overview
2) Concept of Causality
3) Conditions for Causality
4) Definition of Concepts
5) Definition of Symbols
6) Validity in Experimentation
7) Extraneous Variables
8) Controlling Extraneous Variables
9) A Classification of Experimental Designs
10) Pre-experimental Designs
11) True Experimental Designs
Chapter Outline
12) Quasi Experimental Designs
13) Statistical Designs
14) Laboratory vs. Field Experiments
15) Experimental vs. Non-experimental Designs
16) Limitations of Experimentation
17) Summary
18) Key Terms and Concepts
Concept of Causality
A statement such as "X causes Y " will have the
following meaning to an ordinary person and to a
scientist.
____________________________________________________
Ordinary Meaning Scientific Meaning
____________________________________________________
X is the only cause of Y. X is only one of a number
of
possible causes of Y.
X must always lead to Y The occurrence of X
makes the
(X is a deterministic occurrence of Y more probable
cause of Y). (X is a probabilistic cause of Y).
 
It is possible to prove We can never prove that X is a
that X is a cause of Y. cause of Y. At best, we can
Conditions for Causality
 Concomitant variation is the extent to which
a cause, X, and an effect, Y, occur together or
vary together in the way predicted by the
hypothesis under consideration.
 The time order of occurrence condition
states that the causing event must occur either
before or simultaneously with the effect; it cannot
occur afterwards.
 The absence of other possible causal
factors means that the factor or variable being
investigated should be the only possible causal
explanation.
Evidence of Concomitant Variation between
Purchase of Fashion Clothing and Education
High
High Low
363 (73%) 137 (27%)
322 (64%) 178 (36%)
Purchase of Fashion Clothing, Y
500 (100%)
500 (100%)Low
Education,X
Purchase of Fashion Clothing By
Income and Education
Low Income
Purchase
High Low
High
Low
Education
200 (100%)
300 (100%)
300
200
122 (61%)
171 (57%)
78 (39%)
129 (43%)
High Income
Purchase
High
High
Low
Low
241 (80%)
151 (76%)
59 (20%)
49 (24%)
Education
Definitions and Concepts
 Independent variables are variables or
alternatives that are manipulated and whose effects
are measured and compared, e.g., price levels.
 Test units are individuals, organizations, or other
entities whose response to the independent
variables or treatments is being examined, e.g.,
consumers or stores.
 Dependent variables are the variables which
measure the effect of the independent variables on
the test units, e.g., sales, profits, and market
shares.
 Extraneous variables are all variables other than
the independent variables that affect the response
of the test units, e.g., store size, store location, and
competitive effort.
Experimental Design
An experimental design is a set of
procedures specifying
 the test units and how these units are to be
divided into homogeneous subsamples,
 what independent variables or treatments are to
be manipulated,
 what dependent variables are to be measured,
and
 how the extraneous variables are to be
controlled.
Validity in Experimentation
 Internal validity refers to whether the
manipulation of the independent variables
or treatments actually caused the observed
effects on the dependent variables. Control
of extraneous variables is a necessary
condition for establishing internal validity.
 External validity refers to whether the
cause-and-effect relationships found in the
experiment can be generalized. To what
populations, settings, times, independent
variables and dependent variables can the
results be projected?
Extraneous Variables
 History refers to specific events that are external
to the experiment but occur at the same time as the
experiment.
 Maturation (MA) refers to changes in the test
units themselves that occur with the passage of
time.
 Testing effects are caused by the process of
experimentation. Typically, these are the effects on
the experiment of taking a measure on the
dependent variable before and after the
presentation of the treatment.
 The main testing effect (MT) occurs when a
prior observation affects a latter observation.
Extraneous Variables
 In the interactive testing effect (IT), a prior
measurement affects the test unit's response to the
independent variable.
 Instrumentation (I) refers to changes in the
measuring instrument, in the observers or in the
scores themselves.
 Selection bias (SB) refers to the improper
assignment of test units to treatment conditions.
 Mortality (MO) refers to the loss of test units while
the experiment is in progress.
Controlling Extraneous Variables
 Randomization refers to the random assignment
of test units to experimental groups by using
random numbers. Treatment conditions are also
randomly assigned to experimental groups.
 Matching involves comparing test units on a set
of key background variables before assigning them
to the treatment conditions.
 Statistical control involves measuring the
extraneous variables and adjusting for their effects
through statistical analysis.
 Design control involves the use of experiments
designed to control specific extraneous variables.
A Classification of Experimental Designs
 Pre-experimental designs do not
employ randomization procedures to control
for extraneous factors:
 The one-shot case study, the one-group pretest-
posttest design, and the static-group.
 In true experimental designs, the
researcher can randomly assign test units
to experimental groups and treatments to
experimental groups:
 The pretest-posttest control group design, the
posttest-only control group design, and the
Solomon four-group design.
A Classification of Experimental Designs
 Quasi-experimental designs result when
the researcher is unable to achieve full
manipulation of scheduling or allocation of
treatments to test units but can still apply part
of the apparatus of true experimentation:
 Time series and multiple time series designs.
 A Statistical design is a series of basic
experiments that allows for statistical control
and analysis of external variables:
 Randomized block design, Latin square design, and
factorial designs.
A Classification of Experimental Designs
Pre-experimental
One-Shot Case
Study
One Group
Pretest-Posttest
Static Group
True
Experimental
Pretest-Posttest
Control Group
Posttest: Only
Control Group
Solomon Four-
Group
Quasi
Experimental
Time Series
Multiple Time
Series
Statistical
Randomized
Blocks
Latin Square
Factorial
Design
Experimental Designs
One-Shot Case Study
X 01
 A single group of test units is exposed to a
treatment X.
 A single measurement on the dependent
variable is taken (01).
 There is no random assignment of test units.
 The one-shot case study is more appropriate
for exploratory than for conclusive research.
(History, Maturation, Selection & Mortality)
One-Group Pretest-Posttest Design
01 X 02
 A group of test units is measured twice.
 There is no control group.
 The treatment effect is computed as
02 – 01.
 The validity of this conclusion is
questionable since extraneous
variables are largely uncontrolled.
(History, Maturation, Testing, Instrumentation, Selection,
Mortality, & Regression)
Static Group Design
EG: X 01
CG: 02
 A two-group experimental design.
 The experimental group (EG) is exposed to
the treatment, and the control group (CG) is
not.
 Measurements on both groups are made only
after the treatment.
 Test units are not assigned at random.
 The treatment effect would be measured as
01 - 02. (Selection & Mortality)
True Experimental Designs:
Pretest-Posttest Control Group Design
EG: R 01 X 02
CG: R 03 04
 Test units are randomly assigned to either the experimental or
the control group.
 A pretreatment measure is taken on each group.
 The treatment effect (TE) is measured as:(02 - 01) - (04 - 03).
 Selection bias is eliminated by randomization.
 The other extraneous effects are controlled as follows:
02 – 01= TE + H + MA + MT + IT + I + SR + MO
04 – 03= H + MA + MT + I + SR + MO
= EV (Extraneous Variables)
 The experimental result is obtained by:
(02 - 01) - (04 - 03) = TE + IT
 Interactive testing effect is not controlled.
Posttest-Only Control Group Design
EG : R X 01
CG : R 02
 The treatment effect is obtained by
TE = 01 - 02
 Except for pre-measurement, the
implementation of this design is very
similar to that of the pretest-posttest
control group design.
 (Selection Bias & Mortality)
Quasi-Experimental Designs:
Time Series Design
01 02 03 04 05 X 06 07 08 09 010
 There is no randomization of test units
to treatments.
 The timing of treatment presentation,
as well as which test units are exposed
to the treatment, may not be within the
researcher's control.
Multiple Time Series Design
EG : 01 02 03 04 05 X 06 07 08 09 010
CG : 01 02 03 04 05 06 07 08 09 010
 If the control group is carefully selected,
this design can be an improvement over
the simple time series experiment.
 Can test the treatment effect twice:
against the pretreatment measurements
in the experimental group and against
the control group.
Statistical Designs
Statistical designs consist of a series of basic
experiments that allow for statistical control and analysis
of external variables and offer the following advantages:
 The effects of more than one independent variable can
be measured.
 Specific extraneous variables can be statistically
controlled.
 Economical designs can be formulated when each test
unit is measured more than once.
The most common statistical designs are the Completely
randomised design, Randomised block design, the Latin
square design, and the Factorial design.
Completely Randomised Design
Pricing Decision Facing Manager of Adani Retail.
 He wants to know what should be the ideal price difference
between their in-store brand and the national brands like
Maggi or Kissan.
 Sets up an experiment involving eighteen Adani Retail Stores
and three price spreads (treatment levels) of Rs.7, Rs.12 &
Rs.17 between the in store brand and the national brands.
 Six stores are assigned randomly to each of the price spread.
 The price difference is maintained for a period, then tally is
made of Sales volume & Gross profits for each group of
stores.
 This can be diagrammed as
R O1 X1 O2
R O3 X2 O4
R O5 X3 O6
O1 O3 &O5 is gross profits of instore brand for a month before the test
O2 O4 &O6 is gross profits of instore brand for a month after the test
Assumption is randonmisation of stores to the three treatment level is sufficient to make the three store group equivalent.
Completely Randomised Design
Randomized Block Design
 Is useful when there is only one major
external variable, such as store size, that
might influence the dependent variable.
 The test units are blocked, or grouped, on
the basis of the external variable.
 By blocking, the researcher ensures that
the various experimental and control
groups are matched closely on the
external variable.
Randomized Block Design
Treatment Groups
Block Customer Price Difference
Number Income Rs. 7 Rs. 12 Rs. 17
R R R
1 Heavy X1 X2 X3
2 Medium X1 X2 X3
3 Low X1 X2 X3
Factorial Design
 Is used to measure the effects of two
or more independent variables at
various levels.
 A factorial design may also be
conceptualized as a table.
 In a two-factor design, each level of
one variable represents a row and
each level of another variable
represents a column.
Factorial Design
Ad AAd A Ad BAd B
Gender
Men X1Y1 X1Y2
60 70 65
Women X2Y1 X2Y2
80 50 65
Main Effects
of Gender
Main Effects
of Ads
2 x 2 FACTORIAL DESIGN illustrating
effects of gender and Ad on believability
Latin Square Design
 Allows the researcher to statistically control two non-
interacting external variables as well as to manipulate the
independent variable.
 Each external or blocking variable is divided into an equal
number of blocks, or levels.
 The independent variable is also divided into the same
number of levels.
 A Latin square is conceptualized as a table, with the rows and
columns representing the blocks in the two external variables.
 The levels of the independent variable are assigned to the
cells in the table.
 The assignment rule is that each level of the independent
variable should appear only once in each row and each
column, as shown in Table
Latin Square Design
Customer Income
Store Size High Medium Low
Large X3 X1 X2
Medium X2 X3 X1
Small X1 X2 X3
Laboratory versus Field Experiments
Factor Laboratory Field
Environment Artificial Realistic
Control High Low
Reactive Error High Low
Demand Artifacts High Low
Internal Validity High Low
External Validity Low High
Time Short Long
Number of Units Small Large
Ease of Implementation High Low
Cost Low High
Limitations of Experimentation
 Experiments can be time consuming,
particularly if the researcher is interested in
measuring the long-term effects.
 Experiments are often expensive. The
requirements of experimental group, control
group, and multiple measurements
significantly add to the cost of research.
 Experiments can be difficult to administer. It
may be impossible to control for the effects of
the extraneous variables, particularly in a field
environment.
 Competitors may deliberately contaminate the
results of a field experiment.
THANK YOU
Competition
Overall Marketing Strategy
Socio-CulturalEnvironment
NeedforSecrecy
New Product Development
Research on Existing Products
Research on other Elements
Simulated Test Marketing
Controlled Test Marketing
Standard Test Marketing
National Introduction
StopandReevaluate
-ve
-ve
-ve
-ve
Very +ve
Other Factors
Very +ve
Other Factors
Very +ve
Other Factors
Selecting a Test-Marketing Strategy
Criteria for the Selection of Test Markets
Test Markets should have the following qualities:
1) Be large enough to produce meaningful projections. They
should contain at least 2% of the potential actual population.
2) Be representative demographically.
3) Be representative with respect to product consumption behavior.
4) Be representative with respect to media usage.
5) Be representative with respect to competition.
6) Be relatively isolated in terms of media and physical distribution.
7) Have normal historical development in the product class
8) Have marketing research and auditing services available
9) Not be over-tested

Causal research-1219342132452457-8

  • 1.
  • 2.
    Chapter Outline 1) Overview 2)Concept of Causality 3) Conditions for Causality 4) Definition of Concepts 5) Definition of Symbols 6) Validity in Experimentation 7) Extraneous Variables 8) Controlling Extraneous Variables 9) A Classification of Experimental Designs 10) Pre-experimental Designs 11) True Experimental Designs
  • 3.
    Chapter Outline 12) QuasiExperimental Designs 13) Statistical Designs 14) Laboratory vs. Field Experiments 15) Experimental vs. Non-experimental Designs 16) Limitations of Experimentation 17) Summary 18) Key Terms and Concepts
  • 4.
    Concept of Causality Astatement such as "X causes Y " will have the following meaning to an ordinary person and to a scientist. ____________________________________________________ Ordinary Meaning Scientific Meaning ____________________________________________________ X is the only cause of Y. X is only one of a number of possible causes of Y. X must always lead to Y The occurrence of X makes the (X is a deterministic occurrence of Y more probable cause of Y). (X is a probabilistic cause of Y).   It is possible to prove We can never prove that X is a that X is a cause of Y. cause of Y. At best, we can
  • 5.
    Conditions for Causality Concomitant variation is the extent to which a cause, X, and an effect, Y, occur together or vary together in the way predicted by the hypothesis under consideration.  The time order of occurrence condition states that the causing event must occur either before or simultaneously with the effect; it cannot occur afterwards.  The absence of other possible causal factors means that the factor or variable being investigated should be the only possible causal explanation.
  • 6.
    Evidence of ConcomitantVariation between Purchase of Fashion Clothing and Education High High Low 363 (73%) 137 (27%) 322 (64%) 178 (36%) Purchase of Fashion Clothing, Y 500 (100%) 500 (100%)Low Education,X
  • 7.
    Purchase of FashionClothing By Income and Education Low Income Purchase High Low High Low Education 200 (100%) 300 (100%) 300 200 122 (61%) 171 (57%) 78 (39%) 129 (43%) High Income Purchase High High Low Low 241 (80%) 151 (76%) 59 (20%) 49 (24%) Education
  • 8.
    Definitions and Concepts Independent variables are variables or alternatives that are manipulated and whose effects are measured and compared, e.g., price levels.  Test units are individuals, organizations, or other entities whose response to the independent variables or treatments is being examined, e.g., consumers or stores.  Dependent variables are the variables which measure the effect of the independent variables on the test units, e.g., sales, profits, and market shares.  Extraneous variables are all variables other than the independent variables that affect the response of the test units, e.g., store size, store location, and competitive effort.
  • 9.
    Experimental Design An experimentaldesign is a set of procedures specifying  the test units and how these units are to be divided into homogeneous subsamples,  what independent variables or treatments are to be manipulated,  what dependent variables are to be measured, and  how the extraneous variables are to be controlled.
  • 10.
    Validity in Experimentation Internal validity refers to whether the manipulation of the independent variables or treatments actually caused the observed effects on the dependent variables. Control of extraneous variables is a necessary condition for establishing internal validity.  External validity refers to whether the cause-and-effect relationships found in the experiment can be generalized. To what populations, settings, times, independent variables and dependent variables can the results be projected?
  • 11.
    Extraneous Variables  Historyrefers to specific events that are external to the experiment but occur at the same time as the experiment.  Maturation (MA) refers to changes in the test units themselves that occur with the passage of time.  Testing effects are caused by the process of experimentation. Typically, these are the effects on the experiment of taking a measure on the dependent variable before and after the presentation of the treatment.  The main testing effect (MT) occurs when a prior observation affects a latter observation.
  • 12.
    Extraneous Variables  Inthe interactive testing effect (IT), a prior measurement affects the test unit's response to the independent variable.  Instrumentation (I) refers to changes in the measuring instrument, in the observers or in the scores themselves.  Selection bias (SB) refers to the improper assignment of test units to treatment conditions.  Mortality (MO) refers to the loss of test units while the experiment is in progress.
  • 13.
    Controlling Extraneous Variables Randomization refers to the random assignment of test units to experimental groups by using random numbers. Treatment conditions are also randomly assigned to experimental groups.  Matching involves comparing test units on a set of key background variables before assigning them to the treatment conditions.  Statistical control involves measuring the extraneous variables and adjusting for their effects through statistical analysis.  Design control involves the use of experiments designed to control specific extraneous variables.
  • 14.
    A Classification ofExperimental Designs  Pre-experimental designs do not employ randomization procedures to control for extraneous factors:  The one-shot case study, the one-group pretest- posttest design, and the static-group.  In true experimental designs, the researcher can randomly assign test units to experimental groups and treatments to experimental groups:  The pretest-posttest control group design, the posttest-only control group design, and the Solomon four-group design.
  • 15.
    A Classification ofExperimental Designs  Quasi-experimental designs result when the researcher is unable to achieve full manipulation of scheduling or allocation of treatments to test units but can still apply part of the apparatus of true experimentation:  Time series and multiple time series designs.  A Statistical design is a series of basic experiments that allows for statistical control and analysis of external variables:  Randomized block design, Latin square design, and factorial designs.
  • 16.
    A Classification ofExperimental Designs Pre-experimental One-Shot Case Study One Group Pretest-Posttest Static Group True Experimental Pretest-Posttest Control Group Posttest: Only Control Group Solomon Four- Group Quasi Experimental Time Series Multiple Time Series Statistical Randomized Blocks Latin Square Factorial Design Experimental Designs
  • 17.
    One-Shot Case Study X01  A single group of test units is exposed to a treatment X.  A single measurement on the dependent variable is taken (01).  There is no random assignment of test units.  The one-shot case study is more appropriate for exploratory than for conclusive research. (History, Maturation, Selection & Mortality)
  • 18.
    One-Group Pretest-Posttest Design 01X 02  A group of test units is measured twice.  There is no control group.  The treatment effect is computed as 02 – 01.  The validity of this conclusion is questionable since extraneous variables are largely uncontrolled. (History, Maturation, Testing, Instrumentation, Selection, Mortality, & Regression)
  • 19.
    Static Group Design EG:X 01 CG: 02  A two-group experimental design.  The experimental group (EG) is exposed to the treatment, and the control group (CG) is not.  Measurements on both groups are made only after the treatment.  Test units are not assigned at random.  The treatment effect would be measured as 01 - 02. (Selection & Mortality)
  • 20.
    True Experimental Designs: Pretest-PosttestControl Group Design EG: R 01 X 02 CG: R 03 04  Test units are randomly assigned to either the experimental or the control group.  A pretreatment measure is taken on each group.  The treatment effect (TE) is measured as:(02 - 01) - (04 - 03).  Selection bias is eliminated by randomization.  The other extraneous effects are controlled as follows: 02 – 01= TE + H + MA + MT + IT + I + SR + MO 04 – 03= H + MA + MT + I + SR + MO = EV (Extraneous Variables)  The experimental result is obtained by: (02 - 01) - (04 - 03) = TE + IT  Interactive testing effect is not controlled.
  • 21.
    Posttest-Only Control GroupDesign EG : R X 01 CG : R 02  The treatment effect is obtained by TE = 01 - 02  Except for pre-measurement, the implementation of this design is very similar to that of the pretest-posttest control group design.  (Selection Bias & Mortality)
  • 22.
    Quasi-Experimental Designs: Time SeriesDesign 01 02 03 04 05 X 06 07 08 09 010  There is no randomization of test units to treatments.  The timing of treatment presentation, as well as which test units are exposed to the treatment, may not be within the researcher's control.
  • 23.
    Multiple Time SeriesDesign EG : 01 02 03 04 05 X 06 07 08 09 010 CG : 01 02 03 04 05 06 07 08 09 010  If the control group is carefully selected, this design can be an improvement over the simple time series experiment.  Can test the treatment effect twice: against the pretreatment measurements in the experimental group and against the control group.
  • 24.
    Statistical Designs Statistical designsconsist of a series of basic experiments that allow for statistical control and analysis of external variables and offer the following advantages:  The effects of more than one independent variable can be measured.  Specific extraneous variables can be statistically controlled.  Economical designs can be formulated when each test unit is measured more than once. The most common statistical designs are the Completely randomised design, Randomised block design, the Latin square design, and the Factorial design.
  • 25.
    Completely Randomised Design PricingDecision Facing Manager of Adani Retail.  He wants to know what should be the ideal price difference between their in-store brand and the national brands like Maggi or Kissan.  Sets up an experiment involving eighteen Adani Retail Stores and three price spreads (treatment levels) of Rs.7, Rs.12 & Rs.17 between the in store brand and the national brands.  Six stores are assigned randomly to each of the price spread.  The price difference is maintained for a period, then tally is made of Sales volume & Gross profits for each group of stores.
  • 26.
     This canbe diagrammed as R O1 X1 O2 R O3 X2 O4 R O5 X3 O6 O1 O3 &O5 is gross profits of instore brand for a month before the test O2 O4 &O6 is gross profits of instore brand for a month after the test Assumption is randonmisation of stores to the three treatment level is sufficient to make the three store group equivalent. Completely Randomised Design
  • 27.
    Randomized Block Design Is useful when there is only one major external variable, such as store size, that might influence the dependent variable.  The test units are blocked, or grouped, on the basis of the external variable.  By blocking, the researcher ensures that the various experimental and control groups are matched closely on the external variable.
  • 28.
    Randomized Block Design TreatmentGroups Block Customer Price Difference Number Income Rs. 7 Rs. 12 Rs. 17 R R R 1 Heavy X1 X2 X3 2 Medium X1 X2 X3 3 Low X1 X2 X3
  • 29.
    Factorial Design  Isused to measure the effects of two or more independent variables at various levels.  A factorial design may also be conceptualized as a table.  In a two-factor design, each level of one variable represents a row and each level of another variable represents a column.
  • 30.
    Factorial Design Ad AAdA Ad BAd B Gender Men X1Y1 X1Y2 60 70 65 Women X2Y1 X2Y2 80 50 65 Main Effects of Gender Main Effects of Ads 2 x 2 FACTORIAL DESIGN illustrating effects of gender and Ad on believability
  • 31.
    Latin Square Design Allows the researcher to statistically control two non- interacting external variables as well as to manipulate the independent variable.  Each external or blocking variable is divided into an equal number of blocks, or levels.  The independent variable is also divided into the same number of levels.  A Latin square is conceptualized as a table, with the rows and columns representing the blocks in the two external variables.  The levels of the independent variable are assigned to the cells in the table.  The assignment rule is that each level of the independent variable should appear only once in each row and each column, as shown in Table
  • 32.
    Latin Square Design CustomerIncome Store Size High Medium Low Large X3 X1 X2 Medium X2 X3 X1 Small X1 X2 X3
  • 33.
    Laboratory versus FieldExperiments Factor Laboratory Field Environment Artificial Realistic Control High Low Reactive Error High Low Demand Artifacts High Low Internal Validity High Low External Validity Low High Time Short Long Number of Units Small Large Ease of Implementation High Low Cost Low High
  • 34.
    Limitations of Experimentation Experiments can be time consuming, particularly if the researcher is interested in measuring the long-term effects.  Experiments are often expensive. The requirements of experimental group, control group, and multiple measurements significantly add to the cost of research.  Experiments can be difficult to administer. It may be impossible to control for the effects of the extraneous variables, particularly in a field environment.  Competitors may deliberately contaminate the results of a field experiment.
  • 35.
  • 36.
    Competition Overall Marketing Strategy Socio-CulturalEnvironment NeedforSecrecy NewProduct Development Research on Existing Products Research on other Elements Simulated Test Marketing Controlled Test Marketing Standard Test Marketing National Introduction StopandReevaluate -ve -ve -ve -ve Very +ve Other Factors Very +ve Other Factors Very +ve Other Factors Selecting a Test-Marketing Strategy
  • 37.
    Criteria for theSelection of Test Markets Test Markets should have the following qualities: 1) Be large enough to produce meaningful projections. They should contain at least 2% of the potential actual population. 2) Be representative demographically. 3) Be representative with respect to product consumption behavior. 4) Be representative with respect to media usage. 5) Be representative with respect to competition. 6) Be relatively isolated in terms of media and physical distribution. 7) Have normal historical development in the product class 8) Have marketing research and auditing services available 9) Not be over-tested