

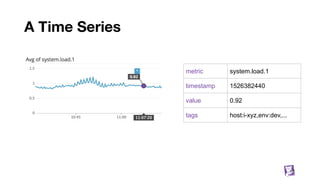
![Metrics Name and Tags
Name: single string defining what you are measuring, e.g.
system.cpu.user
aws.elb.latency
dd.frontend.internal.ajax.queue.length.total
Tags: list of k:v strings, used to qualify metric and add dimensions to filter/aggregate over, e.g.
['host:server-1', 'availability-zone:us-east-1a', 'kernel_version:4.4.0']
['host:server-2', 'availability-zone:us-east-1a', 'kernel_version:2.6.32']
['host:server-3', 'availability-zone:us-east-1b', 'kernel_version:2.6.32']
13](https://image.slidesharecdn.com/untitled-191001065955/85/Datadog-a-Real-Time-Metrics-Database-for-One-Quadrillion-Points-Day-15-320.jpg)


![Building blocks
We have a way to move data around (Kafka)
We have ways to index that data (tagsets)
We know how to separate recent and historical data
Plan for the future
[Lego / puzzle with gaps]
89](https://image.slidesharecdn.com/untitled-191001065955/85/Datadog-a-Real-Time-Metrics-Database-for-One-Quadrillion-Points-Day-91-320.jpg)

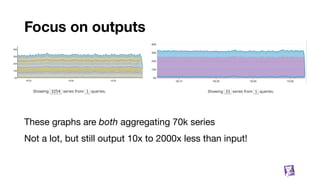
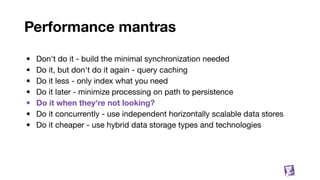
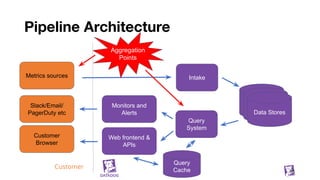
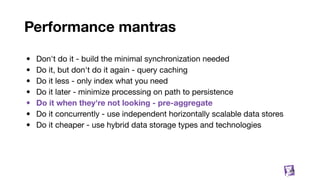
The document presents an in-depth overview of Datadog's metrics database, detailing its architecture, data handling processes, and the various performance strategies it employs. It covers the significance of metrics databases, data synchronization, and the use of tagging to enhance data insights, along with performance mantras to optimize system efficiency. Additionally, it describes the challenges and solutions for managing massive data volumes and maintaining quick query responses in a cloud environment.