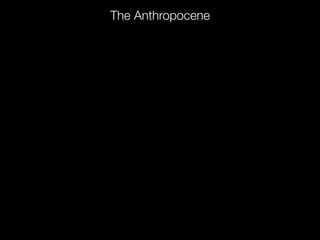
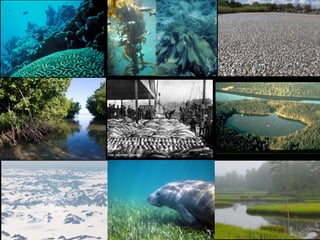
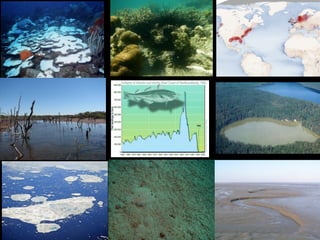
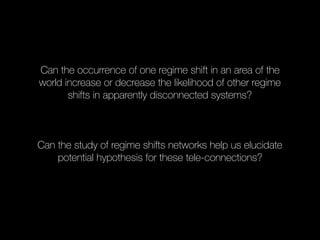
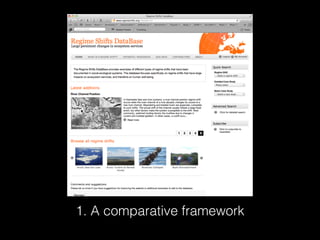
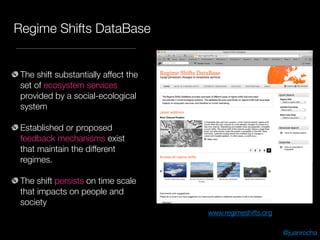
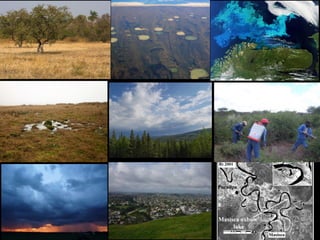
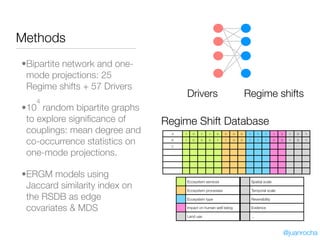
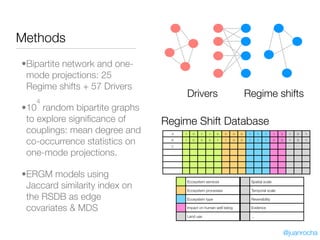
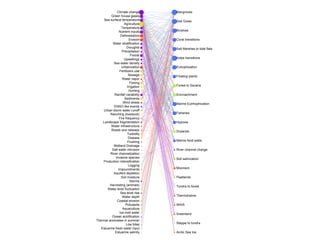
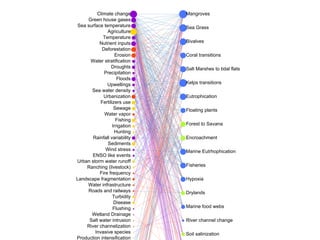
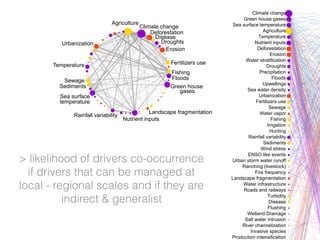
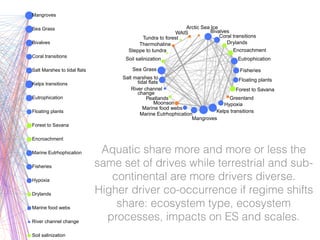
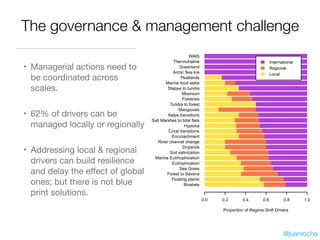
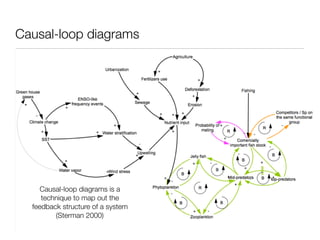
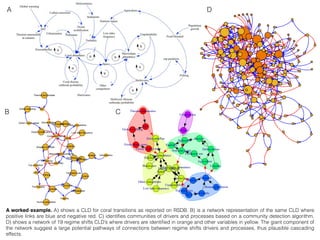
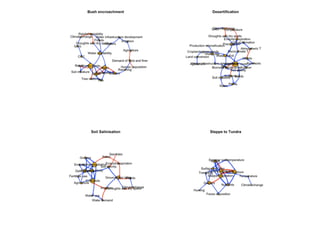
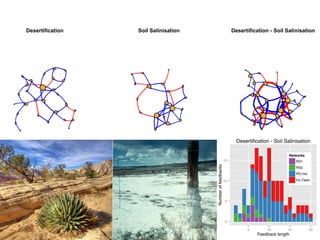
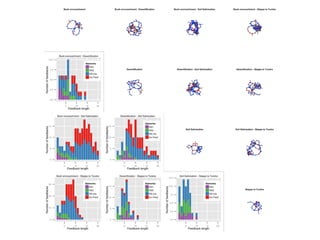
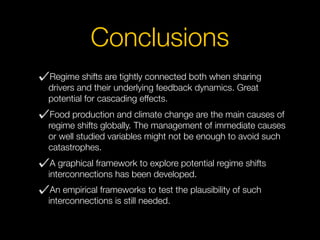
This document discusses regime shifts in social-ecological systems. It addresses the social challenge of understanding when and where regime shifts are likely to occur, who they will affect, and how to avoid them. The science challenge is to study these phenomena using limited data and time for action. Potential interactions between regime shifts are examined through comparative frameworks analyzing shared drivers and feedback dynamics. This could help elucidate cascading effects between apparently disconnected systems and identify management strategies to build resilience.

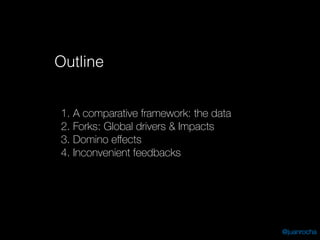

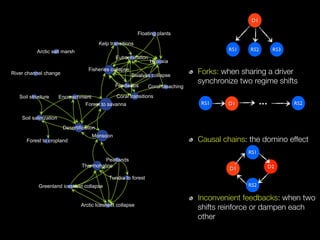
![3. Cascading & domino effects
[work in progress]](https://image.slidesharecdn.com/cascadingccs16-160921064356/85/Cascading-Effects-CCS2016-31-320.jpg)
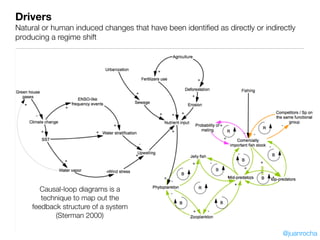
![4. Inconvenient feedbacks
[work in progress]](https://image.slidesharecdn.com/cascadingccs16-160921064356/85/Cascading-Effects-CCS2016-34-320.jpg)
![4. Inconvenient feedbacks
[work in progress]](https://image.slidesharecdn.com/cascadingccs16-160921064356/85/Cascading-Effects-CCS2016-35-320.jpg)


![Polymer [ बहुलक ] Chemistry Notes PDF - Irfanullah Mehar - JJ Sir Chemistry.pdf](https://cdn.slidesharecdn.com/ss_thumbnails/polymerchemistrynotespdf-irfanullahmehar-jjsirchemistry-260210172118-3f9b37f7-thumbnail.jpg?width=640&height=640&fit=bounds)


