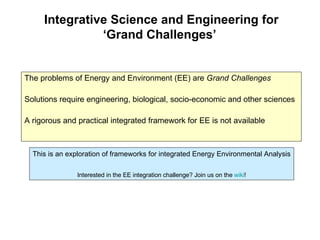
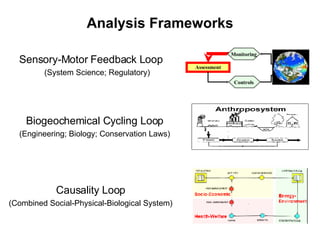
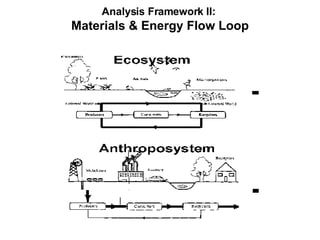
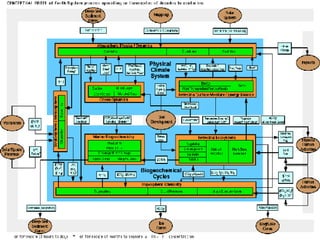
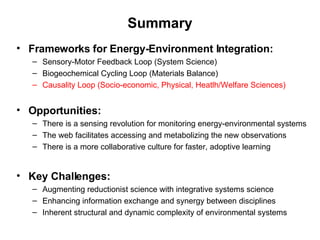
The document discusses three analysis frameworks for integrating energy and environmental issues:
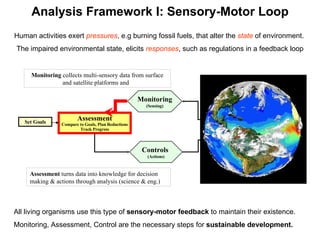
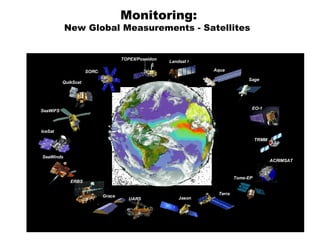
1) The sensory-motor feedback loop models the assessment-control cycle using monitoring data to inform goals and actions.
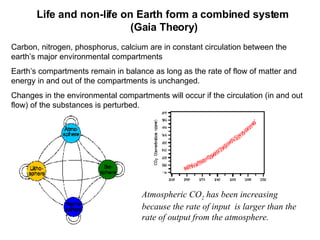
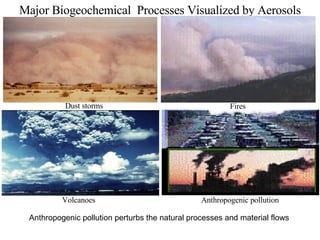
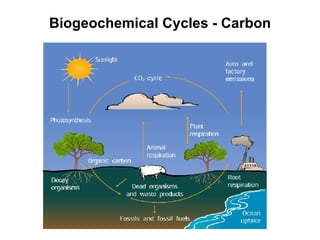
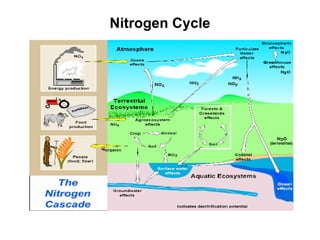
2) The biogeochemical cycling loop illustrates the circulation of materials like carbon and nitrogen between environmental compartments.
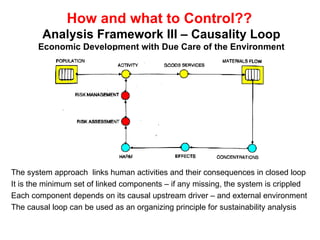
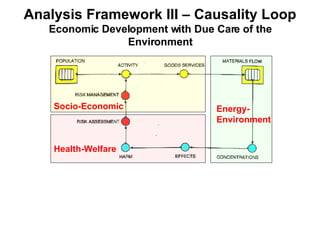
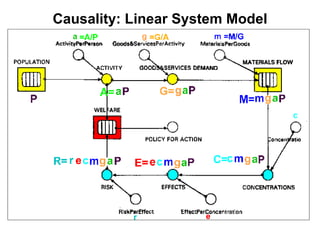
3) The causality loop links human activities, their impacts on the environment, and feedback through economic and social factors.


![Ea Seminar Mar 1[1]](https://cdn.slidesharecdn.com/ss_thumbnails/easeminarmar11-1228234050058935-8-thumbnail.jpg?width=640&height=640&fit=bounds)


