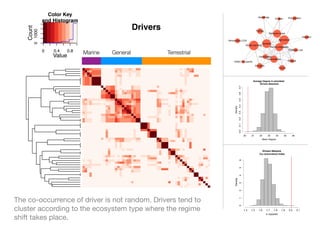
The document discusses two networks constructed from genetic disorder and disease gene data: the human disease network (HDN) and the disease gene network (DGN). The HDN connects disorders that share disease genes, revealing many connections between disorders. The DGN connects disease genes associated with the same disorders. Most disorders relate to a few genes, while a few disorders like cancers relate to dozens of genes. The networks provide an integrated framework to explore relationships between genetic disorders and disease genes.
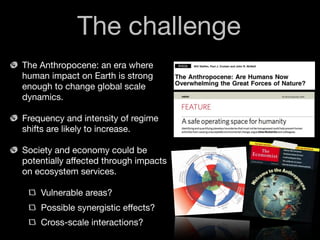
The document describes the construction of networks to represent relationships between human genetic disorders and disease genes. Specifically, it details:
1) The creation of a "diseasome" bipartite network connecting 1,284 disorders and 1,777 disease genes based on known associations between genetic mutations and phenotypes.
2) The projection of this network into a "human disease network" where nodes represent disorders connected if they share disease genes, and a "disease gene network" where nodes represent genes connected if associated with the same disorder.
3) Analysis of the properties of these networks, finding most disorders are linked to only a few other disorders and disease genes, though some relate to dozens, and the networks display many connections
This document discusses using data-intensive science to build better disease maps by integrating layers of omics data and computational models. It proposes that Sage Bionetworks, a non-profit organization, could act as a commons to facilitate collaborative work on disease network models using data repositories and discovery platforms. The document outlines Sage's mission and vision, as well as its collaborators from pharmaceutical companies, foundations, government agencies, and academics, to accelerate the elimination of human disease through evolving integrative biological network representations.
Development of FDA MicroDB: A Regulatory-Grade Microbial Reference DatabaseNathan Olson
"Development of FDA MicroDB: A Regulatory-Grade
Microbial Reference Database" presentation at the Standards for Pathogen Identification via NGS (SPIN) workshop hosted by the National Institute for Standards and Technology October 2014 by Heike Sichtig, PhD from the FDA and Luke Tallon from IGS UMSOM.
This summary provides the key details from the document in 3 sentences:
The document is the full text of War and Peace by Leo Tolstoy. It begins with an introduction that describes when the book was published and translated. The actual novel then starts with Chapter 1, which describes a conversation at a social gathering between Prince Vasili Kuragin and Anna Pavlovna Scherer where they discuss politics and the Kuragin family.
A empresa anunciou um novo produto que combina hardware e software para fornecer uma solução completa para clientes. O produto oferece recursos avançados de inteligência artificial e aprendizado de máquina para automatizar tarefas complexas. Analistas acreditam que o produto pode ser um sucesso comercial se for fácil de usar e tiver um preço acessível.
La conclusión de este estudio es la certeza de un cambio “abrupto e irreversible” de la Tierra. Los ecosistemas habrían superado diferentes umbrales críticos (“critical transitions caused by threshold effects are likely“), y la mano del hombre está en esa presión sobre el planeta. No hay fecha para el cambio.
By David Ruyet
http://davidruyet.wordpress.com/2012/06/27/el-articulo-de-nature-del-que-todo-el-mundo-habla-o-casi/?year=2012&monthnum=06&day=27&like=1&_wpnonce=37109b7ca8&wpl_rand=be42a6efdc
This document discusses the promise of social media for B2B marketers. It summarizes research showing that over 80% of B2B decision makers participate in social media channels like blogs, wikis, and social networks. The content accessed on these channels influences over half of their business purchase decisions. Additionally, over 70% of B2B marketers plan to increase their budgets for emerging online tactics like blogs, podcasts, and social networks. For B2B marketers to effectively utilize social media, they must foster online communities, provide value to customers, and engage prospects through customer evangelism.
Stephen Friend Genetic Alliance 25th Anniversary 2011-06-24Sage Base
This document discusses using data-intensive science to build better models of human disease. It argues that advances in data generation, computing power, and open information systems now make it possible to comprehensively monitor disease and molecular traits in populations. This could allow evolving disease models in a shared compute space to develop better understanding of complex biological pathways and their relationship to diseases. The document outlines several initiatives, including the Clinical Trial Comparator Arm Partnership and Sage Bionetworks, that aim to facilitate open sharing of genomic and clinical trial data to generate more powerful models and accelerate progress against human diseases.
Stephen Friend Food & Drug Administration 2011-07-18Sage Base
The document discusses potential opportunities for participating in clinical trial projects that study network perturbations in clinical specimens to better understand how to select effective drug targets for different diseases and patients. It describes four potential projects: 1) a clinical trial comparator arm project, 2) a project to decode biology using drug compounds, 3) an oncology non-responders project, and 4) a project to free up failed drug compounds. It asks what actions the FDA or other executive/legislative bodies might take regarding these projects.
Stephen Friend Cytoscape Retreat 2011-05-20Sage Base
Use of Bionetworks to Build Maps of Disease
Stephen Friend proposes using "data intensive science", also known as the "fourth scientific paradigm", to build better maps of human disease. This approach utilizes massive amounts of biological and clinical data from populations, along with computational modeling, to construct networks that model disease. Integrating diverse data types can provide insights into disease mechanisms and causal relationships that enable more accurate predictions. Bionetworks approaches have the potential to advance the understanding and treatment of complex diseases.
Albert Laszlo Barabasi - Innovation inspired positive change in health careponencias_mihealth2012
This document summarizes network medicine and its applications. It discusses how human diseases can be modeled and studied as complex networks. Disease genes are found to cluster together in protein interaction networks, forming disease modules. Mapping disease genes onto interactome networks can help identify new candidate genes and delineate disease modules. Validation using various biological data shows the predicted disease genes are statistically associated with the disease. Mapping asthma genes in this way identified a statistically significant disease module within the first 200 prioritized genes. Network medicine approaches provide a framework for understanding the molecular basis of diseases.
Stephen Friend Institute for Cancer Research 2011-11-01Sage Base
This document discusses building models of disease using data intensive science. It describes integrating omics data and computational models in a compute space. The challenges of the current drug discovery process are outlined, noting a need to better understand disease biology before testing compounds. Network models are proposed to capture disease complexity beyond single components. Examples are given of building gene co-expression networks from large datasets and using them to identify disease modules and key drivers. The potential for predictive models of genotype-specific drug responses is also mentioned.
The document discusses using "data intensive science" and integrated network maps to build better models of human disease. It proposes using massive amounts of data from various omics technologies, along with open sharing of data, tools and models, to generate comprehensive maps of diseases like cancer on a molecular level. The goal is to move beyond treating symptoms to modifying disease pathways by developing more personalized treatments and predictive markers through integrated analysis of multi-omics datasets.
Stratified Medicine - Applications and Case StudiesSpace IDEAS Hub
Stratified medicine opportunities for businesses were discussed at a conference. The agenda included talks on systems biology in cancer, single molecule imaging technology, and knowledge engineering for biomedical research. The document also provided details on various speakers and their presentations. It summarized the goals and tools used in computational systems biology of cancer at Institut Curie, including building maps of cancer signaling networks. Examples were given of how these maps could be used to analyze data, find alternative pathways, and model cell fate decisions.
This document discusses harnessing the power of teams and networks to build better models of disease in real time. It notes that new technologies now allow the generation of massive amounts of human omics data and emerging network modeling approaches for diseases. Cloud computing infrastructure allows a generative open approach to biomedical problem solving. A nascent movement aims to give patients more control over their sensitive health information to facilitate sharing. Open social media also allows experts and citizens to collaborate to solve biomedical problems. The overall opportunity is to conduct more open, collaborative biomedical research involving diverse teams.
Interactomics, Integromics to Systems Biology: Next Animal Biotechnology Fron...Varij Nayan
“Organisms function in an integrated manner-our senses, our muscles, our metabolism and our minds work together seamlessly. But biologists have historically studied organisms part by part and celebrated the modern ability to study them molecule by molecule, gene by gene. Systems biology is critical science of future that seeks to understand the integration of the pieces to form biological
systems”
(David Baltimore, Nobel Laureate)
This document proposes using data intensive science to build better models of disease. It notes that current disease models make simplistic assumptions and that personalized medicine requires better representations of overlapping pathways. It advocates adopting the "fourth paradigm" of data intensive science to generate massive datasets, ensure interoperability, create open information systems, and host evolving computational models. Six pilot projects are described that involve collaborative data sharing between industry, academia, and non-profits to build disease maps and models. These include initiatives like CTCAP to share clinical trial data, Arch2POCM to de-risk drug targets, and forming a federation to enhance interoperability. The document argues this approach could help address issues like a lack of standard
Stephen Friend WIN Symposium 2011 2011-07-06Sage Base
Searching for opportunities to use data-intensive science to build better disease maps through open innovation and collaboration across silos. The key advantages discussed are generating more clinically validated targets through data sharing, helping deliver more new drugs for patients, and improving health outcomes. Issues around current drug discovery redundancy and high failure rates are also addressed.
Stephen Friend NIH PPP Coordinating Committee Meeting 2012-02-16Sage Base
The document discusses using networked team approaches and integrating omics data to build better disease maps through public-private partnerships like CTCAP and Arch2POCM. It proposes sharing clinical and genomic data from comparator arms of trials to create models and de-risking novel drug targets through developing test compounds in a precompetitive space to accelerate new therapies.
Here are some suggestions for open online bioinformatics lectures and courses from famous universities:
- MIT OpenCourseWare has free bioinformatics course materials and videos from MIT courses.
- edX has massive open online courses (MOOCs) in bioinformatics from universities like Harvard, Berkeley, MIT. Some are free to audit.
- Coursera has bioinformatics courses from top universities like Johns Hopkins, University of Toronto, Peking University.
- YouTube has full lecture videos from bioinformatics courses at universities like Stanford, UC San Diego, University of Cambridge.
- Khan Academy has introductory bioinformatics lectures on topics like sequence alignment, gene finding, protein structure.
- EMBL-
1. The document discusses using heterogeneous biological data to advance scientific discovery by overcoming complexity.
2. It describes how new technologies now allow generation of massive human "omics" data and emerging network modeling approaches for diseases.
3. Integrating this data through cloud computing infrastructure can enable a generative open approach to solving biomedical problems.
This document provides an introduction to biological network inference using Gaussian graphical models. It discusses motivations for network inference based on the central dogma of molecular biology and common questions in functional genomics. The challenges of modeling high-dimensional omics data are described, including what network nodes and edges represent statistically and biologically. Gaussian graphical models are proposed as a tool for modeling dependencies between biological variables in genomic data, with the goal of reconstructing biological networks from large-scale omics experiments.
Molecular basis of evolution and softwares used in phylogenetic tree contructionUdayBhanushali111
This document discusses molecular evolution and software used for phylogenetic tree construction. It begins by defining molecular evolution as the process of mutation and selection at the molecular level. It then discusses different types of mutations that can occur in DNA and proteins, such as synonymous, nonsynonymous, nonsense, missense, and frameshift mutations. The document also discusses using molecular data to study evolution and reconstruct phylogenetic relationships. It describes several software programs used for phylogenetic tree construction, including EzEditor, BAli-Phy, Clustal ω, BayesTraits, and fastDNAml, and provides brief summaries of their methods and purposes.
This document discusses the evolution of systems biology and its various approaches over time, such as genomic and proteomic profiling, molecular interaction networks, disease models, and drug trials. It notes the movement from studying individual components to constructing network models of entire biological systems and pathways. It also addresses challenges like overgeneralizing findings and the need for more collaborative and open research.
Math, Stats and CS in Public Health and Medical ResearchJessica Minnier
Jessica Minnier gave a talk on her career path from studying mathematics at Lewis & Clark College to her current position as an Assistant Professor in biostatistics. She discussed how biostatistics, bioinformatics, and computational biology are applied in medical research, using examples like analyzing RNA sequencing data and building predictive models from electronic health records. Minnier also shared resources for learning more about careers in public health research and statistics.
Behavioural Economics in Social-Ecological Systems with ThresholdsJuan C. Rocha
1) The study examines how people in fishing communities in Colombia behave when facing uncertainty related to climate thresholds through a behavioral experiment.
2) 256 participants across 4 communities played a dynamic common pool resource game in groups, with some groups facing information about a past climate event or potential future events with known or unknown probabilities.
3) Groups that were told about past climate thresholds or potential future events with known probabilities achieved higher average resource stock sizes, exhibiting more conservative exploitation behaviors when facing uncertainty.
This document discusses regime shifts in social-ecological systems. It addresses the social challenge of understanding when and where regime shifts are likely to occur, who they will affect, and how to avoid them. The science challenge is to study these phenomena using limited data and time for action. Potential interactions between regime shifts are examined through comparative frameworks analyzing shared drivers and feedback dynamics. This could help elucidate cascading effects between apparently disconnected systems and identify management strategies to build resilience.
The document discusses regime shifts in the Anthropocene. It defines regime shifts as abrupt reorganizations of a system's structure and function. Understanding regime shifts is a social and scientific challenge. The document presents a framework to compare regime shifts across scales and drivers. It analyzes a database of 25 regime shifts and their associations with 57 drivers. Many regime shifts are connected to drivers like climate change, fishing, and coastal development. Managing local and regional drivers can help build resilience to global drivers and delays in regime shifts.
This document discusses using network controllability analysis to assess how manageable regime shifts are. It notes that heterogeneous networks are difficult to control due to many driving nodes, while homogeneous networks are more controllable with fewer driving nodes. However, critics argue that a system's internal dynamics and observability are more important than just structure. The document also discusses how sparse heterogeneous networks may actually have more controllable edge dynamics. It explores using network science and resilience science to determine when to build resilience versus enable transformational change.
This document summarizes a network analysis of global environmental regime shifts. It finds that food production and climate change are the most frequent drivers of regime shifts globally. Marine regime shifts share more drivers than terrestrial ones. Managing regime shifts requires multi-level governance across local, national, and international scales as regulating single drivers may not prevent shifts. The analysis finds network approaches useful for studying interconnected social-ecological systems when data availability is limited.
Using natural language processing, the document describes an attempt to automatically identify topics within a corpus of 812 papers related to ecosystem services. Latent Dirichlet Allocation was used to extract 80 topics from the text. The top words for each topic were analyzed and many closely matched the categories of ecosystem services established by the Millennium Ecosystem Assessment. However, some topics did not cleanly fit into the MEA framework, highlighting challenges in applying computerized topic modeling across disciplines.
This document discusses regime shifts, which are abrupt reorganizations of a system's structure and function that occur when feedbacks maintaining the system's behavior change. Disease outbreaks can act as disturbances that trigger regime shifts. Specifically, outbreaks can become part of feedback processes that lead to chaotic dynamics and strange cycles. The frequency of disease outbreaks is partially determined by a system's history and memory. Increasing speed, connectivity, and scale of modern systems may impact their resilience to outbreaks. Further research is needed on developing theory and case studies to better understand these complex dynamics.
Arctic resilience assessment: exploring methods for scaling upJuan C. Rocha
This document summarizes work on assessing resilience in the Arctic region. It discusses developing a conceptual model to understand system thresholds and factors influencing resilience. It also outlines combining a regime shift database with case studies to better understand sources of adaptive capacity. Specific regime shifts related to the Arctic are identified. Networks of drivers impacting ecosystem services and human well-being are mapped. Finally, potential case studies for understanding resilience and adaptive capacity in Arctic communities are listed.
This document discusses regime shifts, which are abrupt reorganizations of a system's structure and function. A regime corresponds to characteristic behavior maintained by mutually reinforcing feedback processes. Regime shifts occur when these feedbacks change due to changes in slow variables, external disturbances, or shocks. The document presents examples of regime shifts including vegetation shifts driven by changes in precipitation. It notes that regime shifts are common in the Anthropocene due to human impacts and discusses the need to better understand their patterns, interactions, likelihood, impacts, and how to avoid them. The rest of the document outlines a framework for comparing regime shifts using a database and examines global drivers of regime shifts like climate change, deforestation and fishing.
Licentiate: Regime shifts in the AnthropoceneJuan C. Rocha
This document discusses regime shifts in ecosystems driven by human impacts in the Anthropocene. It provides background on regime shifts, which are abrupt reorganizations of an ecosystem's structure and function. A database is being developed to compare regime shifts across different systems. The database will classify regime shifts based on their drivers, impacts on ecosystem services, and proposed feedback mechanisms. Challenges include developing consistent methods and assessing uncertainties given complex social and ecological interactions. The goal is to better understand multi-causal regime shifts in order to inform management and policy responses.
Juan-Carlos Rocha is a PhD student studying patterns of global regime shifts. He aims to map vulnerability to climate change-driven regime shifts and use network science and data mining to anticipate impacts on ecosystem services. His research analyzes over 20 regime shifts across marine, terrestrial and polar ecosystems to identify the main drivers. Food production, global warming, agriculture and human population are among the most important drivers. Marine regime shifts tend to share more drivers and feedbacks, indicating potential for synchronization. Avoiding regime shifts requires managing key international drivers. Rocha is collaborating on related projects applying text mining, experimental economics and resource networks to further understand regime shifts.
The domino effect: A network analysis of regime shifts drivers and causal pat...Juan C. Rocha
We present an exploratory analysis of the causal interactions among global change drivers of regime shifts, based on information collated in the Regime Shifts Database*. We reviewed the documented evidence of over 20 policy-relevant regime shifts in ecosystems. Information on the dynamics of each regime shift was synthesized using causal-loop diagrams, a generic structure map of the system. We then identified the main drivers of change, the key impacts on ecosystem services, as well as possible cross-scale interactions among regime shifts drivers using network analysis.
Misperception of feedbacks: another source of vulnerability in social-ecologi...Juan C. Rocha
Here I describe my previous work analyzing lobster fishery in the Caribbean as a social-ecological systems. Main findings show that dynamic failures lead the system to undesirable states: less and shorter lobsters, less profits and less fishermen. These failures typically fall within subsystems interactions: e.g. losses of lobster reproductive potential, perception of non-resource exhaustion, a poverty trap of fishing effort, and a socially based reinforcing feedback for legitimate norms breaking.
हिंदी वर्णमाला पीपीटी, hindi alphabet PPT presentation, hindi varnamala PPT, Hindi Varnamala pdf, हिंदी स्वर, हिंदी व्यंजन, sikhiye hindi varnmala, dr. mulla adam ali, hindi language and literature, hindi alphabet with drawing, hindi alphabet pdf, hindi varnamala for childrens, hindi language, hindi varnamala practice for kids, https://www.drmullaadamali.com
How to Manage Your Lost Opportunities in Odoo 17 CRMCeline George
Odoo 17 CRM allows us to track why we lose sales opportunities with "Lost Reasons." This helps analyze our sales process and identify areas for improvement. Here's how to configure lost reasons in Odoo 17 CRM
it describes the bony anatomy including the femoral head , acetabulum, labrum . also discusses the capsule , ligaments . muscle that act on the hip joint and the range of motion are outlined. factors affecting hip joint stability and weight transmission through the joint are summarized.
This presentation includes basic of PCOS their pathology and treatment and also Ayurveda correlation of PCOS and Ayurvedic line of treatment mentioned in classics.
How to Setup Warehouse & Location in Odoo 17 InventoryCeline George
In this slide, we'll explore how to set up warehouses and locations in Odoo 17 Inventory. This will help us manage our stock effectively, track inventory levels, and streamline warehouse operations.
How to Add Chatter in the odoo 17 ERP ModuleCeline George
In Odoo, the chatter is like a chat tool that helps you work together on records. You can leave notes and track things, making it easier to talk with your team and partners. Inside chatter, all communication history, activity, and changes will be displayed.
Walmart Business+ and Spark Good for Nonprofits.pdfTechSoup
"Learn about all the ways Walmart supports nonprofit organizations.
You will hear from Liz Willett, the Head of Nonprofits, and hear about what Walmart is doing to help nonprofits, including Walmart Business and Spark Good. Walmart Business+ is a new offer for nonprofits that offers discounts and also streamlines nonprofits order and expense tracking, saving time and money.
The webinar may also give some examples on how nonprofits can best leverage Walmart Business+.
The event will cover the following::
Walmart Business + (https://business.walmart.com/plus) is a new shopping experience for nonprofits, schools, and local business customers that connects an exclusive online shopping experience to stores. Benefits include free delivery and shipping, a 'Spend Analytics” feature, special discounts, deals and tax-exempt shopping.
Special TechSoup offer for a free 180 days membership, and up to $150 in discounts on eligible orders.
Spark Good (walmart.com/sparkgood) is a charitable platform that enables nonprofits to receive donations directly from customers and associates.
Answers about how you can do more with Walmart!"
LAND USE LAND COVER AND NDVI OF MIRZAPUR DISTRICT, UPRAHUL
This Dissertation explores the particular circumstances of Mirzapur, a region located in the
core of India. Mirzapur, with its varied terrains and abundant biodiversity, offers an optimal
environment for investigating the changes in vegetation cover dynamics. Our study utilizes
advanced technologies such as GIS (Geographic Information Systems) and Remote sensing to
analyze the transformations that have taken place over the course of a decade.
The complex relationship between human activities and the environment has been the focus
of extensive research and worry. As the global community grapples with swift urbanization,
population expansion, and economic progress, the effects on natural ecosystems are becoming
more evident. A crucial element of this impact is the alteration of vegetation cover, which plays a
significant role in maintaining the ecological equilibrium of our planet.Land serves as the foundation for all human activities and provides the necessary materials for
these activities. As the most crucial natural resource, its utilization by humans results in different
'Land uses,' which are determined by both human activities and the physical characteristics of the
land.
The utilization of land is impacted by human needs and environmental factors. In countries
like India, rapid population growth and the emphasis on extensive resource exploitation can lead
to significant land degradation, adversely affecting the region's land cover.
Therefore, human intervention has significantly influenced land use patterns over many
centuries, evolving its structure over time and space. In the present era, these changes have
accelerated due to factors such as agriculture and urbanization. Information regarding land use and
cover is essential for various planning and management tasks related to the Earth's surface,
providing crucial environmental data for scientific, resource management, policy purposes, and
diverse human activities.
Accurate understanding of land use and cover is imperative for the development planning
of any area. Consequently, a wide range of professionals, including earth system scientists, land
and water managers, and urban planners, are interested in obtaining data on land use and cover
changes, conversion trends, and other related patterns. The spatial dimensions of land use and
cover support policymakers and scientists in making well-informed decisions, as alterations in
these patterns indicate shifts in economic and social conditions. Monitoring such changes with the
help of Advanced technologies like Remote Sensing and Geographic Information Systems is
crucial for coordinated efforts across different administrative levels. Advanced technologies like
Remote Sensing and Geographic Information Systems
9
Changes in vegetation cover refer to variations in the distribution, composition, and overall
structure of plant communities across different temporal and spatial scales. These changes can
occur natural.
LAND USE LAND COVER AND NDVI OF MIRZAPUR DISTRICT, UP
ECCS12
1. The Network of Driving Forces of
Global Environmental Change
Juan-Carlos Rocha, Oonsie Biggs & Garry Peterson
Stockholm Resilience Centre
Stockholm University
2. The challenge
The Anthropocene: an era where
human impact on Earth is strong
enough to change global scale
dynamics.
Frequency and intensity of regime
shifts are likely to increase.
Society and economy could be
potentially affected through impacts
on ecosystem services.
Vulnerable areas?
Possible synergistic effects?
Cross-scale interactions?
3. Regime shifts:
Large, abrupt,
persistent change in
the structure and
function of a system.
Policy relevant:
Substantial change in
ecosystem services -
the goods people
receive from nature
4. Research agenda on Regime Shifts
High Bayesian networks - Web crawlers &
models local knowledge
Knowledge of the
Models & Jacobians
system
Statistics:
Autocorrelation and
variance
Low
Low Data quality High
(time series)
5. Research agenda on Regime Shifts
High Bayesian networks - Web crawlers &
models local knowledge
Knowledge of the
Models & Jacobians
system
Statistics:
Autocorrelation and
variance
Low
Low Data quality High
(time series)
6. Research agenda on Regime Shifts
High Bayesian networks - Web crawlers &
models local knowledge
Knowledge of the
Models & Jacobians
system
? Statistics:
Autocorrelation and
variance
Low
Low Data quality High
(time series)
12. Regime shift database
Description of the alternative
regimes and reinforcing
feedbacks
The drivers that precipitate the
regime shift
Impacts on ecosystem services
and human well-being
Management options
www.regimeshifts.org
13. N Policy relevant regime shifts Mechanism Reversibility
1 Bivalves collapse Established H
2 Coral transitions Established H
3 Desertification Contested H, I
4 Encroachment Established H
5 Eutrophication Established H, I, R
Data: 6 Fisheries collapse
7 Marine foodwebs collapse
Contested
Contested
U
U
8 Forest - Savanna Established I
9 Hypoxia Established H, R
10 Kelp transitions Established H, R
20 policy relevant regime shifts: 11 Soil salinization Established H, I
12 Steppe - Tundra Established I
13 Tundra - Forest Established I
8 terrestrial
14 Monsoon circulation Established I
9 aquatic 15 Thermohaline circulation collapse Established I
2 global + 1 polar 16 Greenland ice sheet collapse Established I
17 Arctic salt marshes Established I
18 Peatlands Established I
19 River channel position Established I
20 Soil structure Established H, I
Reversibility: H = Hysteretic; I = Irreversible; R= Reversible;
U = Unknown
14. Methods
• Bipartite network and one-
mode projections: 20
Regime shifts + 55 Drivers
Drivers Regime shifts
• 104 random bipartite graphs
to explore significance of Regime Shift Database
couplings: mean degree and A 1 0 1 1 0 0 0 0 1 1 1 1 0 1 0 1
co-occurrence statistics on B
C
1 0 0 0 1 1 0 0 1 1 1 0 0 1 0 1
one-mode projections.
• ERGM models using Jaccard
Ecosystem services Spatial scale
similarity index on the RSDB Ecosystem processes Temporal scale
as edge covariates Ecosystem type Reversibility
Impact on human well being Evidence
Land use ...
16. Greenland
Monsoon
weakening
Tundra to Soil
Forest Coral transitions structure
Dry land
degradation
Thermohaline Kelps transitions
circulation Forest to Savannas
Soil
Eutrophication salinization
Fisheries collapse
Bivalves
Encroachment collapse
Salt marshes Peatlands
Marine foodwebs Hypoxia
Floating plants
River channel
change
Regime Shifts Network Top 5 occur in aquatic ecosystems
17. Color Key Greenland
Monsoon
weakening
and Histogram Tundra to
Forest Coral transitions
Soil
structure
Regime shifts
Count
Dry land
100
degradation
Thermohaline Kelps transitions
circulation Forest to Savannas
Soil
0
Eutrophication salinization
Fisheries collapse
Bivalves
0 0.4 0.8 Encroachment collapse
Value Salt marshes Peatlands
Marine foodwebs Hypoxia
Tundra to Forest Floating plants
River channel
Greenland change
Termohaline circulation
Average Degree in simulated
Salt marshes Regime Shifts Networks
0.7
Marine foodwebs
Fisheries collapse
0.6
Soil structure
0.5
River channel change
0.4
Density
Floating plants
0.3
Peatlands
Coral transitions
0.2
Kelps transitions
0.1
Bivalves collapse
0.0
Eutrophication
12 13 14 15 16 17 18 19
Hypoxia Mean Degree
Forest to savannas
Regime Shifts Network
Dry land degradation Co−occurrence Index
Encroachment
0.8
Monsoon weakening
Soil salinization
0.6
River channel change
Floating plants
Tundra to Forest
Soil structure
Greenland
Termohaline circulation
Salt marshes
Marine foodwebs
Fisheries collapse
Peatlands
Coral transitions
Kelps transitions
Bivalves collapse
Eutrophication
Hypoxia
Forest to savannas
Dry land degradation
Encroachment
Monsoon weakening
Soil salinization
Density
0.4
0.2
0.0
The co-occurrence of regime shifts is not random. Aquatic 8 9 10
s−squared
11 12 13
systems tend to share more drivers suggesting that their
underlying processes are also similar
18. ERGM models results
Parameters Base model Full model
Log-likelihood -84.6 -73.2
AIC 173.21 168.38 The likelihood of
Network structure
sharing
Edges -0.70 0.52
Edges covariates drivers increase
Regime Shift Database 6.95 **
when regime
Ecosystem services -1.54
Ecosystem processes -1.47 shifts happen in
Human well being -0.34 the same
ecosystem and
Ecosystem type 2.59 *
Land use 2.69 ·
Scale -0.54 under similar land
use practices.
Reversibility 2.63 **
Evidence 1.6 *
Mechanism 0.02
Existence 0.27
19. Upwellings Precipitation
Erosion
Fishing
300
Nutrients inputs
Irrigation
250
Atmospheric CO2 Agriculture
Number of links
Demand
200
Global warming
Human population
Fertilizers use
150
Urbanization
100
Deforestation
ENSO like events Sewage
50
Droughts
Floods
0
1 2 3 4 5 6 7 8 9 10
Number of Regime Shifts jointly caused
Drivers Network Agriculture and Climate change
20. Upwellings Precipitation
Erosion
Fishing
300
Nutrients inputs
Irrigation
250
Atmospheric CO2 Agriculture
Number of links
Demand
200
Global warming
Human population
Fertilizers use
150
Urbanization
100
Deforestation
ENSO like events Sewage
50
Droughts
Floods
0
1 2 3 4 5 6 7 8 9 10
Number of Regime Shifts jointly caused
Drivers Network Agriculture and Climate change
21. Color Key Upwellings
Erosion Precipitation
and Histogram
Count Drivers
0 1000
Fishing
Nutrients inputs
Irrigation
Atmospheric CO2 Agriculture
Demand
Global warming
Human population
Marine General Terrestrial
Fertilizers use
0 0.4 0.8
Value Urbanization
Deforestation
ENSO like events Sewage
Droughts
Turbidity
Floods
Disease
Pollutants
Sediments
Thermal anomalies in summer
Ocean acidification
Hurricanes
Average Degree in simulated
Low tides Drivers Networks
0.7
Water stratification
Impoundments
Rainfall variability
0.6
Landscape fragmentation
Flushing
Urban storm water runoff
0.5
Urbanization
Nutrients inputs
Fishing
0.4
Demand
Density
Deforestation
Human population
0.3
Agriculture
Erosion
Floods
0.2
Fertilizers use
Sewage
Production intensification
0.1
Food prices
Labor availability
Ranching (livestock)
0.0
Water infrastructure
Aquifers
Water availability 20 21 22 23 24 25 26
Upwellings Mean Degree
ENSO like events
Tragedy of the commons
Access to markets
Subsidies
Infrastructure development
Immigration Drivers Network
Logging Co−occurrence Index
Droughts
Fire frequency
6
Irrigation
Global warming
Atmospheric CO2
Precipitation
5
Fishing technology
Food supply
Invasive species
4
Sea level rise
Temperature
Density
Green house gases
Development policies
3
Drainage
Sea surface temperature
2
Turbidity
Disease
Pollutants
Sediments
Thermal anomalies in summer
Ocean acidification
Hurricanes
Low tides
Water stratification
Impoundments
Rainfall variability
Landscape fragmentation
Flushing
Urban storm water runoff
Urbanization
Nutrients inputs
Fishing
Demand
Deforestation
Labor availability
Ranching (livestock)
Human population
Agriculture
Erosion
Floods
Fertilizers use
Sewage
Production intensification
Food prices
Water infrastructure
Aquifers
Water availability
Upwellings
ENSO like events
Tragedy of the commons
Access to markets
Subsidies
Infrastructure development
Immigration
Logging
Droughts
Fire frequency
Irrigation
Global warming
Atmospheric CO2
Precipitation
Fishing technology
Food supply
Invasive species
Sea level rise
Temperature
Green house gases
Development policies
Drainage
Sea surface temperature
The co-occurrence of driver is not random. Drivers tend to
1
cluster according to the ecosystem type where the regime
0
1.4 1.5 1.6 1.7 1.8 1.9 2.0 2.1
shift takes place.
s−squared
22. Work in Progress
Causal Networks of Regime Shifts
Causal-loop diagrams is a
technique to map out the
feedback structure of a system
(Sterman 2000)
23. Topological features of Causal Networks
Degree centrality Betweenness centrality Eigenvector centrality
24. 1. What are the major global change
drivers of regime shifts?
80
60
Numbervertex vertex
Number vertexvertex
50
60
40
of
Number of of
Number of
40
30
20
20
10
0
0
1 2 3 4 5 6 7 8 9 11 12 14 15 17 0 1 2 3 4 5 6 7 8 9 10 11 12 13 14 19 22
Outgoing links
Outdegree
Incoming links
Indegree
Few nodes have a lot of links!
Editor's Notes
\n
human population has grown six-fold, the world’s economy 50-fold and energy consumption 40-fold (Steffen et al. 2007)\n\n
methods from physics and social sciences applied to medicine to figure out multicausality patterns.\n
\n
\n
\n
\n
sequential importance sampling algorithm\n89 variables coded on the RSDB\n
20RS - 55 Drivers, 186 links, density 6.3%\n
82% density\n\nTop 5 RS in degree are in aquatic environments\n
Temperate areas are also strongly connected (tundra - greenland - thermohaline)\nMarine RS are tightly connected: water as a transport media for disturbances: turbidity, SST, pollutants, sediments, etc. \n
Purple: Marine Ecosystems\nBlue: Common to all types but also present in aquatic (marine + eutrophication and river change)\nOrange: More common on terrestrial ecosystems, less clustering, more context dependent for management.\n
CLD: consist on variables connected by arrows denoting causal influence. Each relationship must have a positive (+) or negative (-) polarity, intended to represent the effect of the dependent variable given a change in the independent variable. A positive link means that if the cause change, the effect will change in the same direction. A negative link means that if the cause change in one direction, the effect change in the opposite way. Closed paths thus conform the feedback mechanisms that could be reinforcing if their overall polarity is positive or balancing if negative.\n
19 Regime Shifts\n204 nodes, 529 links, Density: 0.017 or 17%\nDegree:The number edges a vertex is connected to (Newman 2010): In-degree and Out-degree\nBTW: The extent to which a vertex lies on paths between other vertices\nEigenvector: A vertex is important if it is directly or indirectly connected to other vertices that are in turn important\n\n
Outdegree: Variables which have a lot of causal links to other variables.\nIndegree: Variables hard to manage because they receive a lot of causal connections\n
Few nodes have a lot of links!\nMost connections are positive.\n