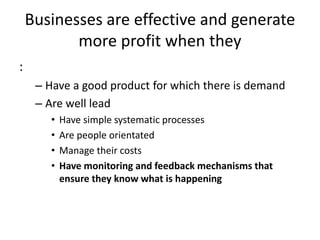
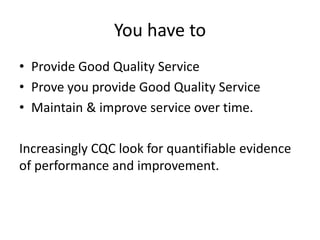
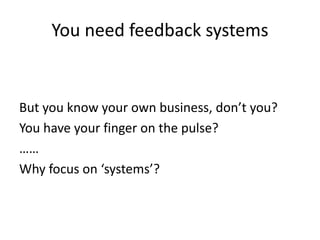
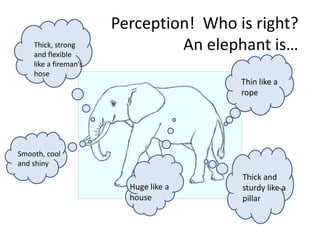
Download to read offline


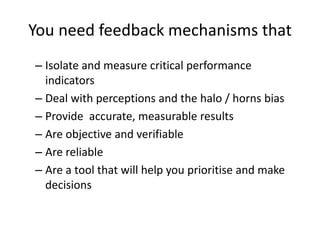
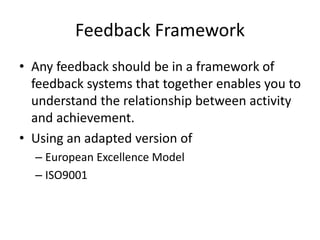
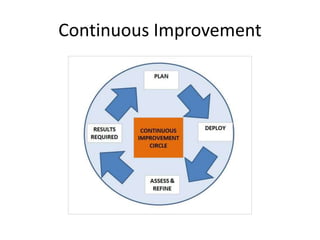
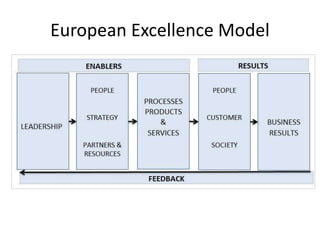
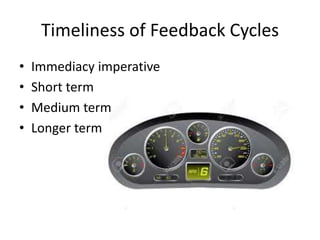
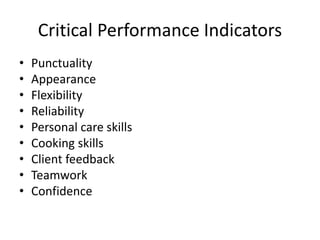
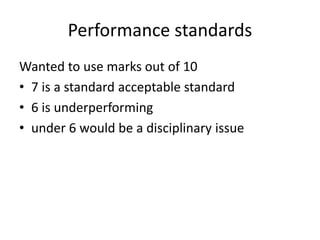
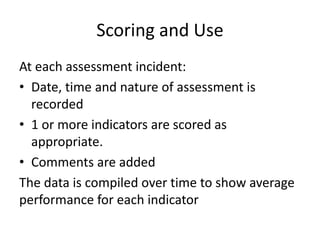
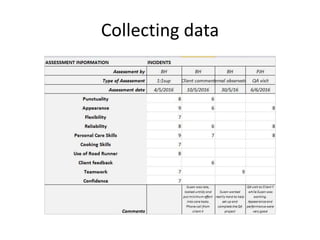
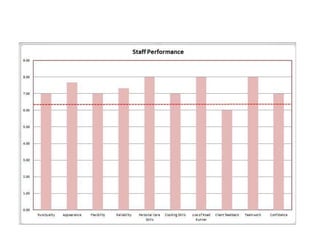


The document emphasizes the importance of service quality in business, particularly in the care sector, highlighting the need for effective feedback mechanisms to bridge gaps between perceived and actual service quality. It outlines various performance indicators and auditing processes to assess and improve service quality, while stressing the significance of stakeholder engagement and continuous improvement. Additionally, it discusses tools and frameworks like the European Excellence model and ISO9001 for measuring and enhancing performance, thereby ensuring that services meet established standards and client expectations.


![Cells and Organs of immune system [Autosaved].pptx](https://cdn.slidesharecdn.com/ss_thumbnails/cellsandorgansofimmunesystemautosaved-260123152717-ea0cb261-thumbnail.jpg?width=640&height=640&fit=bounds)


![APPROACH TO FEVER IN PEDIATRICS[1].pptTT](https://cdn.slidesharecdn.com/ss_thumbnails/approachtofeverinpediatrics1-260125081456-d559e079-thumbnail.jpg?width=640&height=640&fit=bounds)
![Hypothalamus short notes on location, function and disorders by Dr. Neha [PT]...](https://cdn.slidesharecdn.com/ss_thumbnails/hypothalamusbydr-260124142231-2b48143d-thumbnail.jpg?width=640&height=640&fit=bounds)


