Download to read offline


![31
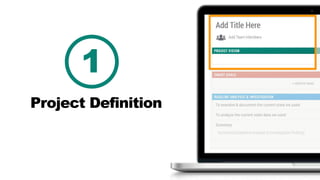
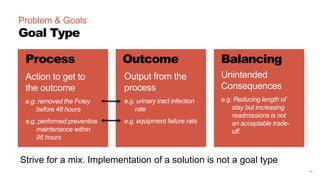
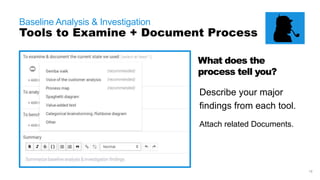
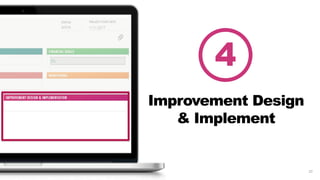
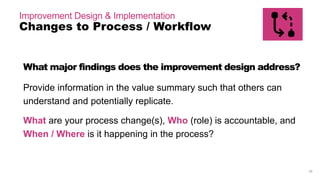
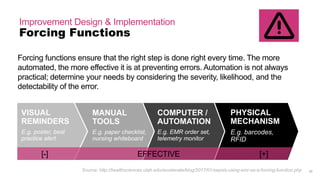
Improvement Design & Implementation
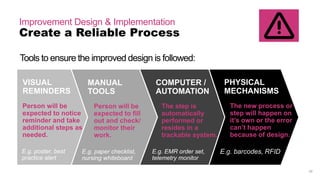
Forcing Functions
Forcing functions ensure that the right step is done right every time. The more
automated, the more effective it is at preventing errors. Automation (system) is not
always practical; determine your needs by considering the severity, likelihood, and
the detectability of the error.
MANUAL
TOOLS
E.g. paper checklist,
nursing whiteboard
COMPUTER /
AUTOMATION
E.g. EMR order set,
telemetry monitor
PHYSICAL
MECHANISM
E.g. barcodes,
RFID
VISUAL
REMINDERS
E.g. poster, best
practice alert
[-] EFFECTIVE [+]
Source: http://healthsciences.utah.edu/accelerate/blog/2017/01/sepsis-using-emr-as-a-forcing-function.php
PEOPLE FOCUSED SYSTEM FOCUSED](https://image.slidesharecdn.com/valuesummary2-170213172845/85/Value-Summary-2-0-Overview-31-320.jpg)


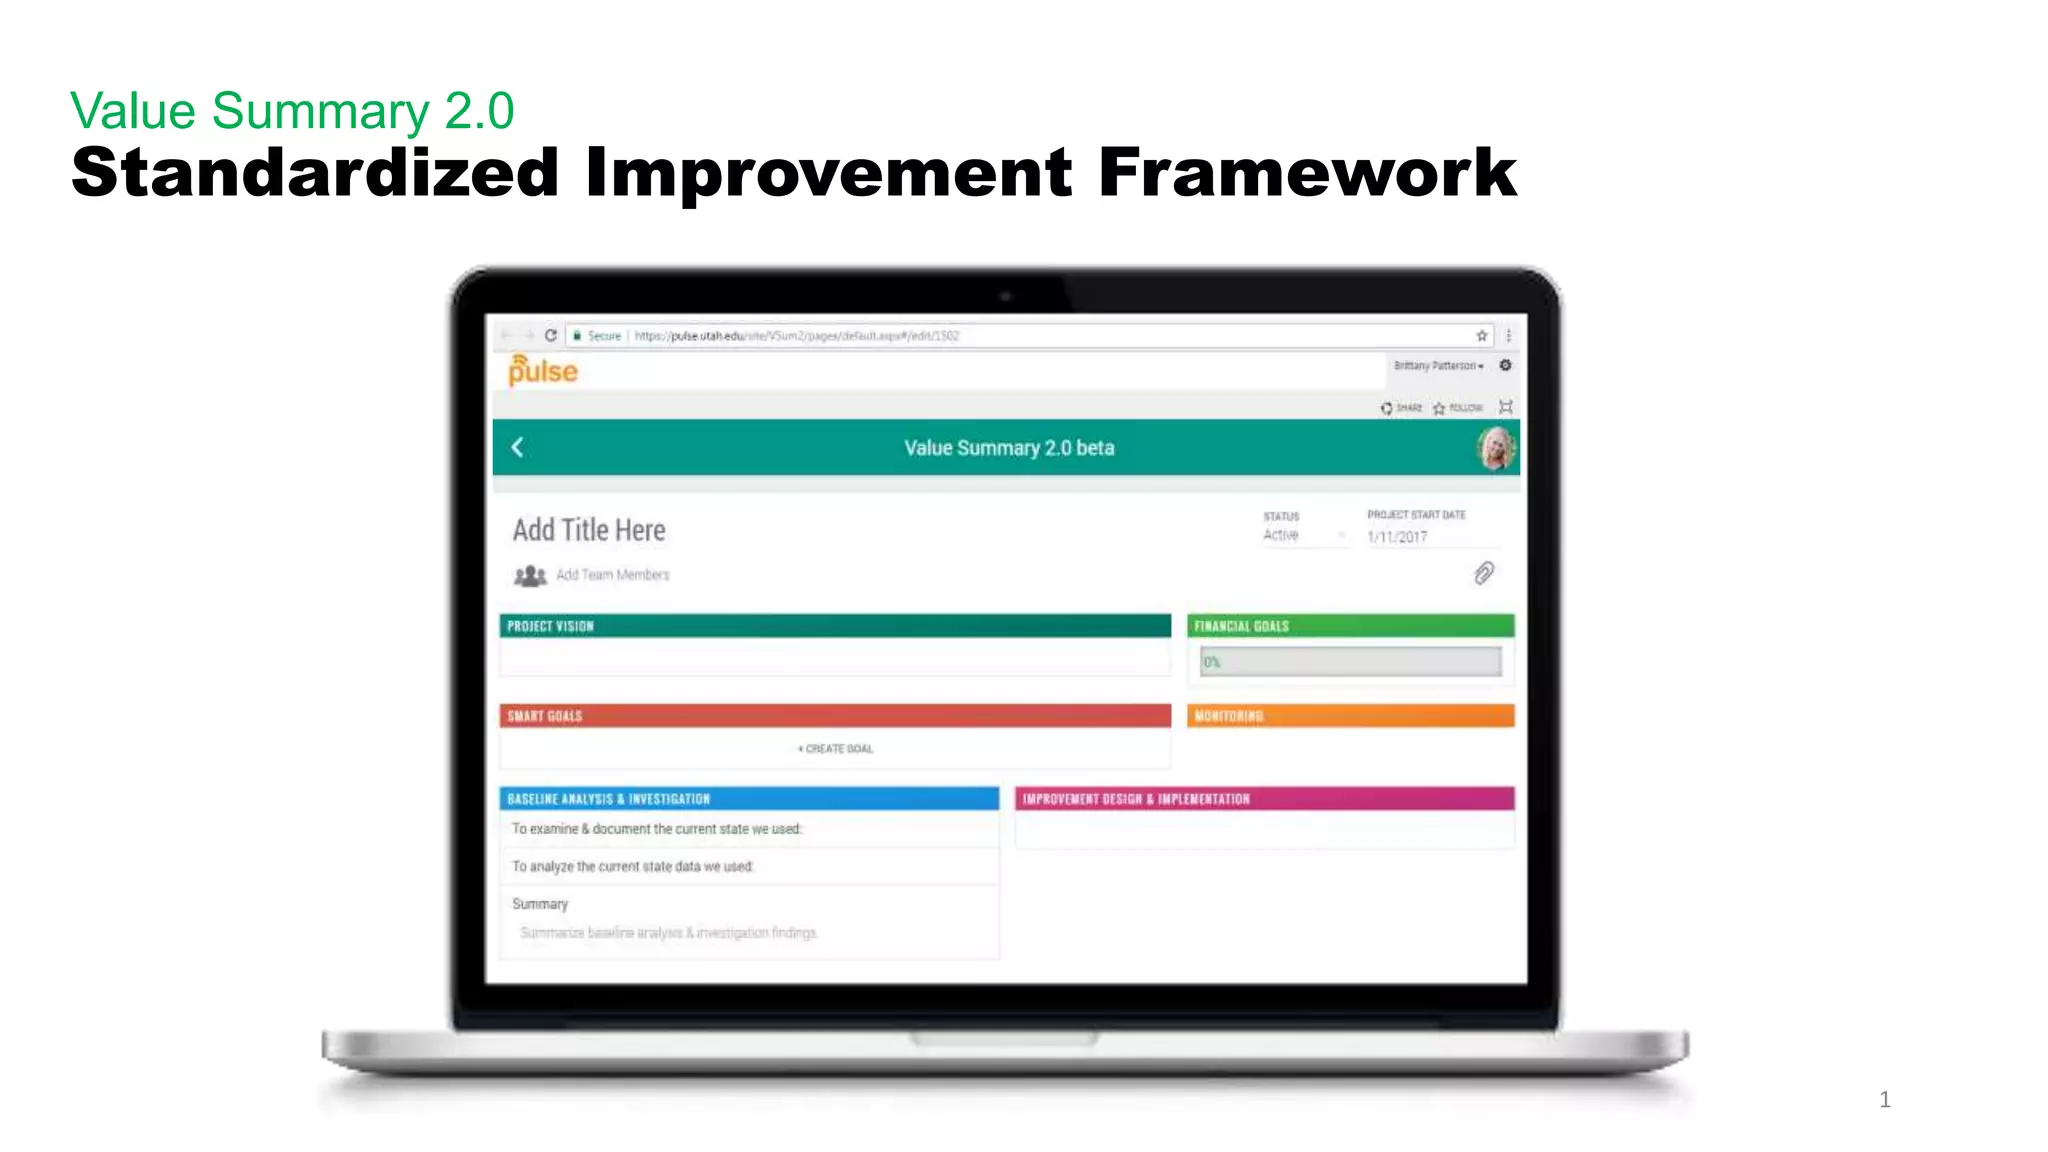
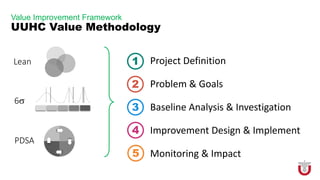
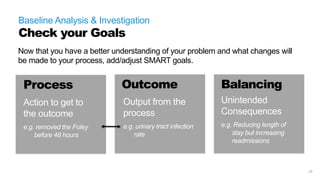
The document describes a standardized improvement framework called the Value Summary 2.0. It provides guidance on using the framework to define an improvement project, conduct a baseline analysis, design and implement changes, and monitor outcomes. The framework includes 5 sections - project definition, baseline analysis and investigation, improvement design and implementation, and monitoring and impact. Each section contains elements to address such as defining SMART goals, examining current processes, identifying root causes, designing reliable new processes, and continuously measuring metrics. The framework is intended to promote structured, evidence-based process improvement work.


