Download as PDF, PPTX


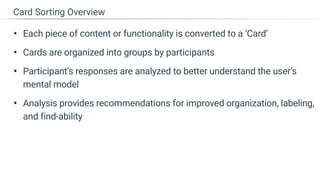
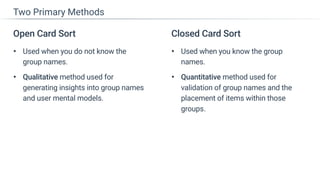

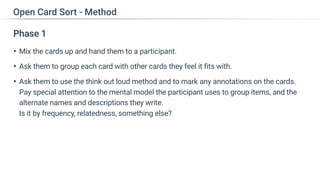
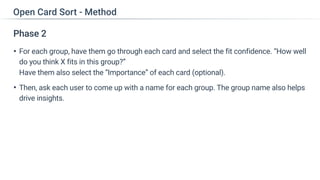
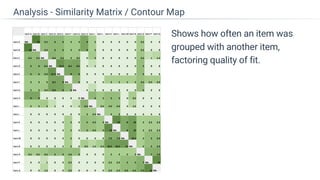


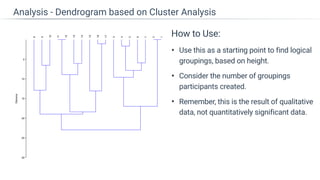


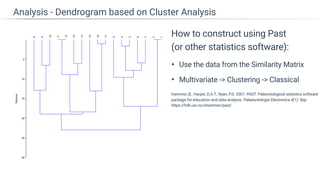


Card sorting is a technique used to understand how users mentally organize information by having them physically sort topics into categories. It involves converting content into cards that participants group, which provides insights into their mental models. Analysis of the card sorts reveals how users naturally cluster topics, which can then be used to improve an organization's structure, labeling, and findability.