
Download to read offline
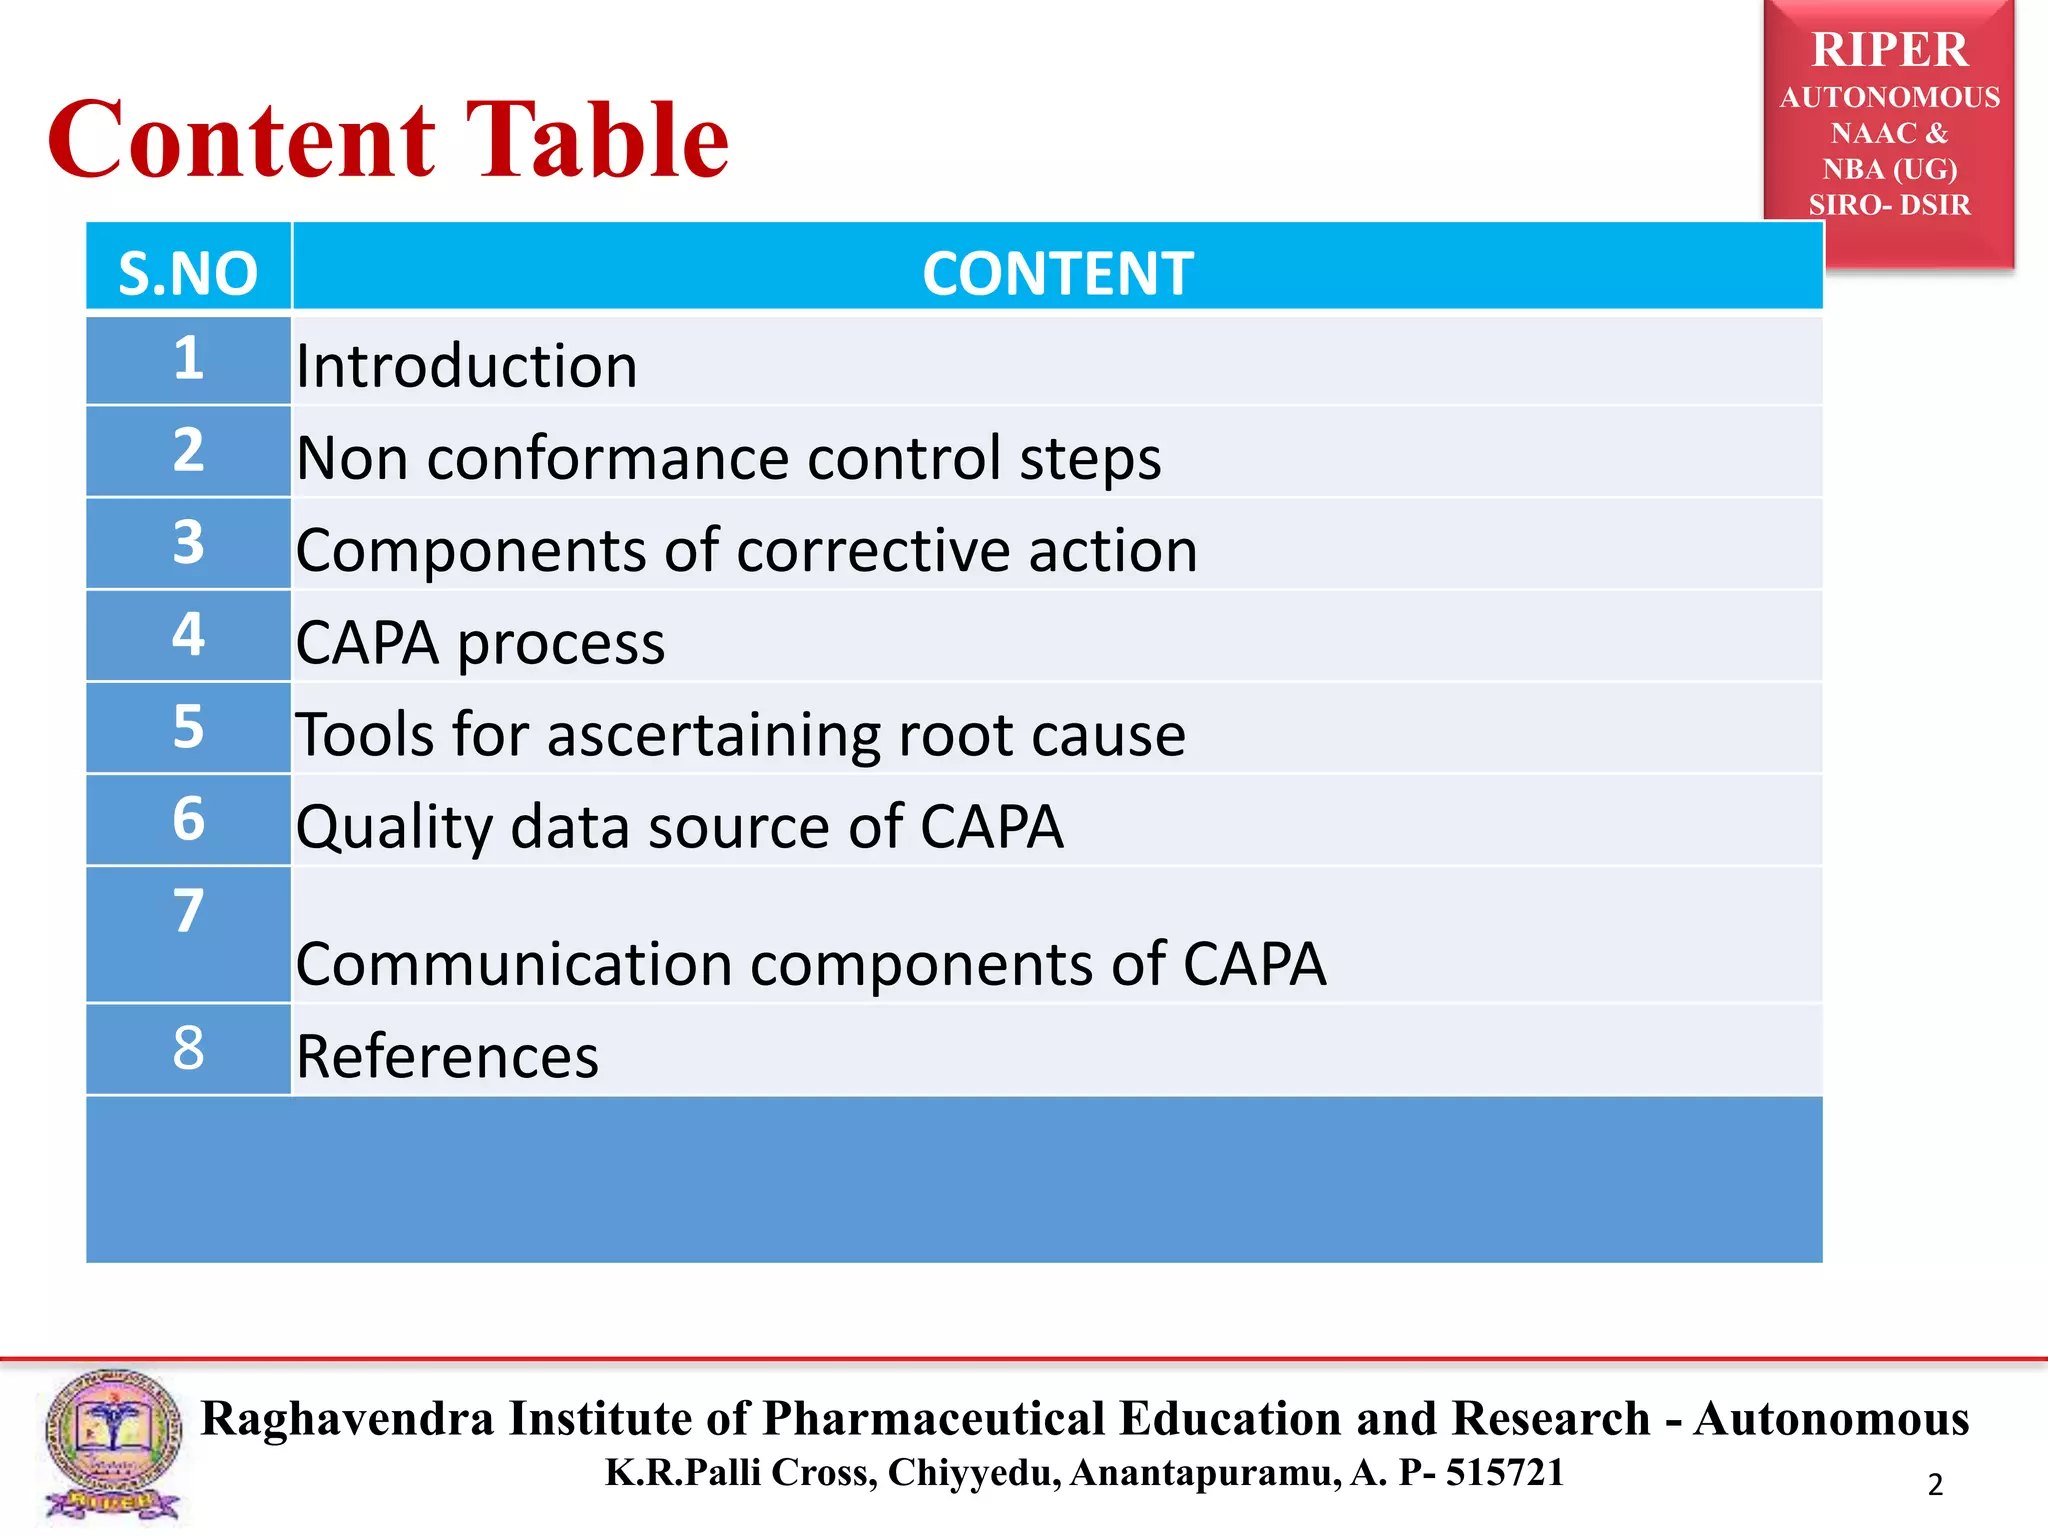
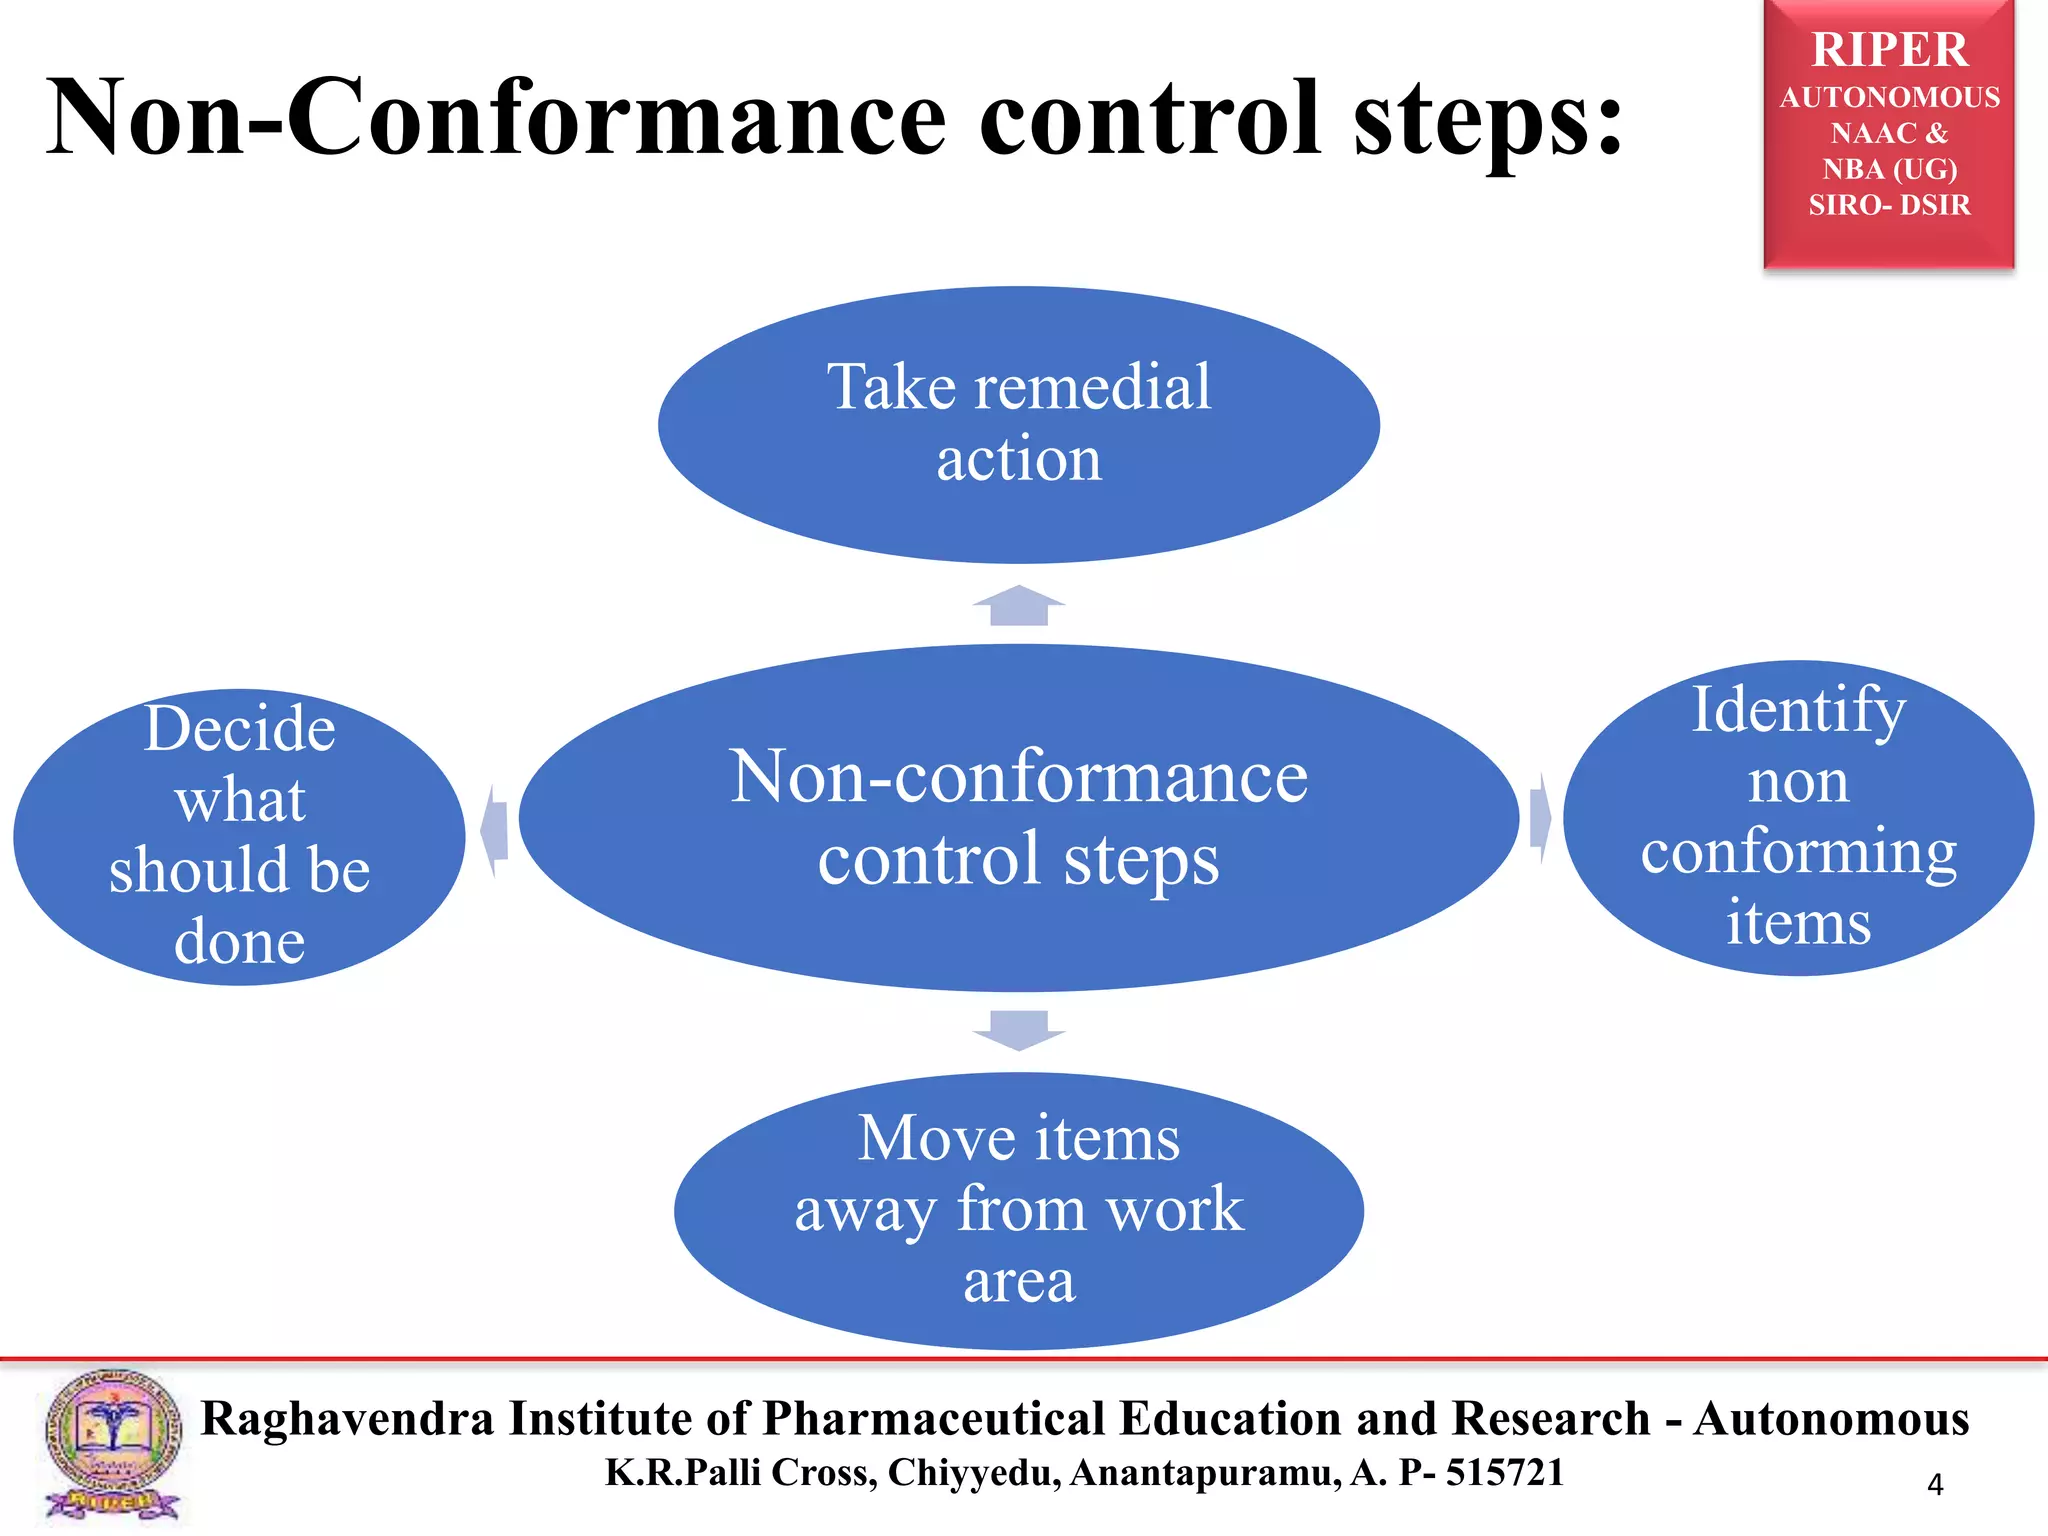
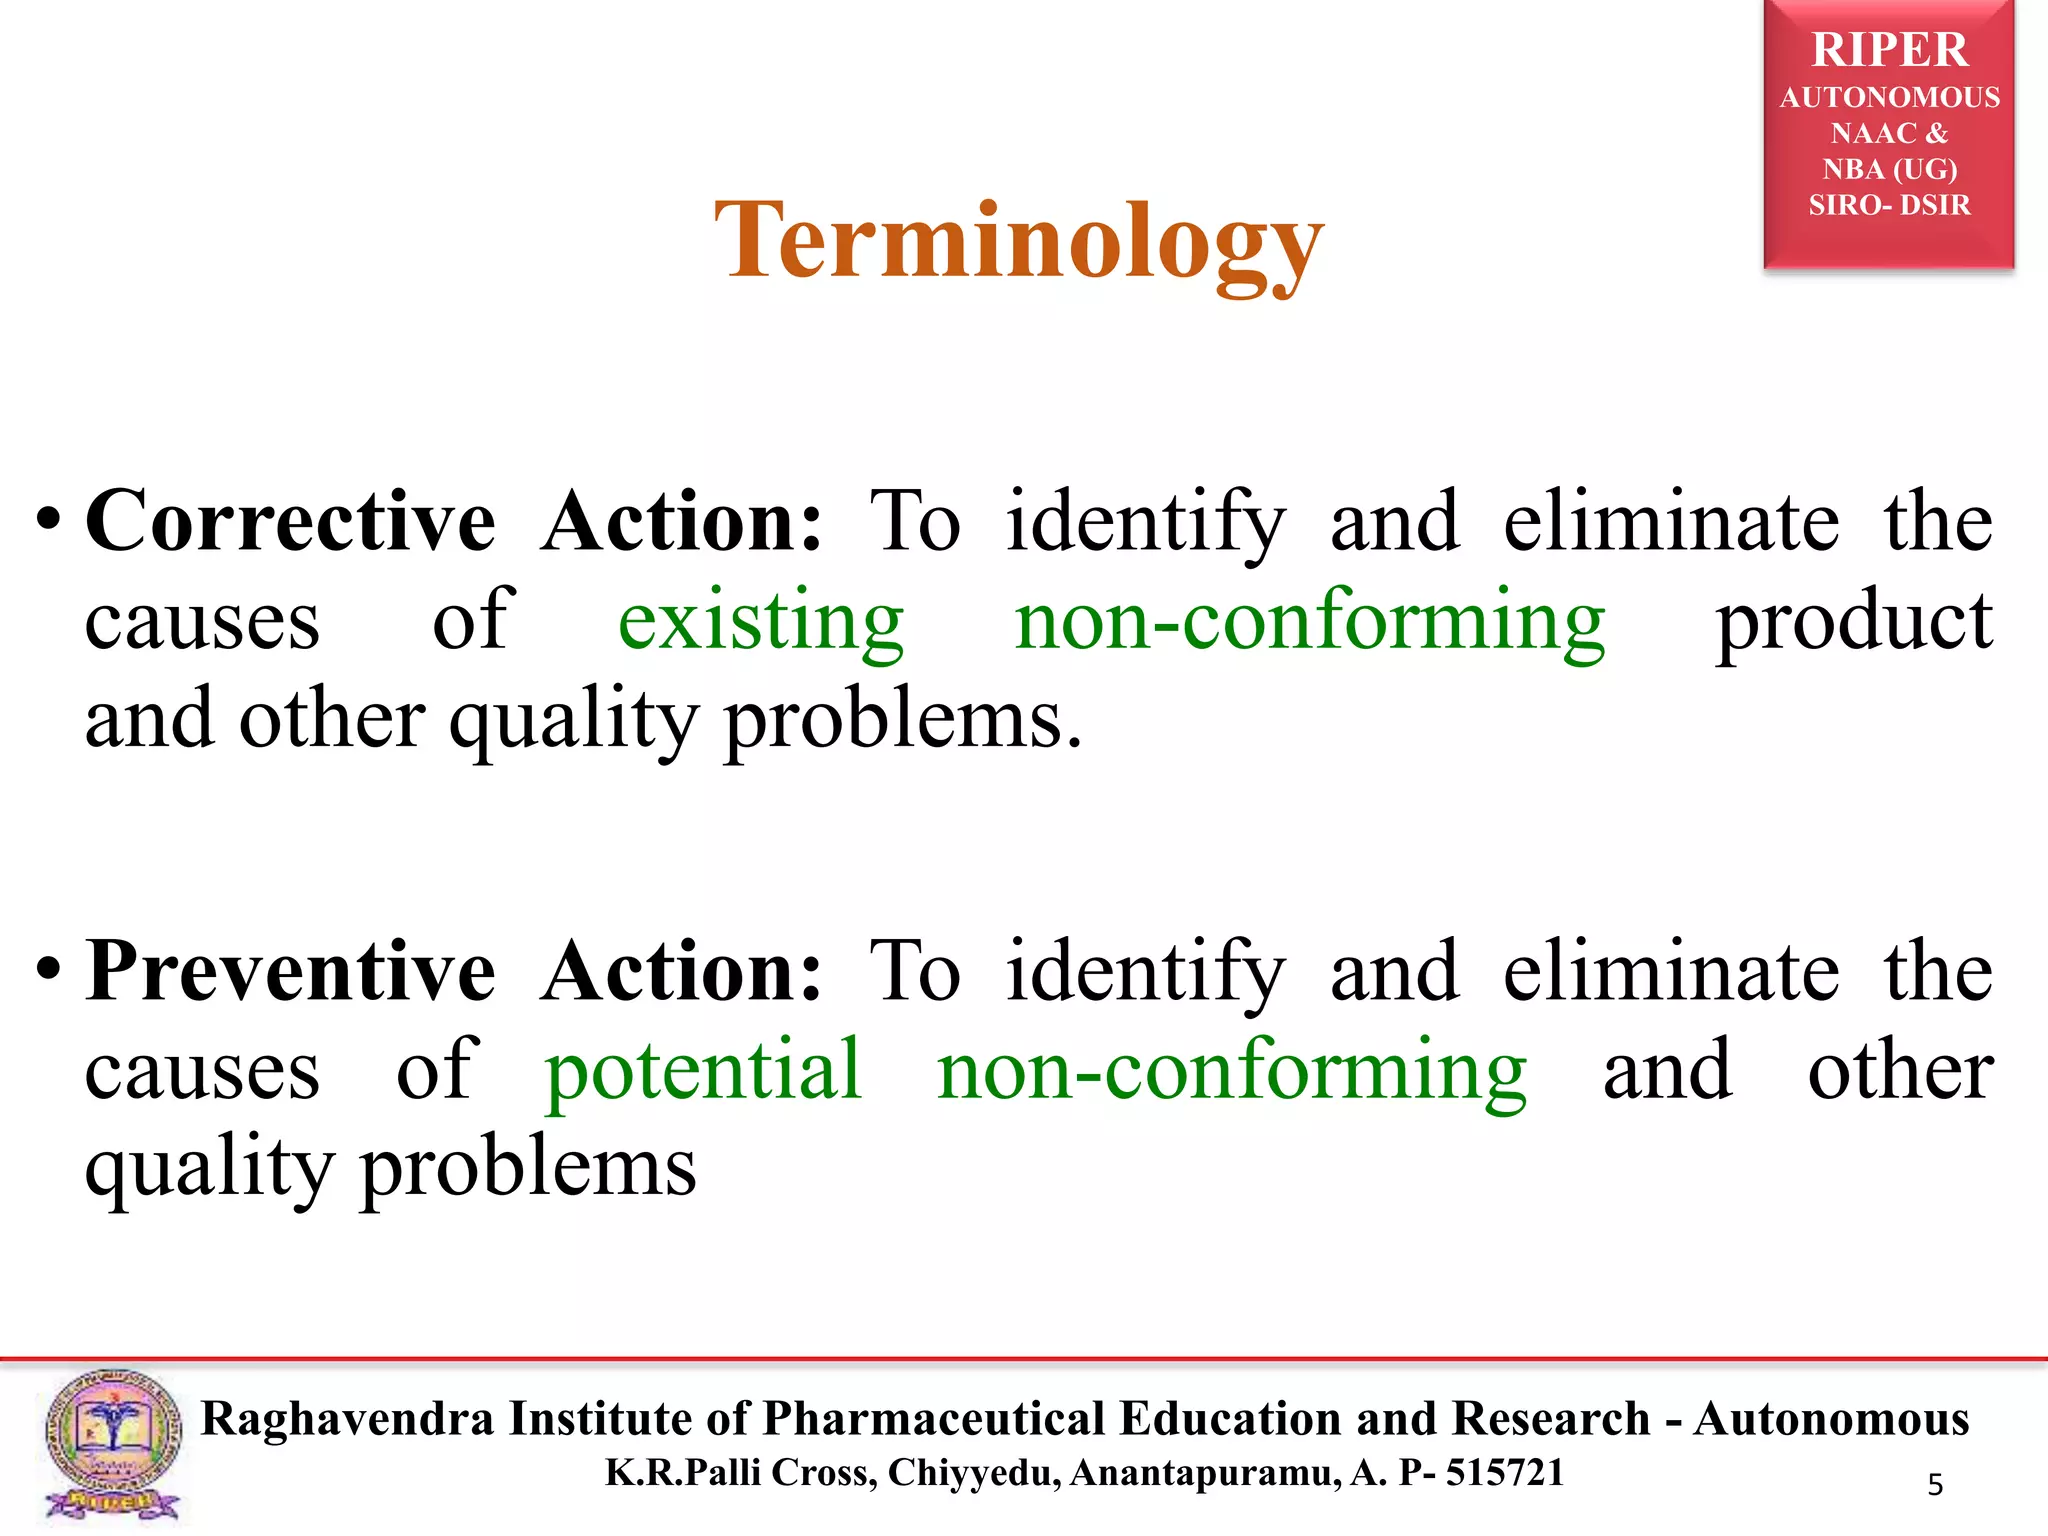

1) The document discusses Corrective Action and Preventive Action (CAPA), which is a system used to eliminate causes of non-conforming products and prevent future issues. 2) It describes the CAPA process, components of corrective action, tools for root cause analysis like fishbone diagrams and FMEA, and quality data sources used for CAPA. 3) The presentation provides an overview of CAPA for a pharmaceutical quality assurance seminar.


