This document discusses polar coordinate systems and their relationship to Cartesian coordinates. It provides examples of plotting points, graphing polar equations, and converting between polar, Cartesian, and parametric representations of curves. Key topics covered include the polar coordinate system, converting between polar and Cartesian coordinates, graphing common polar curves like circles, cardiods, and lemniscates, classifying polar equations, and representing curves parametrically.
In this document
Powered by AI
Introduction to polar curves, definitions of polar coordinates (r, θ), and their relation to Cartesian coordinates.
Techniques for plotting points represented in polar coordinates, including conversion to rectangular coordinates with examples.
Introduction to polar equations, including their forms derived from Cartesian equations, such as lines and circles.
Step-by-step graphing of a cardioid polar equation, determining patterns, and plotting points within the interval [0°, 360°].
Finding values and graphing a lemniscate polar equation, including identifying restrictions on θ for accurate plots.
Exploration of the spiral of Archimedes through polar coordinates, focusing on plotting both positive and negative θ values.
Classification of various types of polar equations, focusing on circles and lemniscates and limaçons.
Introduction to parametric equations with examples related to plane curves, specifically discussing the cycloid.
Graphing the cycloid defined by parametric equations and creating a table of values for plotting.
• Sub:-calculus
• Topic:-Polar curve sketching and
relation among Cartesian,
parametric and polar coordinates.
Shroff S.R. Rotary Institute of Chemical Technology
Polar Coordinate System
If r > 0, then point P lies on the
terminal side of θ.
If r < 0, then point P lies on the
ray pointing in the opposite
direction of the terminal side of
θ, a distance |r| from the pole.
4.
Rectangular and PolarCoordinates
If a point has rectangular coordinates
(x, y) and polar coordinates (r, θ), then
these coordinates are related as follows.
5.
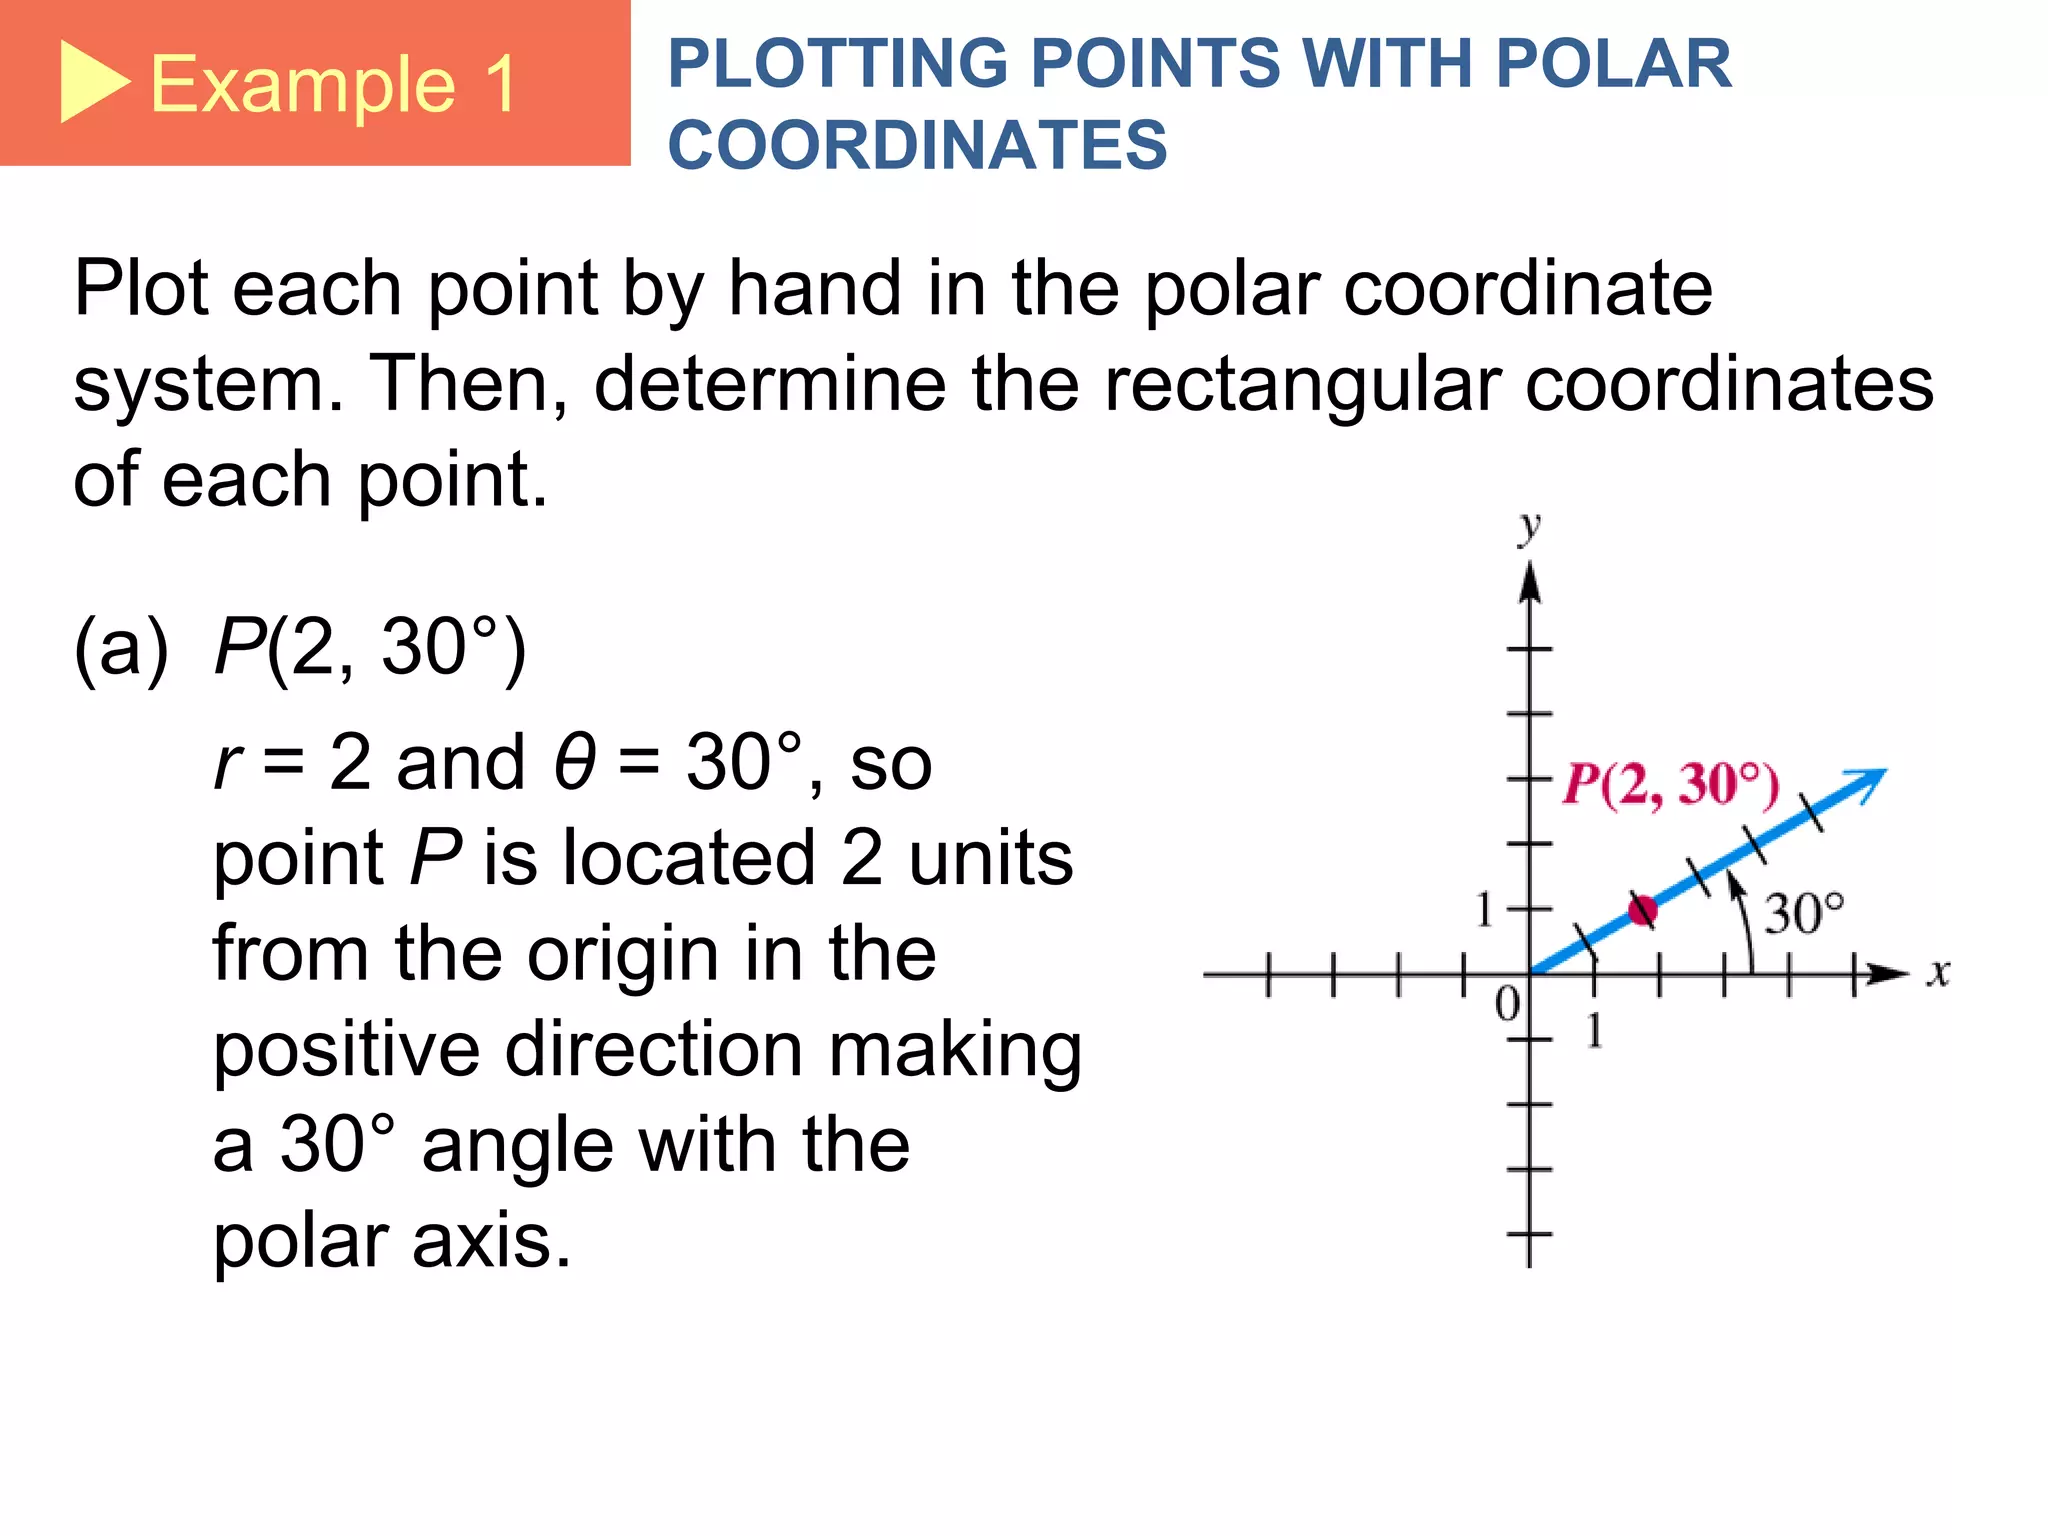
Example 1 PLOTTINGPOINTS WITH POLAR
COORDINATES
Plot each point by hand in the polar coordinate
system. Then, determine the rectangular coordinates
of each point.
(a) P(2, 30°)
r = 2 and θ = 30°, so
point P is located 2 units
from the origin in the
positive direction making
a 30° angle with the
polar axis.
6.
Example 1 PLOTTINGPOINTS WITH POLAR
COORDINATES (continued)
Using the conversion formulas:
The rectangular coordinates are
7.
Example 1 PLOTTINGPOINTS WITH POLAR
COORDINATES (continued)
Since r is negative, Q is 4
units in the opposite
direction from the pole on an
extension of the ray.
The rectangular coordinates are
8.
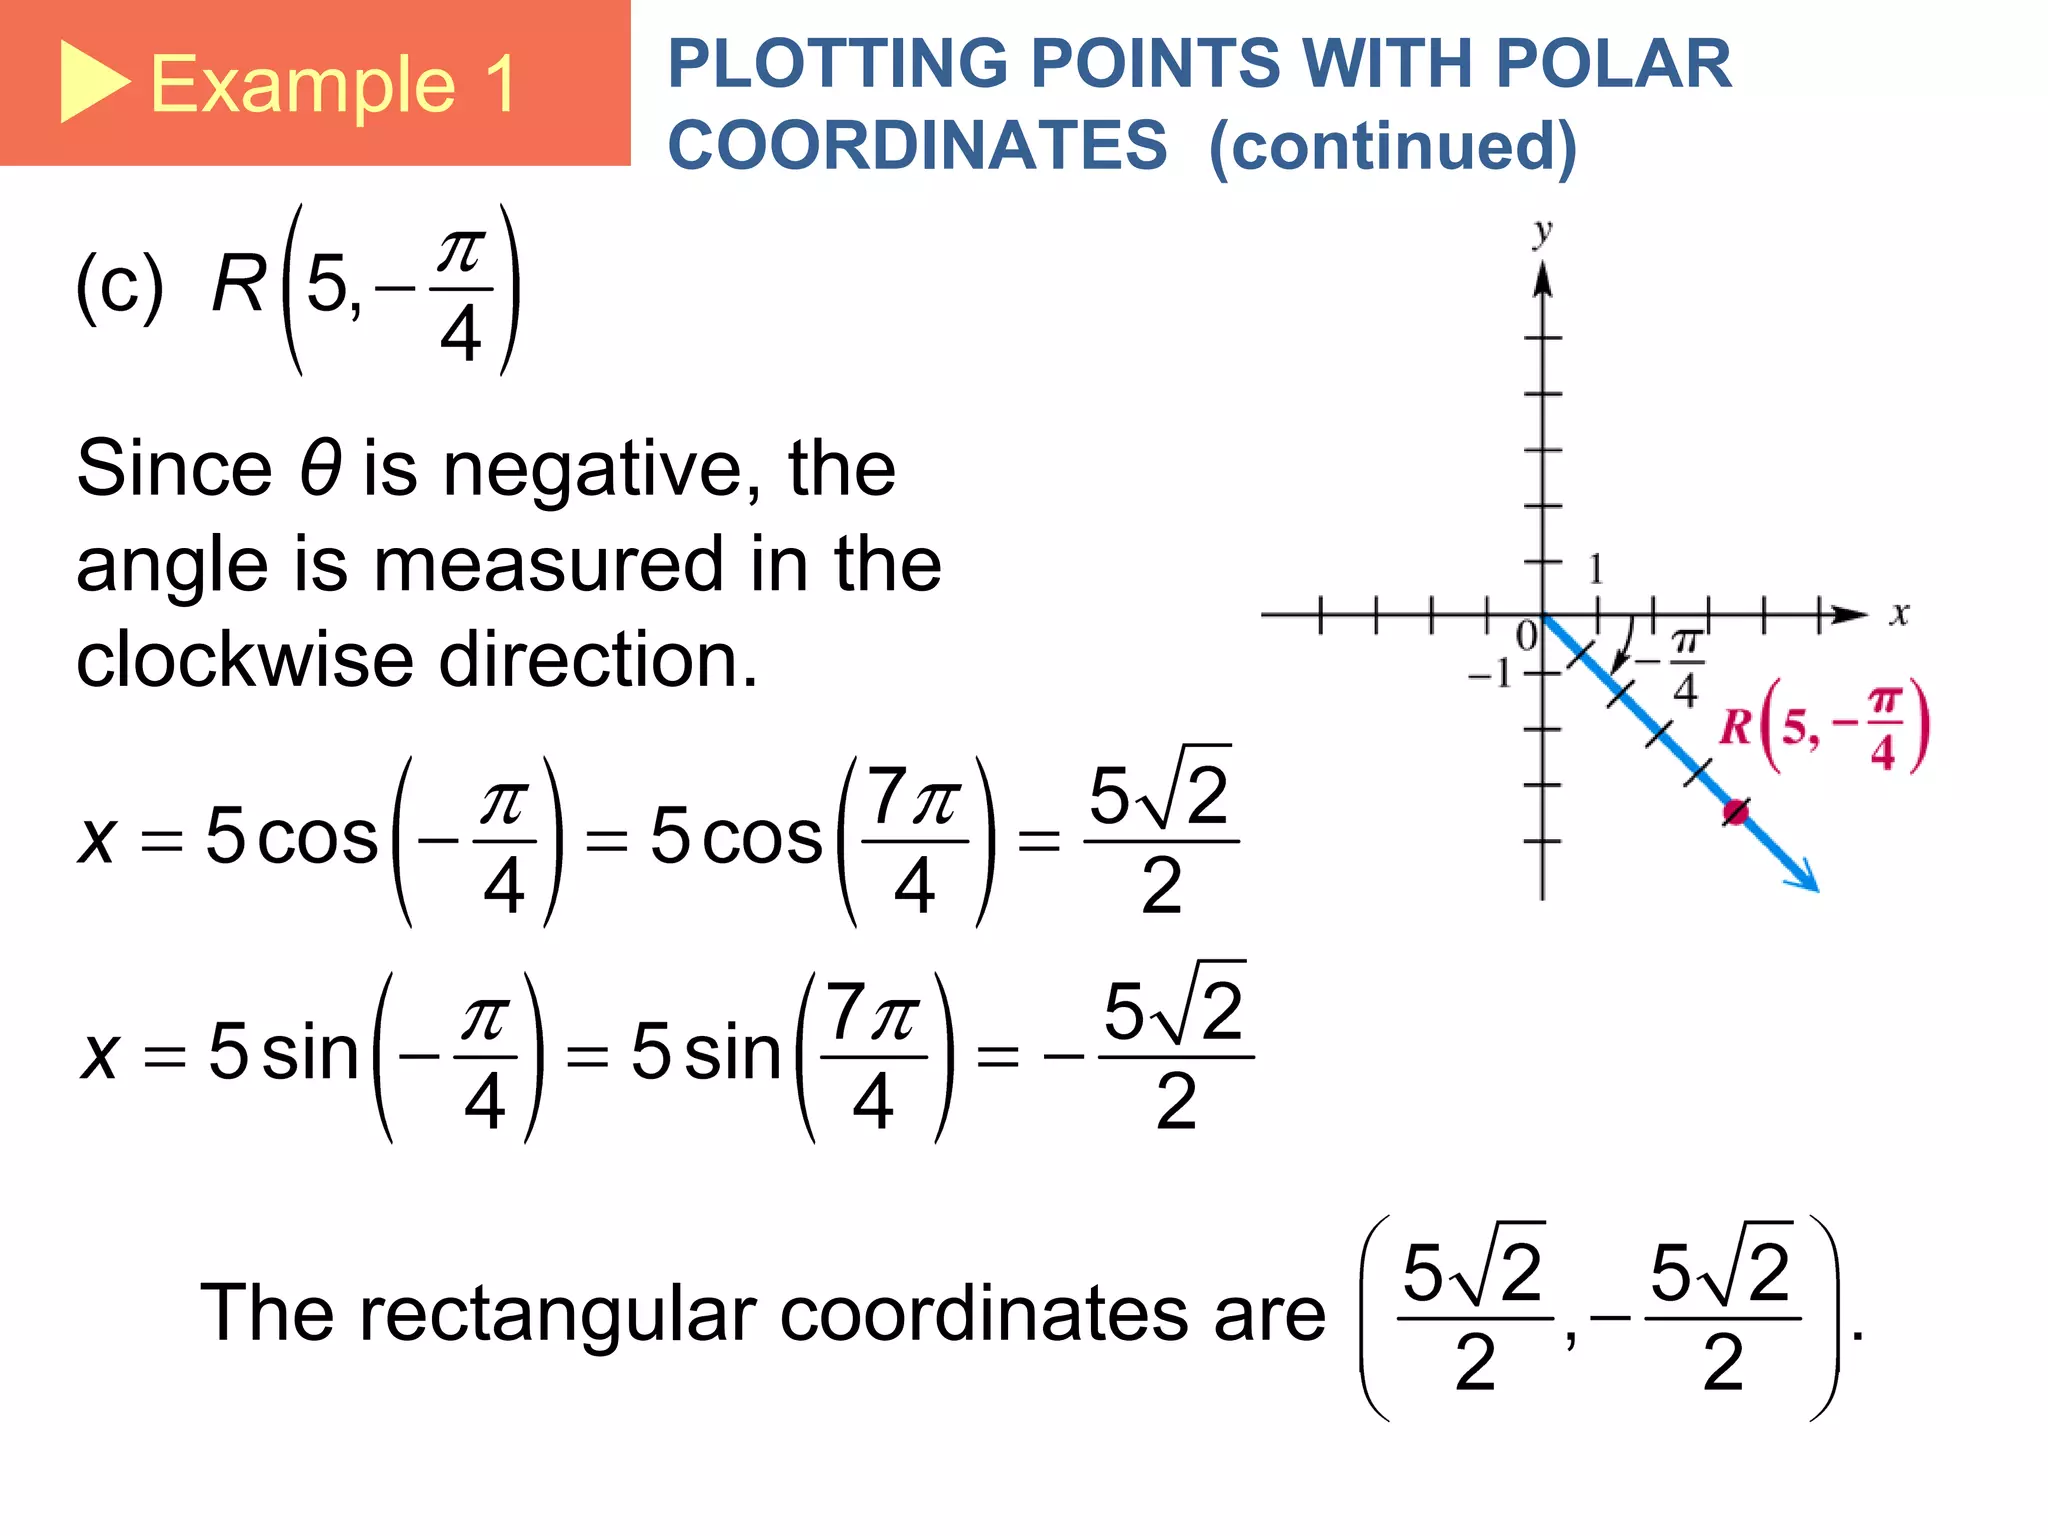
Example 1 PLOTTINGPOINTS WITH POLAR
COORDINATES (continued)
Since θ is negative, the
angle is measured in the
clockwise direction.
The rectangular coordinates are
9.
Graphs of PolarEquations
An equation in which r and θ are the variables is a
polar equation.
Derive the polar equation of the line ax + by = c as
follows:
General form for the
polar equation of a line
Convert from rectangular
to polar coordinates.
Factor out r.
10.
Graphs of PolarEquations
Derive the polar equation of the circle x2
+ y2
= a2
as
follows:
General form for the
polar equation of a circle
11.
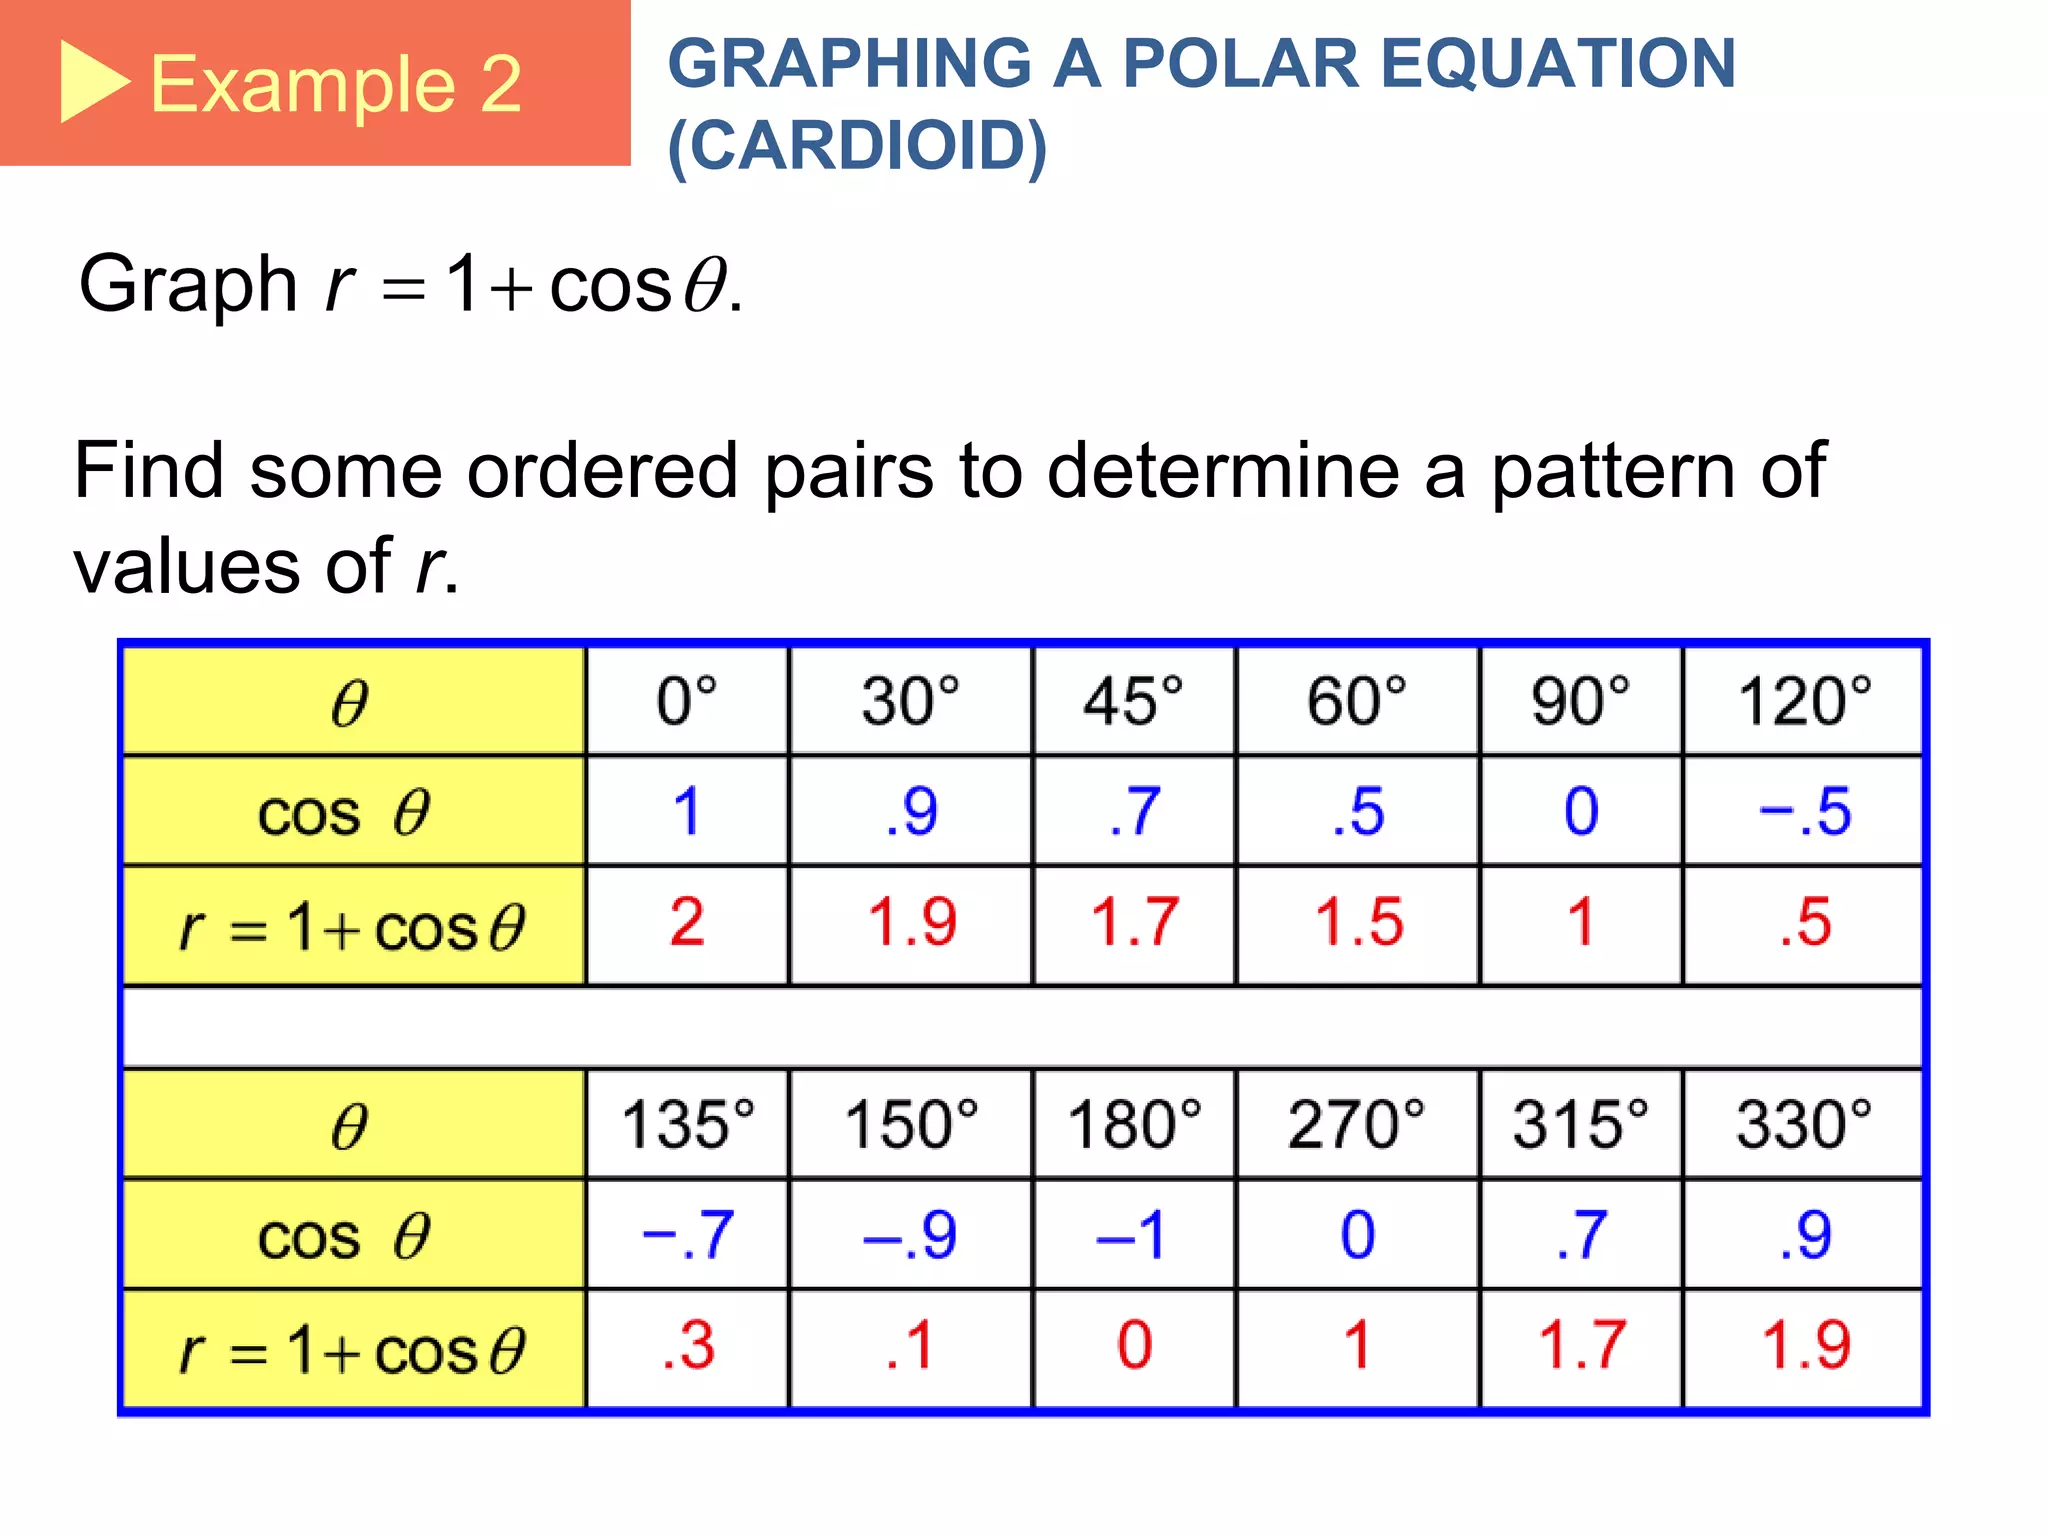
Example 2 GRAPHINGA POLAR EQUATION
(CARDIOID)
Find some ordered pairs to determine a pattern of
values of r.
12.
Example 2 GRAPHINGA POLAR EQUATION
(CARDIOID)
Connect the points in order from (2, 0°) to (1.9, 30°)
to (1.7, 48°) and so on.
13.
Example 2 GRAPHINGA POLAR EQUATION
(CARDIOD) (continued)
Choose degree mode and graph values of θ in the
interval [0°, 360°].
14.
Example 3 GRAPHINGA POLAR EQUATION
(LEMNISCATE)
Find some ordered pairs to determine a pattern of
values of r.
Graph .
Values of θ for 45° ≤ θ ≤ 135° are not included in the
table because the corresponding values of 2θ are
negative. Values of θ larger than 180° give 2θ larger
than 360° and would repeat the values already found.
Example 3 GRAPHINGA POLAR EQUATION
(LEMNISCATE) (continued)
To graph with a graphing calculator, let
17.
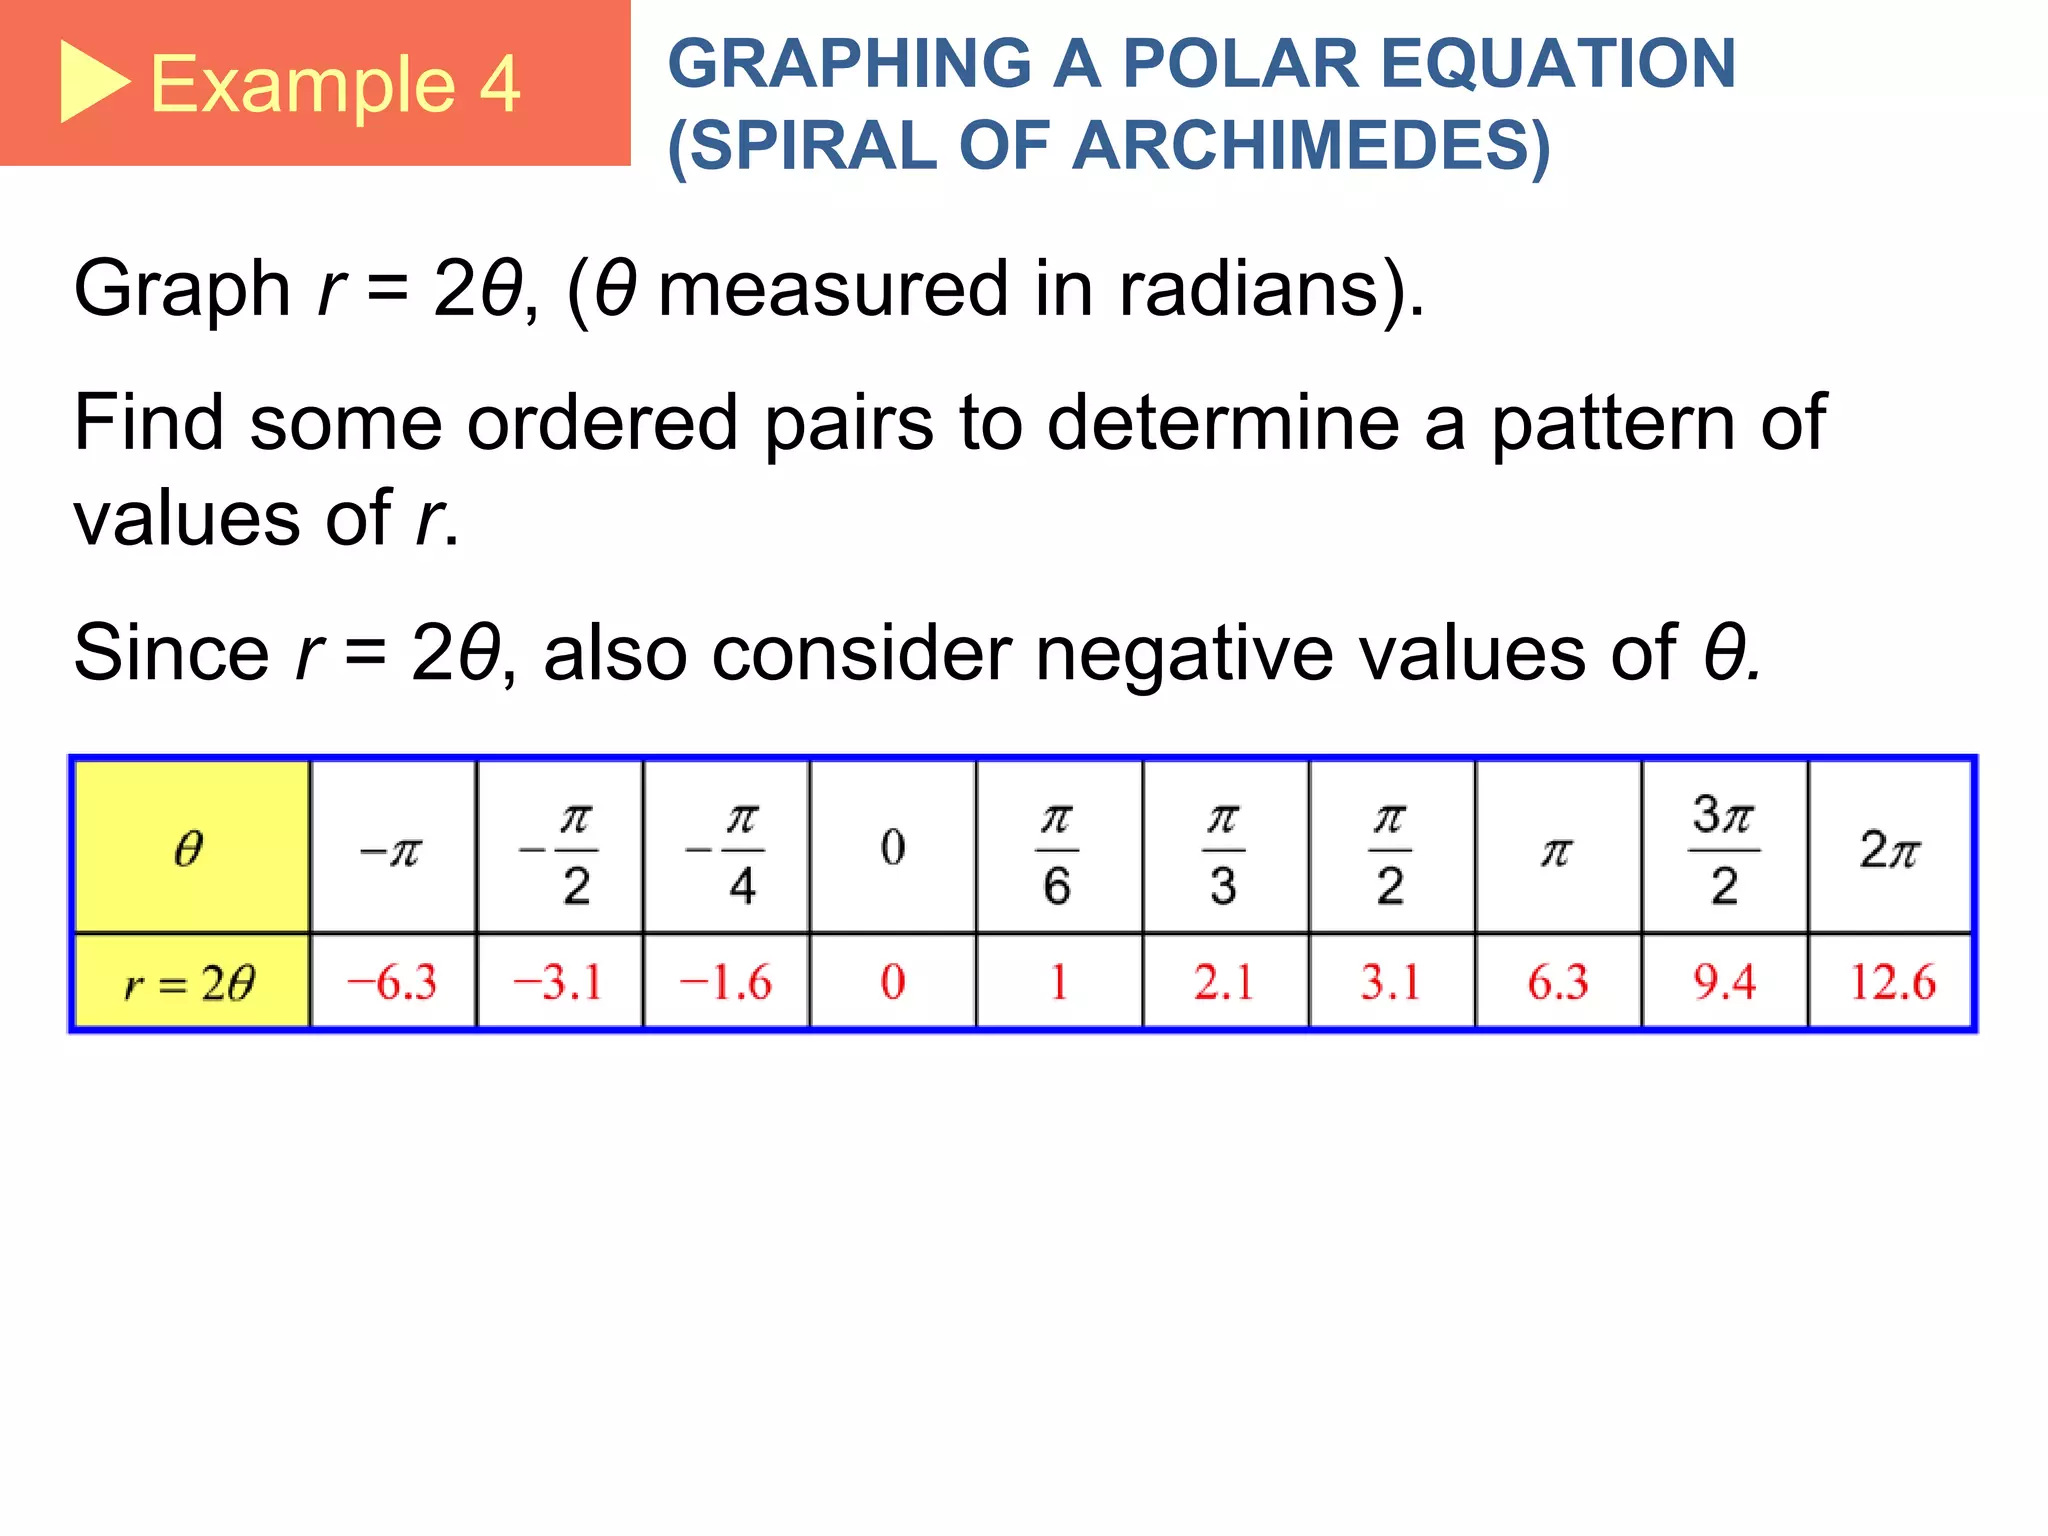
Example 4 GRAPHINGA POLAR EQUATION
(SPIRAL OF ARCHIMEDES)
Find some ordered pairs to determine a pattern of
values of r.
Since r = 2θ, also consider negative values of θ.
Graph r = 2θ, (θ measured in radians).
Parametric Equations ofa Plane Curve
A plane curve is a set of points (x, y)
such that x = f(t), y = g(t), and f and g are
both defined on an interval I.
The equations x = f(t) and y = g(t) are
parametric equations with parameter t.
22.
Example 5 FINDINGALTERNATIVE PARAMETRIC
EQUATION FORMS
Give two parametric representations for the equation
of the parabola
The simplest choice is
Another choice is
Sometimes trigonometric functions are desirable.
One choice is
23.
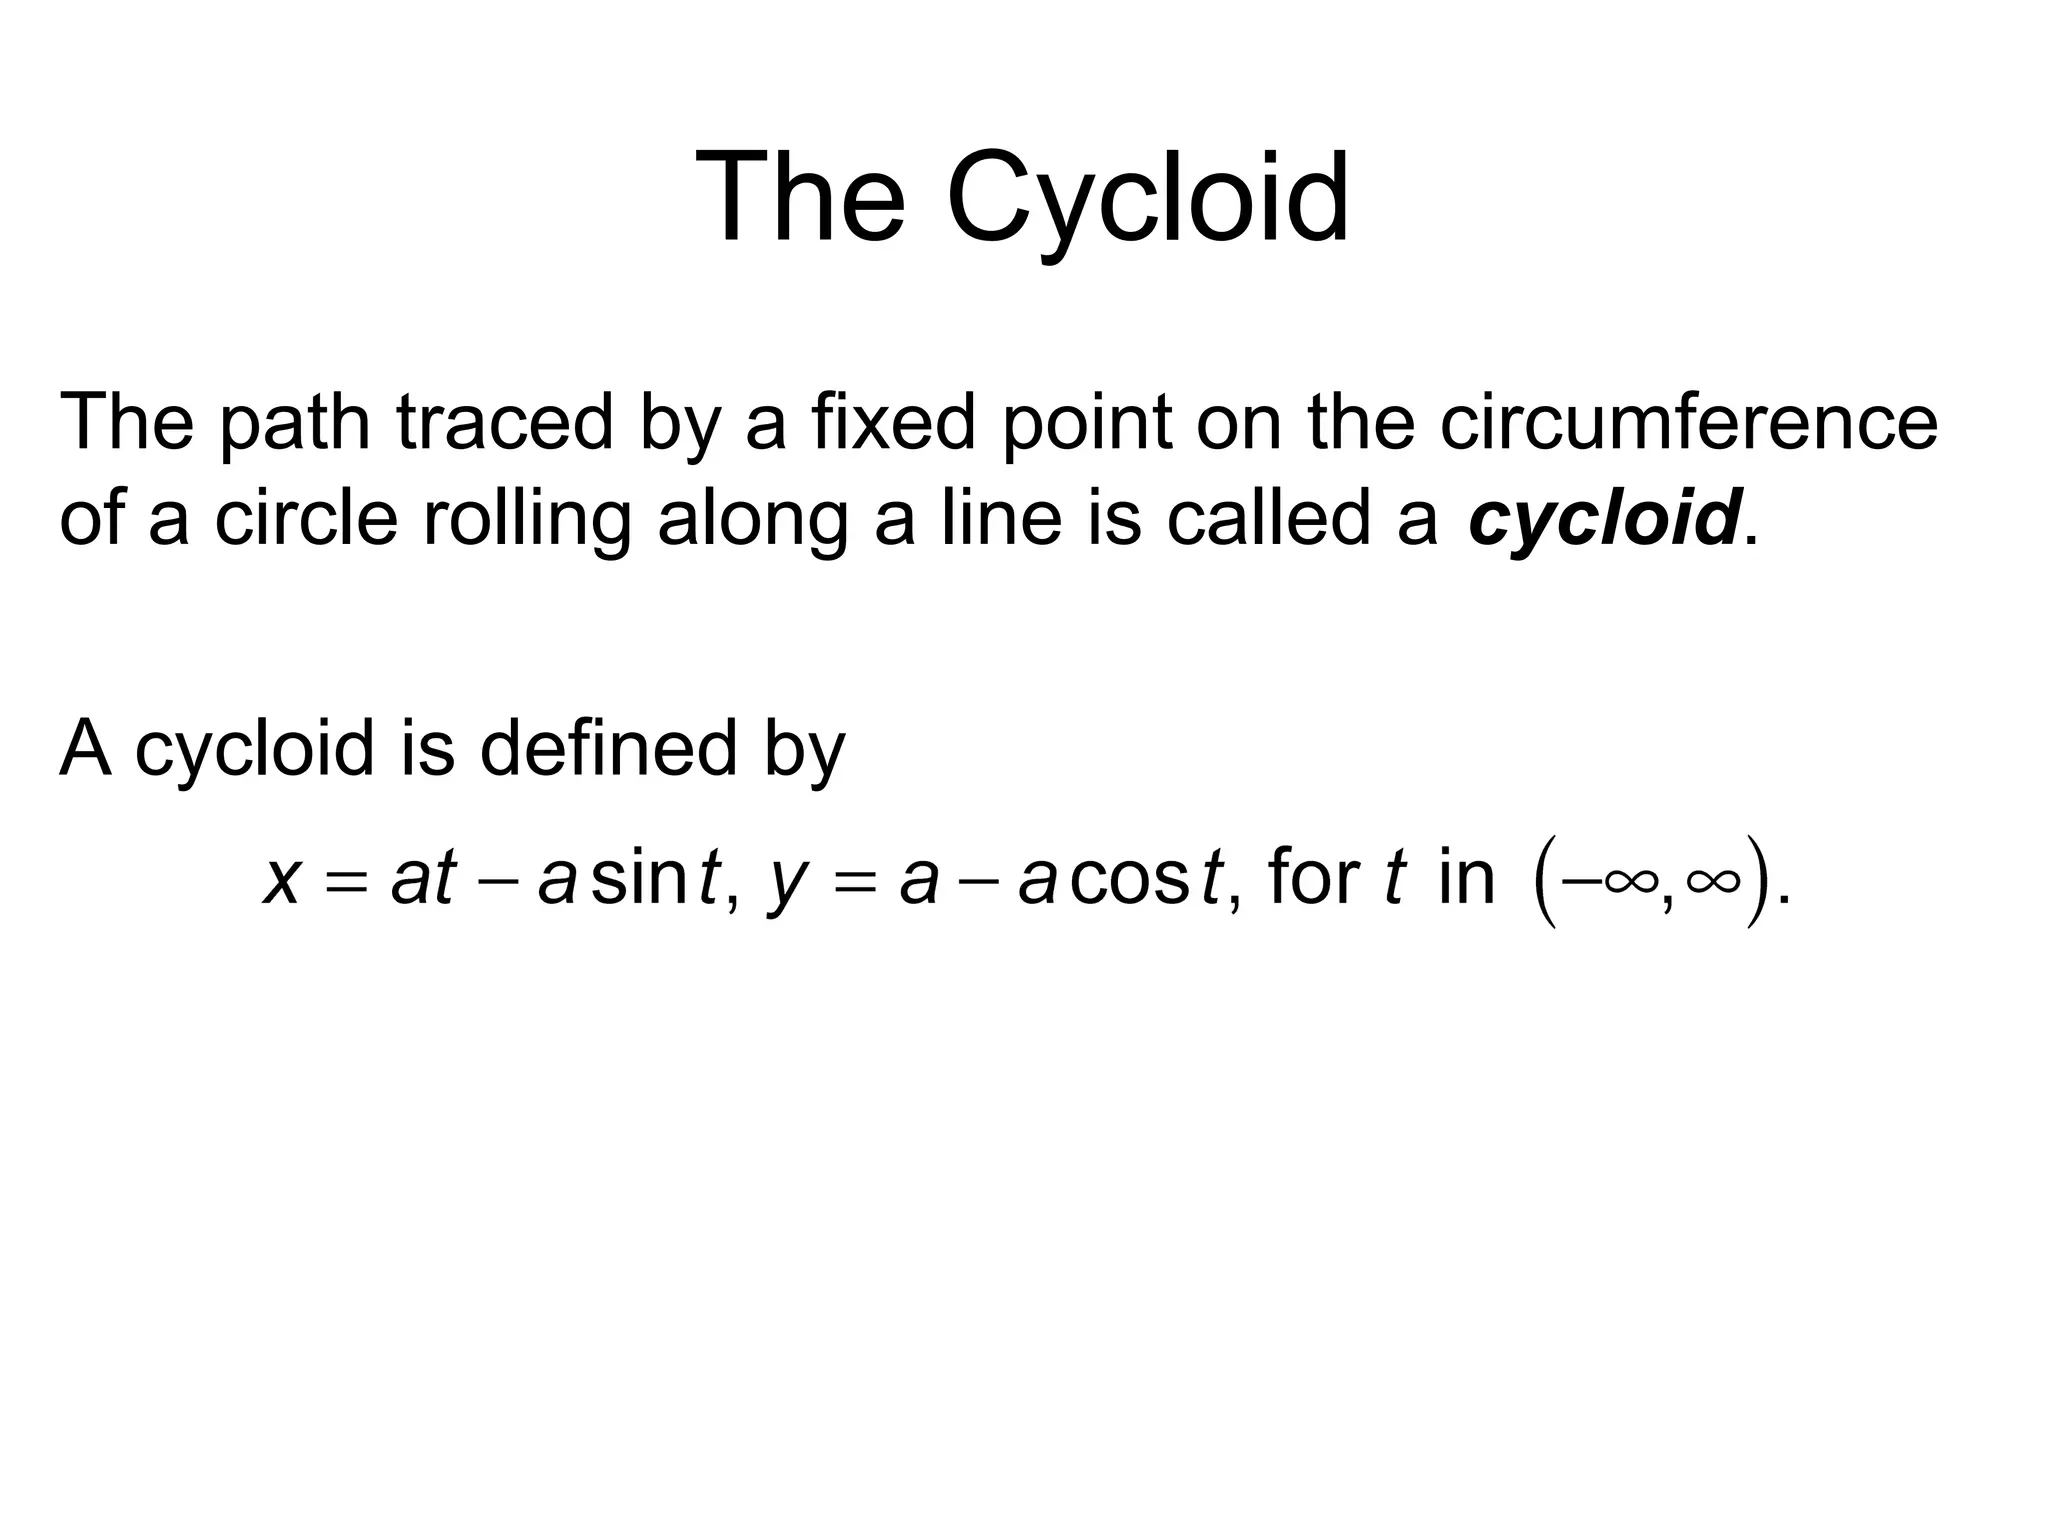
The Cycloid
The pathtraced by a fixed point on the circumference
of a circle rolling along a line is called a cycloid.
A cycloid is defined by
24.
Example 6 GRAPHINGA CYCLOID
Graph the cycloid x = t – sin t, y = 1 – cos t for
t in [0, 2π].
Create a table of values.
25.
1.1-25
Example 6 GRAPHINGA CYCLOID (continued)
Plotting the ordered pairs (x, y) from the table of
values leads to the portion of the graph for t in [0, 2π].


![Example 2 GRAPHING A POLAR EQUATION
(CARDIOD) (continued)
Choose degree mode and graph values of θ in the
interval [0°, 360°].](https://image.slidesharecdn.com/ppt-141224054600-conversion-gate02/75/calculus-Ppt-13-2048.jpg)


![Example 6 GRAPHING A CYCLOID
Graph the cycloid x = t – sin t, y = 1 – cos t for
t in [0, 2π].
Create a table of values.](https://image.slidesharecdn.com/ppt-141224054600-conversion-gate02/75/calculus-Ppt-24-2048.jpg)
![1.1-25
Example 6 GRAPHING A CYCLOID (continued)
Plotting the ordered pairs (x, y) from the table of
values leads to the portion of the graph for t in [0, 2π].](https://image.slidesharecdn.com/ppt-141224054600-conversion-gate02/75/calculus-Ppt-25-2048.jpg)