Download to read offline


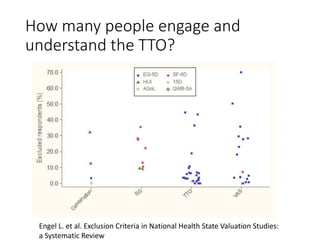
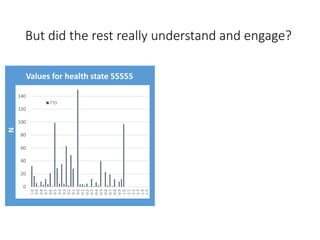

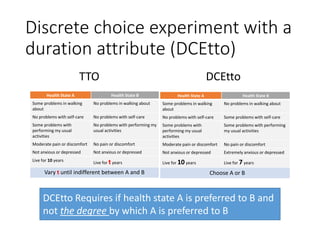


This document describes a study that used a discrete choice experiment with duration (DCEtto) to value health states described by the EQ-5D-5L instrument in Canada. It notes limitations of the traditional time trade-off (TTO) method, such as many respondents not understanding or engaging with the task. The study found the DCEtto method led to fewer exclusions, increasing representativeness. Health state values from the DCEtto were generally lower than the TTO but allowed valuing all respondents. The document discusses differences in the distributions and average levels of values from the two methods and impact of exclusions. It acknowledges limitations to interpreting DCEtto values that require further investigation.