Downloaded 11 times

![The Current Status of SEZ India
www.iosrjournals.org 27 | Page
VI. End Notes
1. Special Economic Zone (SEZ) is defined as "a specifically delineated duty free enclave and shall be deemed
to be foreign territory for the purposes of trade operations and duties and tariffs". SEZs are an
acknowledgement of the potential of export-led development strategy in accelerating economic growth.
2. Taken from the introduction to Special Economic Zones in India: http://www.sezindia.nic.in/
HTMLS/about.htm (last viewed on 12th July 2007).
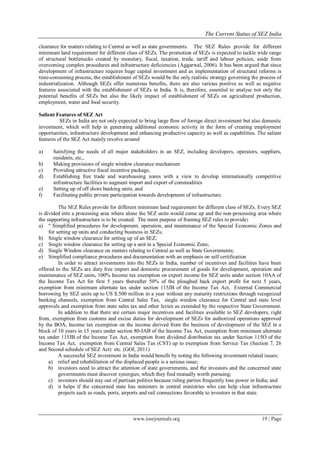
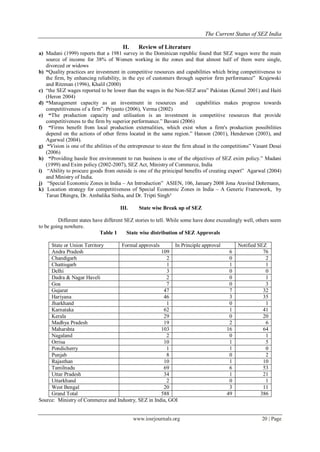
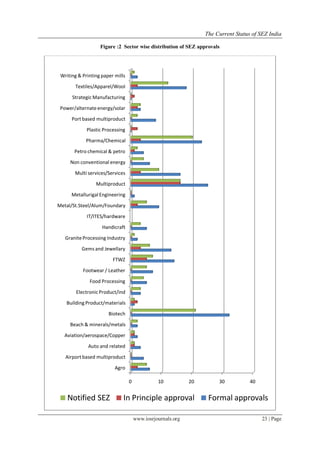
3. As on October13, 2011, there were 588 formal approvals of SEZs in the country. Out of this, 386 SEZs
were notified. The number of valid In-Principle approvals was 49
4. The new law allows the SEZs to have area of the order of 1000 hectares for multi-product zones, 100
hectares for product specific zones and only 10 hectares for IT, gems and jewellery and biotechnology
zones.
References
[1]. Aggarwal Aradhana (2004). Export Processing Zones in India: Analysis of the Export Performance. - Working Paper No. 148. New
Delhi: ICRIER.
[2]. Aggarwal, Aradhna (2006), „Special Economic Zones:Revisiting the Policy Debate‟, Economic and Political Weekly, November 4,
pp. 4533-4536.
[3]. Arora, O P (2003). Compilation of Circulars on EPZ/SEZ/EOU issued by CBEC, DGFT & RBI. Published byM/s Anmkur Arora
Associates.
[4]. Aseem Shrivastava (2007), http://www.infochangeindia.org/analysis 167.jsp) raises the following questions regarding the SEZs.
[5]. Ashok Upadhyay (2005), Special Economic Zones--An idea whose time has lapsed, Business Line, Tuesday, December 20.
[6]. Asian Productivity Organization (1983), Economic and Social Impacts of Export Processing Zones in Asia, APO, Tokyo.
[7]. Bhandari, Anup Kumar and Pradip Maiti (2007). Efficiency of Indian Manufacturing Firms: Textile Industry as a Case Study.
International Journal of Business and Economics, 6 (1): 71-88.
[8]. Goldar, B, V S Ranganathan and R Banga (2003). Ownership and Efficiency in Engineering Firms in Indian, 1990-91 to 1999-2000.
ICRIER working Paper No. 115.
[9]. Grasset, Jeremy and Frederic Landy (2007). Special Economic Zones in India–Between International Integration and Real Estate
Speculation. Man and Development , 29 (4): 63-74.
[10]. IIFT (1990). Exports Processing Zones in India: A Case Study of Kandla Free Trade Zone. Indian Institute of Foreign Trade
Occasional Paper. New Delhi.
[11]. Kambhampati Uma S (2003). Trade Reforms and Efficiency of Firms in India. Oxford Development Studies, 31(2): 219-33.
[12]. Kumar, Ranjan (2006), „SEZ: Capturing me Foreign Market‟,Southern Economist, September, Vol. 45.
[13]. Tantri, Malini L (2010): “Effectiveness of SEZs over EPZs Structure: The Performance at Aggregate Level”, ISEC Working Paper
248, Institute for Social and Economic Change (ISEC), Bangalore
[14]. Trivedi Pushpa (2004): “An Inter State perspective on Manufacturing Productivity in India: 1980-81 to 2000-01”, Indian Economic
Review, 39(1): 203-237
[15]. Venugopal Dhoot (2007), ASSOCHAM Guidelines to improve SEZs, India Real Estate forum 7th March. Wall, David (1991),
Special Economic Zones in Chinathe Administrative and Regulatory Framework, Research School of Pacific Studies, The Australian
National University.
[16]. www.mepz.com
[17]. www.sez.nic.in](https://image.slidesharecdn.com/c0951827-130429005214-phpapp02/85/C0951827-10-320.jpg)

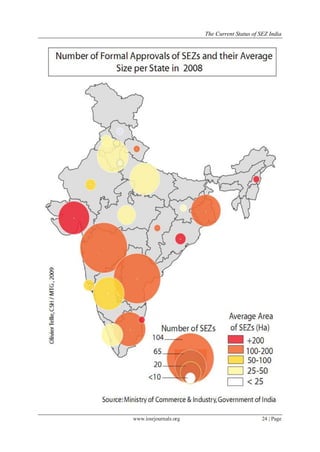
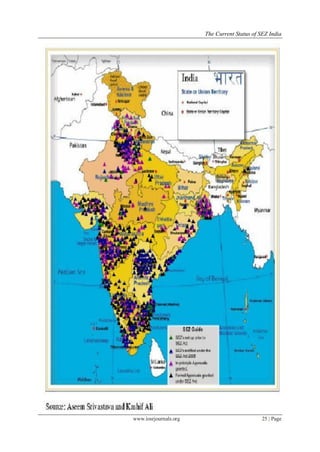
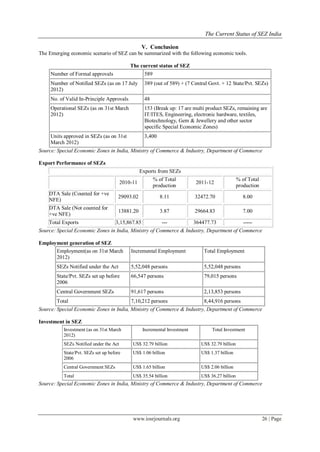
The document provides an overview of special economic zones (SEZs) in India. It discusses SEZs in a global context, noting that over 3000 SEZ projects exist across 120 countries. It then examines SEZs specifically in India, detailing their objectives to generate economic activity, promote exports and investment, and create jobs. Key features of India's SEZ Act are explained, including incentives for developers and units. Statistics show that the majority of India's 588 approved SEZs are in sectors like IT/ITES, biotech, and textiles. States like Andhra Pradesh, Tamil Nadu and Gujarat have the most approved and operational SEZs. In conclusion, the document analyzes SEZ's


