Download to read offline
![Automated Diagnosis of Glaucoma using Haralick Texture Features
www.iosrjournals.org 13 | Page
such image textural characteristics as homogeneity, gray-tone linear dependencies (linear structure), contrast,
number and nature of boundaries present, and the complexity of the image. It is important to note that the
number of operations required to compute any one of these features is proportional to the number of resolution
cells in the image block. It is for this reason that we call these features quickly computable.
Our initial perspective of texture and tone is based on the concept that texture and tone bear an
inextricable relationship to one another. Tone and texture are always present in an image, although one property
can dominate the other at times. The basic intuitively perceived relationships between tone and texture are the
following. When a small-area patch of an image has little variation-i.e., little variation of features of discrete
gray tone-the dominant property of that area is tone. When a small-area patch has a wide variation of features of
discrete gray tone, the dominant property of that area is texture. Crucial to this distinction are the size of the
small-area patch, the relative sizes of the discrete features, and the number of distinguishable discrete features.
As the number of distinguishable tonal discrete features decreases, the tonal properties will
predominate. In fact, when the small-area patch is only the size of one resolution cell, so that there is only one
discrete feature, the only property present is tone. As the number of distinguishable features of discrete gray
tone increases within the small-area patch, the texture property will dominate. One important property of tone-
texture is the spatial pattern of the resolution cells composing each discrete tonal feature. When there is no
spatial pattern and the gray-tone variation between features is wide, a fine texture results. As the spatial pattern
becomes more definite and involves more and more resolution cells, a coarser texture results. An excellent set of
photographs of different types of texture may be found.
The preceding description of texture is, of course, a gross simplification and idealization of what
actually occurs. Discrete tonal features are really quite fuzzy in that they do not necessarily stand out as entities
by themselves. Therefore the texture analysis we suggest is concerned with more general or macroscopic
concepts than discrete tonal features. The procedure we suggest for obtaining the textural features of an image is
based on the assumption that the texture information on an image I is contained in the overall or "average"
spatial relationship which the gray tones in the image I have to one another. More specifically, we shall assume
that this texture information is adequately specified by a set of gray-tone spatial-dependence matrices which are
computed for various angular relationships and distances between neighboring resolution cell pairs on the
image. All of our textural features are derived from these angular nearest-neighbor gray-tone spatial-dependence
matrices.. (10)
II. DATASET
The digital retinal images were collected from the Kasturba Medical College, Manipal, India
(http://www.manipal.edu). The doctors in the ophthalmology department of the hospital manually curated the
images based on the quality and usability of samples. The ethics committee, consisting of senior doctors,
approved the use of the images for this research.
Fig. 1. Typical fuindus images. (a).Normal. (b).Glaucoma
All the images were taken with a resolution of 560 × 720 pixels and stored in lossless JPEG format [10]. The
dataset contains 60 fundus images: 30 normal and 30 open angle glaucomatous images from 20 to 70 year-old
subjects. The fundus camera, a microscope, and a light source were used to acquire the retinal images to
diagnose diseases. Fig. 1(a) and (b) presents typical normal and glaucoma fundus images, respectively.
III. METHODOLOGY
A set of descriptive features that are fundamentally different from the Zernike moments, the texture
features described by Haralick , were investigated next. These features were selected because they can be made
invariant to translations and rotations, and because they describe more intuitive aspects of the images (e.g.
coarse versus smooth, directionality of the pattern, image complexity, etc.) using statistics of the gray-level co-
occurrence matrix for each image. An image processing techniques to diagnose the glaucoma based on the
Haralick evaluation of preprocessed fundus images. These algorithms are tested on publicly available fundus
images and the results are compared. The accuracy of these algorithms is evaluated by sensitivity and
specificity. The sensitivity and specificity for these algorithms are found to be very favorable.](https://image.slidesharecdn.com/c01511217-150114044054-conversion-gate02/75/Automated-Diagnosis-of-Glaucoma-using-Haralick-Texture-Features-2-2048.jpg)
![Automated Diagnosis of Glaucoma using Haralick Texture Features
www.iosrjournals.org 14 | Page
Fig 2:Proposed glaucoma detection System
This paper focused on the description of a system based on image processing and classification
techniques for the estimation of quantitative parameters to classify fundus images into two classes: glaucoma
patients and normal patients.
a.Gray Level Co-occurrence Matrix:
A GLCM P[i,j] is defined by specifying displacement vector d=(dx,dy). Counting all pairs of pixels
separated by d, having gray levels i and j. GLCM Measures are, Entropy-Randomness of gray level distribution,
Energy-uniformity of gray level in a region, Contrast-Measure of difference between gray levels and
Homogeneity-Measure of similarity of texture. Suppose an image to be analyzed is rectangular and has N.
resolution cells in the horizontal direction and N, resolution cells in the vertical direction. Suppose that the gray
tone appearing in each resolution cell is quantized' to Ng levels. Let Lx = {1,2, ,Nx} be the horizontal spatial
domain, Ly = {1,2,. ,NY} be the vertical spatial domain, and G = {1,2, .*,NgJ be the set of Ng quantized gray
tones. The set Ly x Lx is the set of resolution cells of the image ordered by their row-column designations. The
image I can be represented as a function which assigns some gray tone in G to each resolution cell or pair of
coordinates in Ly x Lx; I: Ly x LxG.
An essential component of our conceptual framework of texture is a measure, or more precisely, four
closely related measures from which all of our texture features are derived. These measures are arrays termed
angular nearest-neighbor gray-tone spatial-dependence matrices, and to describe these arrays we must
emphasize our notion of adjacent or nearest-neighbor resolution cells themselves. We consider a resolution cell-
excluding those on the periphery of an image, etc.-to have eight nearest-neighbor resolution.
Fig 3: graycomatrix continues this processing to fill in all the values in the GLCM
Syntax for Calculating GLCM,
glcm = graycomatrix(I)
glcms = graycomatrix(I, param1, val1, param2, val2,...)
[glcm, SI] = graycomatrix(...)
glcm = graycomatrix(I) creates a gray-level co-occurrence matrix (GLCM) from image I. graycomatrix creates
the GLCM by calculating how often a pixel with gray-level (grayscale intensity) value i occurs horizontally
adjacent to a pixel with the value j. (You can specify other pixel spatial relationships using
the 'Offsets' parameter -- see Parameters.) Each element (i,j) in glcm specifies the number of times that the pixel
with value i occurred horizontally adjacent to a pixel with value j. graycomatrix calculates the GLCM from a
scaled version of the image. By default, if I is a binary image, graycomatrix scales the image to two gray-levels.](https://image.slidesharecdn.com/c01511217-150114044054-conversion-gate02/75/Automated-Diagnosis-of-Glaucoma-using-Haralick-Texture-Features-3-2048.jpg)
![Automated Diagnosis of Glaucoma using Haralick Texture Features
www.iosrjournals.org 15 | Page
If I is an intensity image, graycomatrix scales the image to eight gray-levels. we can specify the number of gray-
levels graycomatrix uses to scale the image by using the 'NumLevels' parameter, and the way
that graycomatrix scales the values using the 'GrayLimits' parameter. graycomatrix calculates several values in
the GLCM of the 4-by-5 image I. Element (1,1) in the GLCM contains the value 1 because there is only one
instance in the image where two, horizontally adjacent pixels have the values 1 and 1. Element (1,2) in the
GLCM contains the value 2 because there are two instances in the image where two, horizontally adjacent pixels
have the values 1 and 2. graycomatrix continues this processing to fill in all the values in the GLCM.
b.Haralick Texture Features:
Haralick's texture features were calculated using the kharalick() function. The basis for these features is
the gray-level co-occurrence matrix ( G in Equation 1). This matrix is square with dimension Ng, where Ng is the
number of gray levels in the image. Element [i,j] of the matrix is generated by counting the number of times a
pixel with value i is adjacent to a pixel with value j and then dividing the entire matrix by the total number of
such comparisons made. Each entry is therefore considered to be the probability that a pixel with value i will be
found adjacent to a pixel of value j.
………………(1)
Since adjacency can be defined to occur in each of four directions in a 2D, square pixel image (horizontal,
vertical, left and right diagonals-Fig:4), four such matrices can be calculated.
Fig 4: Four directions of adjacency as defined for calculation of the Haralick texture features.
The Haralick statistics are calculated for co-occurrence matrices generated using each of these directions of
adjacency.
c.KNN Classifier:
A nearest-neighbor classification object, where both distance metric ("nearest") and number of
neighbors can be altered. The object classifies new observations using the predict method. The object contains
the data used for training, so can compute resubstitution predictions. The key issues involved in training this
model includes setting 1. the variable K, Validation techniques (ex. Cross validation) 2.the type of distant
metric, Euclidean measure is,
Dist(X,Y)=
k NN-find the k closest training points (small kxi − x0k according to some metric) 1.predicted class: majority
vote 2.predicted value: average weighted by inverse distance.
Fig 5:K-Nearest Neighbor Searching
Calculate distances of all training vectors to test vector. Pick k closest vectors. Calculate average/majority.
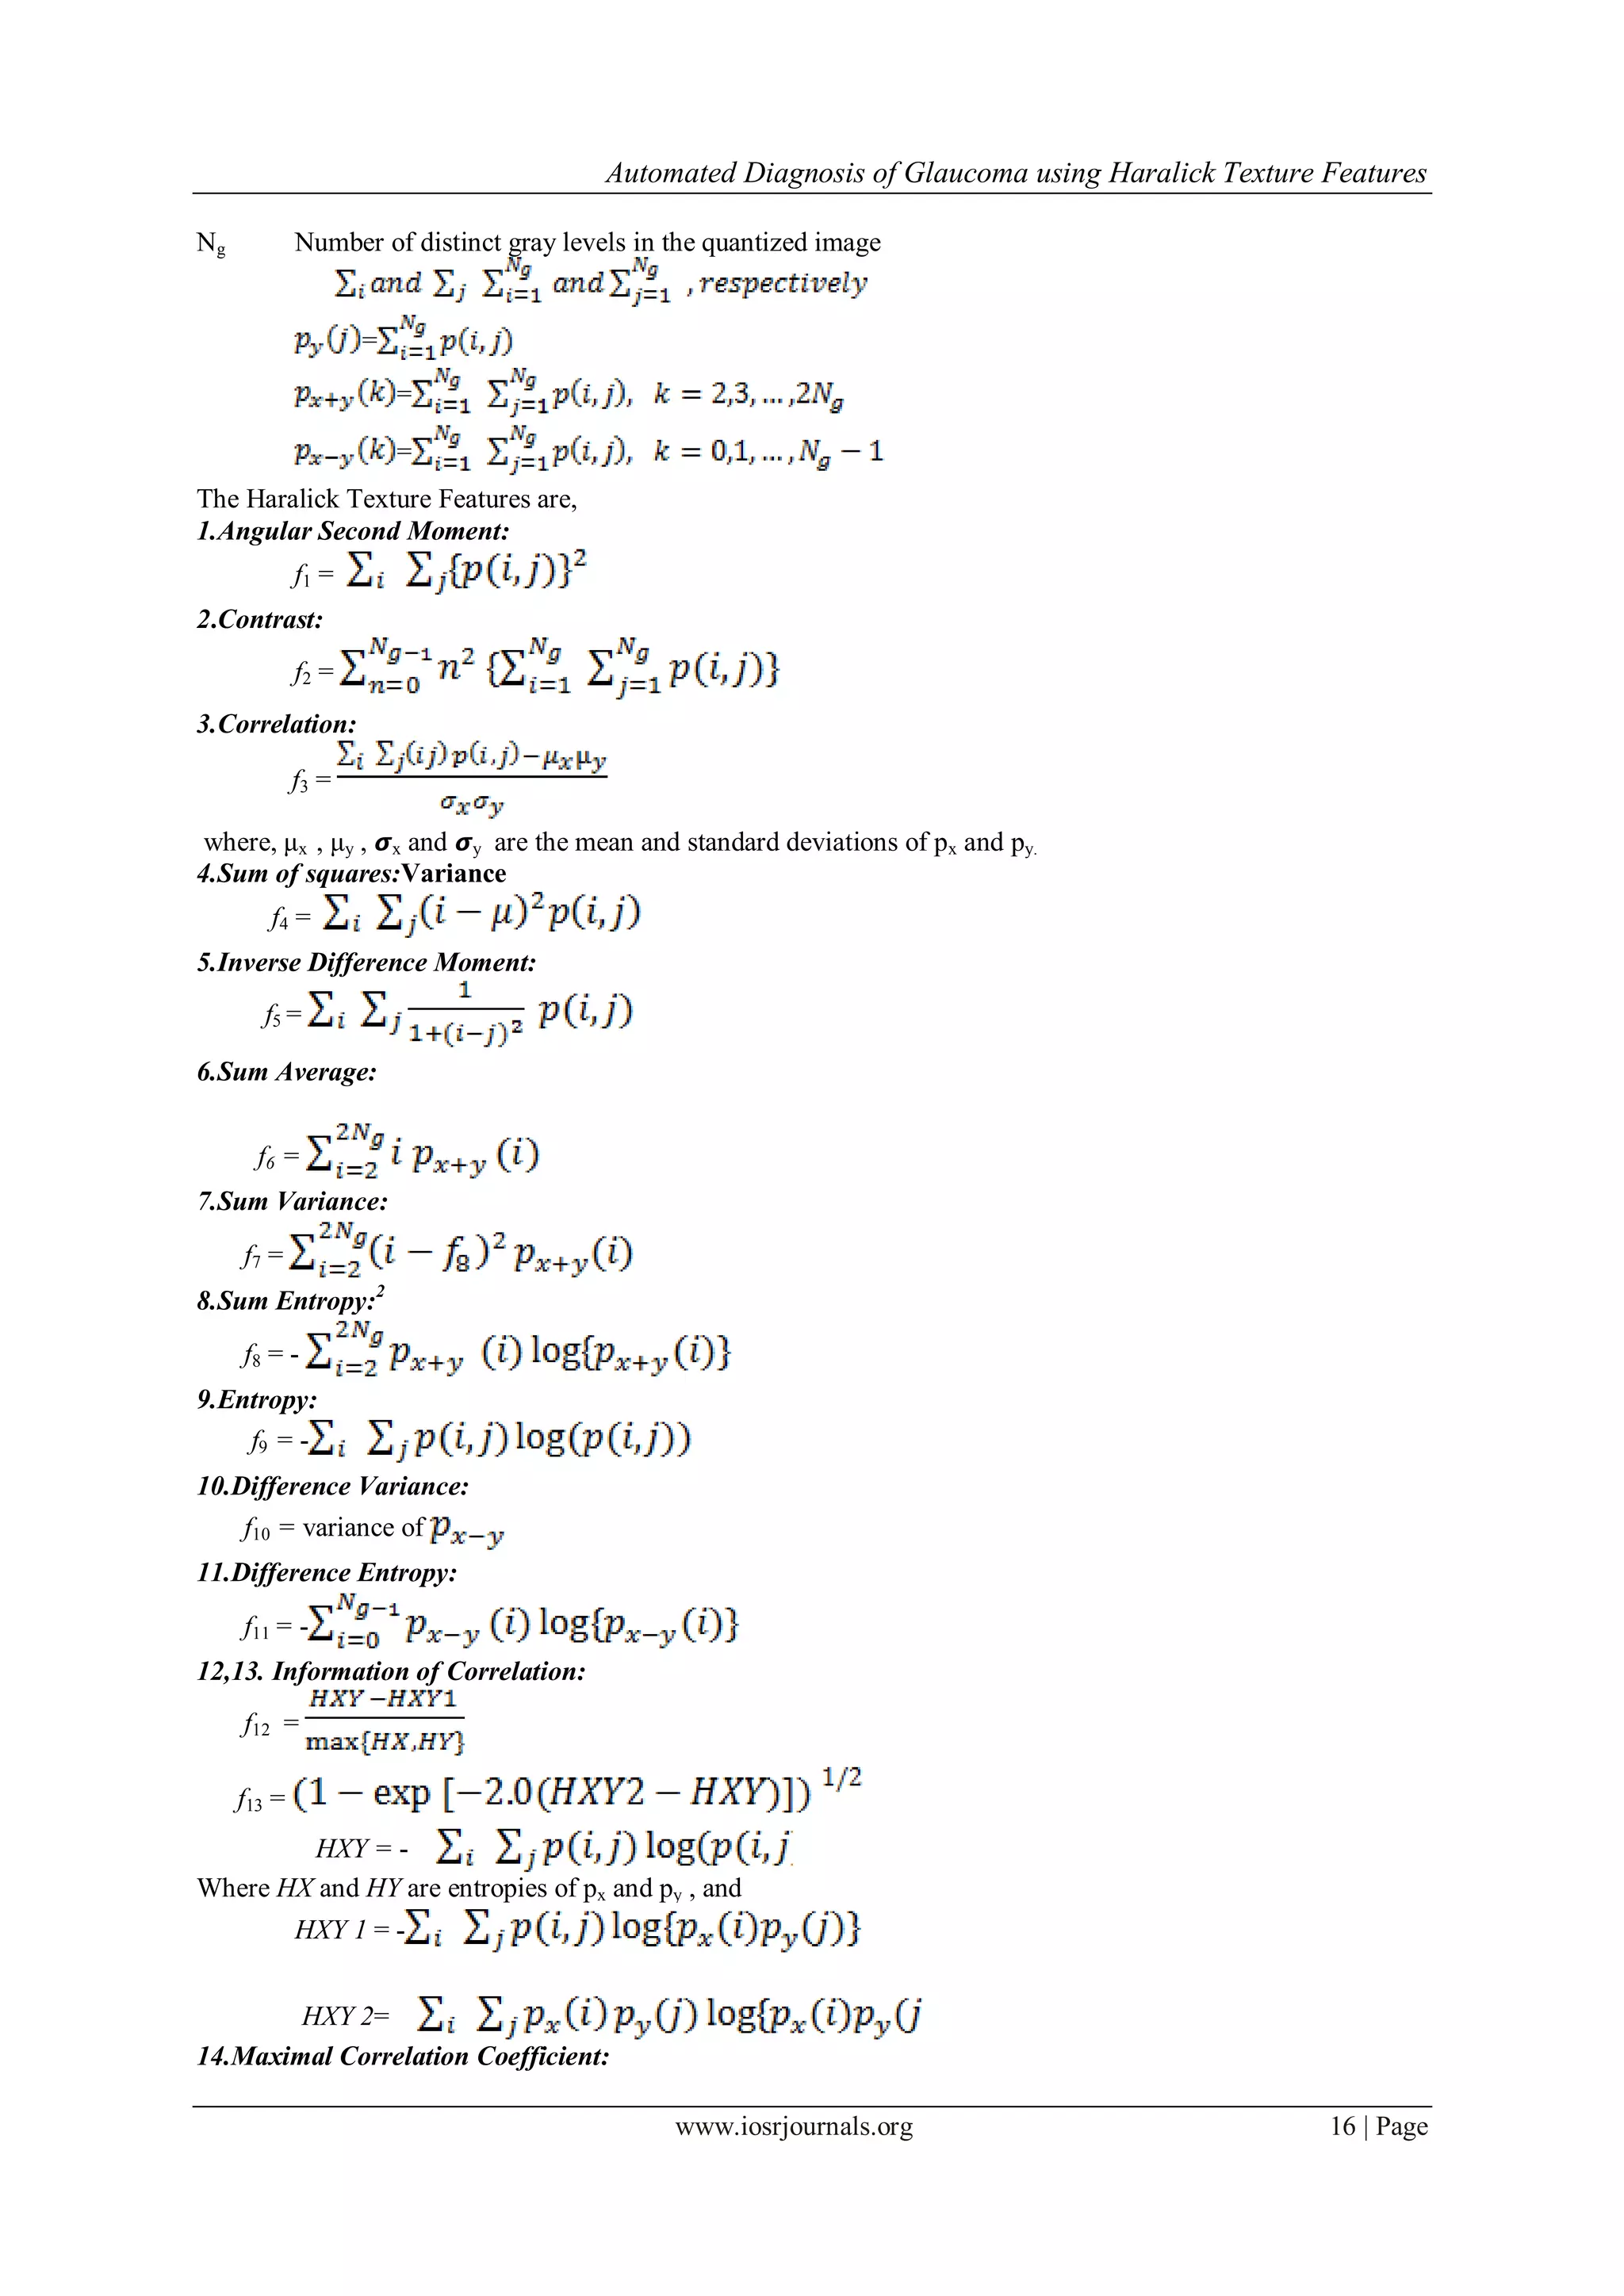
IV. FEATURE EXTRACTION
Haralick Texture Features which can be extracted from each of the gray-tone spatial-dependence
matrices. The following equations defines these feature,
Notations:
P(i,j) (i,j)th entry in a normalization gray-tone spatial dependence matrix, =p(i,j)/R
Px (i) i th entry in the marginal probability matrix obtained by summing the rows of p(i,j).
X](https://image.slidesharecdn.com/c01511217-150114044054-conversion-gate02/75/Automated-Diagnosis-of-Glaucoma-using-Haralick-Texture-Features-4-2048.jpg)
![Automated Diagnosis of Glaucoma using Haralick Texture Features
www.iosrjournals.org 17 | Page
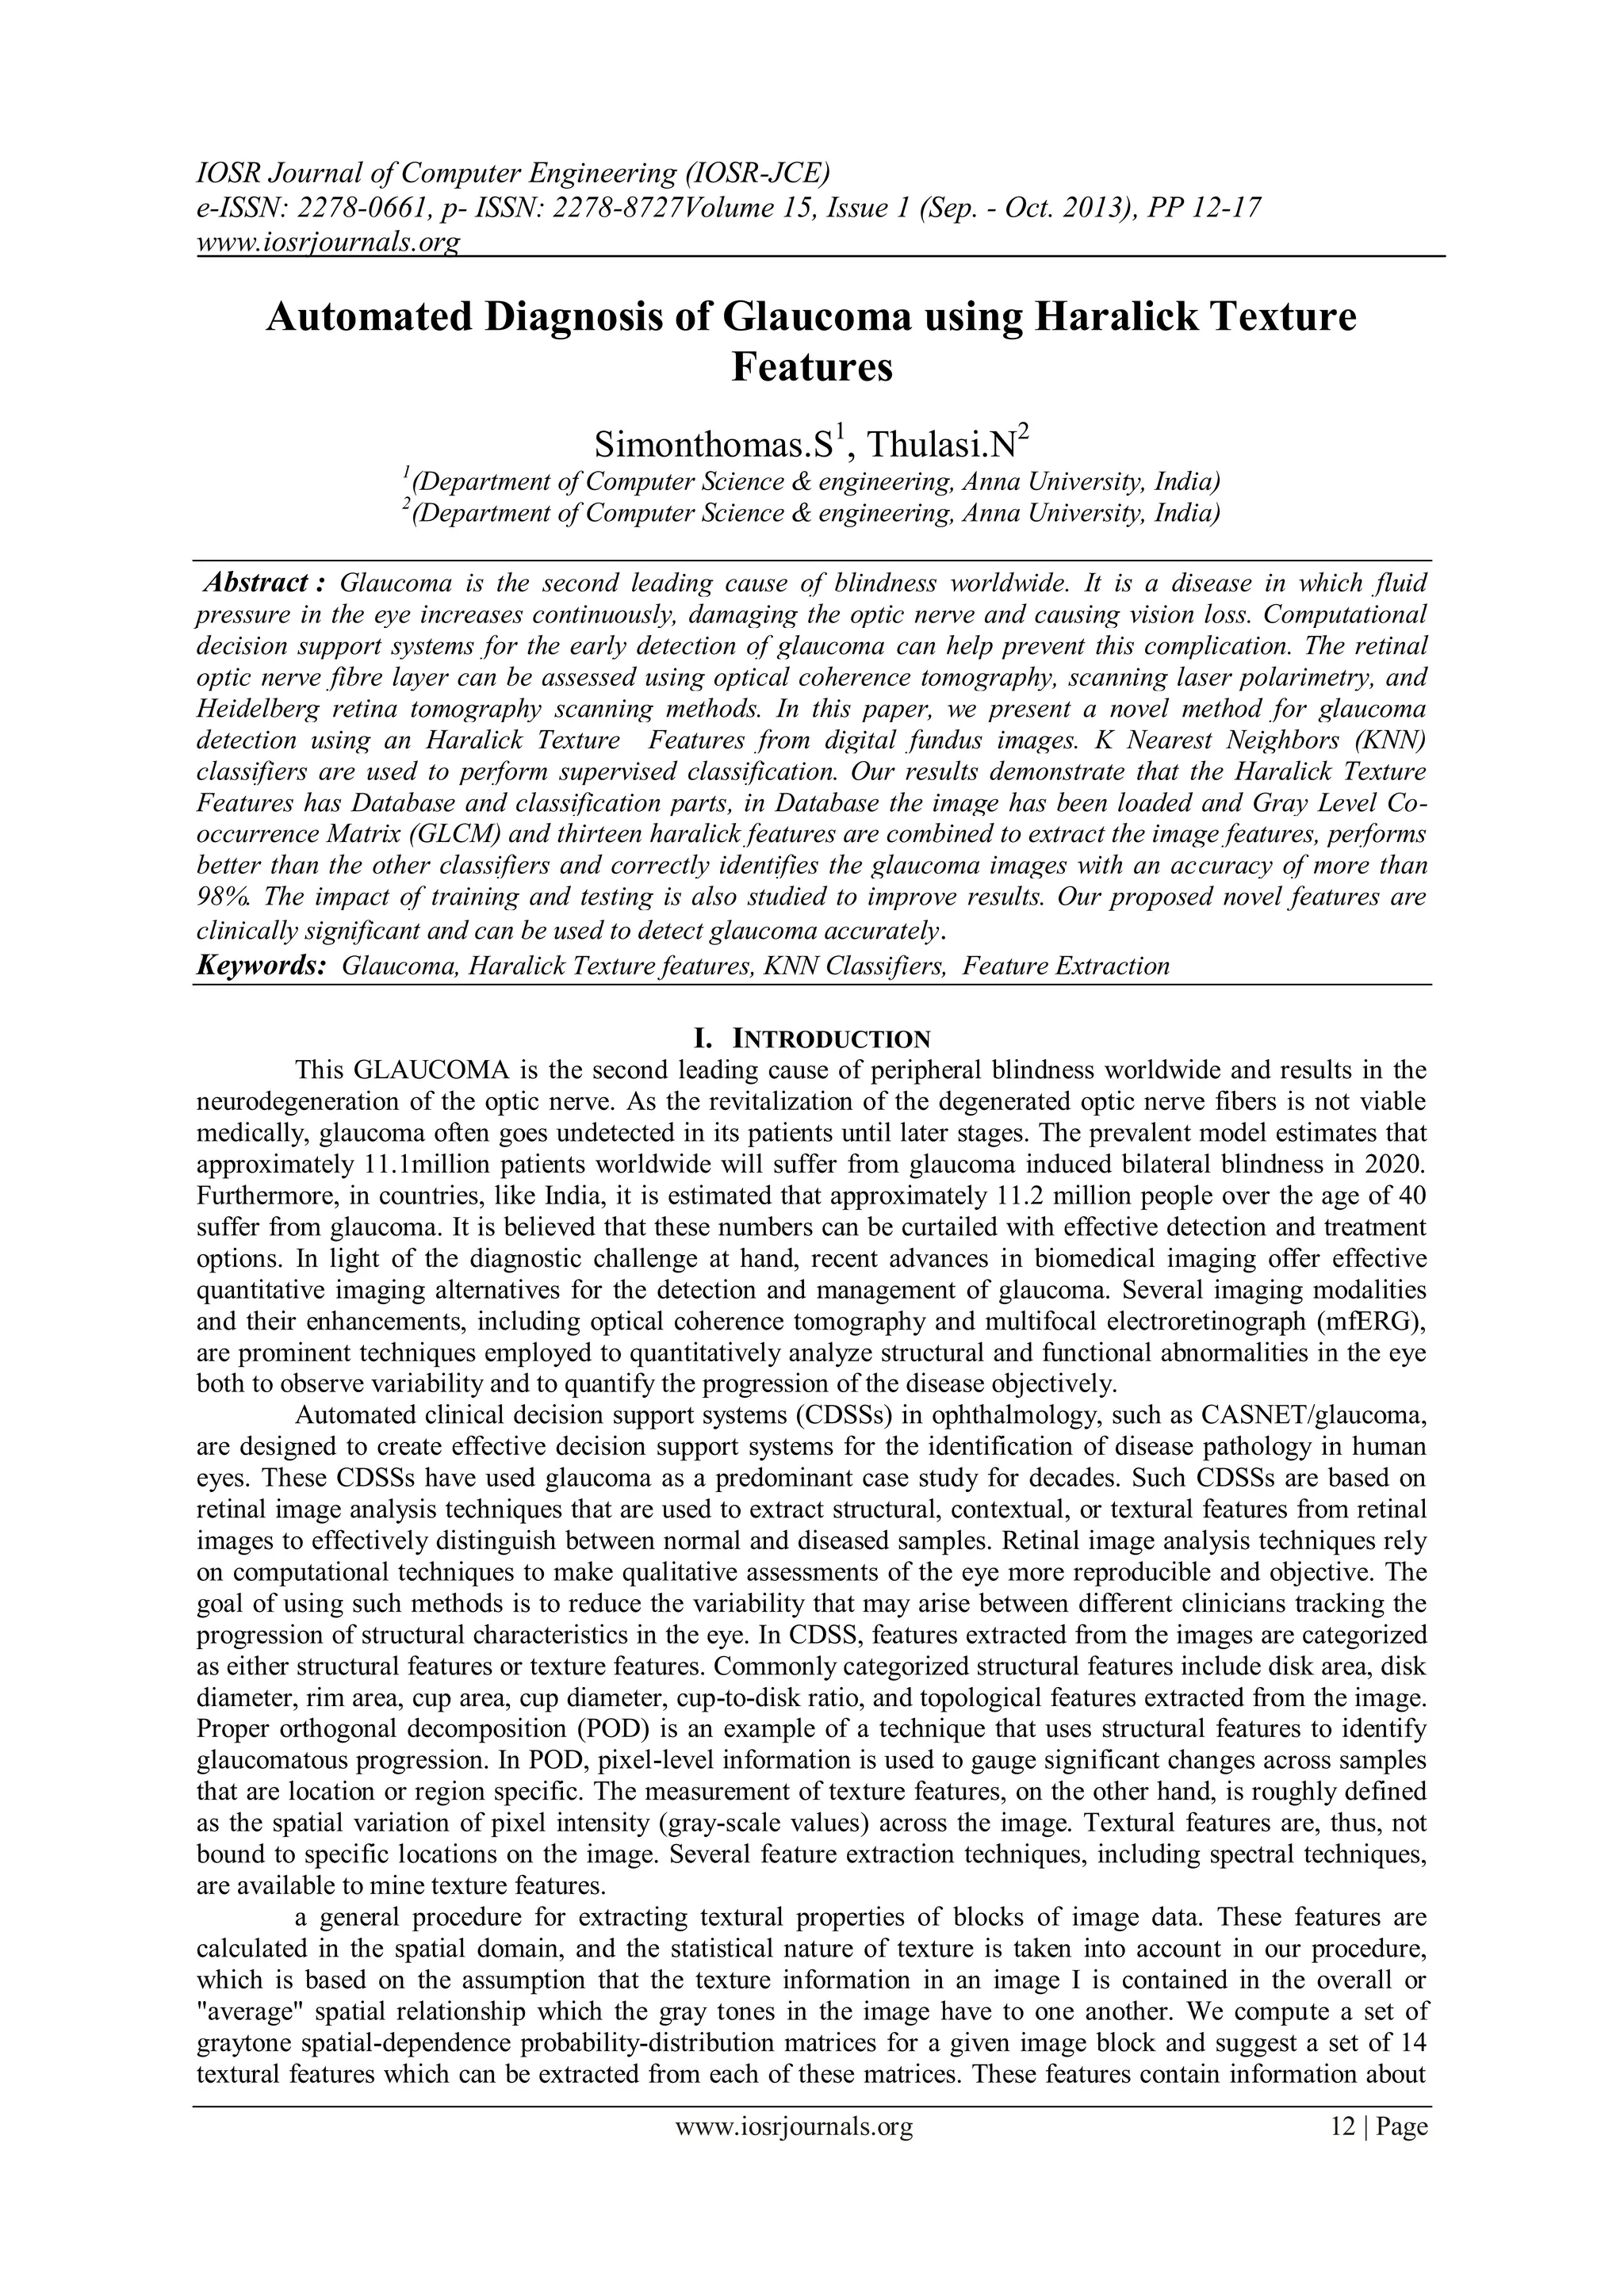
f14 =
Where,
Q(i,j) =
These measures of correlation have some desirable properties which are not brought out in the
rectangular correlation measures f3. The text for Chosen distance d we have four angular gray-tone spatial-
dependency matrices. Hence we obtain a set of four values for each of preceding 14 measures. The mean and
range of each of these 14 measures , averaged over the four values, comprise the set of 28 features which can be
used as input to the classifier. In this set of 28 features some of the features are strongly correlated with each
other. A feature-selection procedure may be applied to select a subset or linear combinations of the 28 features.
V. CONCLUSION
In this paper, we developed an automatic glaucoma diagnosis system using haralick texture features
extracted from fundus images for diagnosis. We found that the haralick texture features were significant, i.e., the
features has been extracted from the glcm and the pixel values has been calculates based on the haralick co-
occurrence matrix values. Training and testing datasets are used to classify the KNN classifier to finding the
pixel values to each and every matrix values, and finding the normal and abnormal(glaucoma affected) images
with the classification accuracy of above 98%. Our technique is of clinical significance, as the accuracy
obtained is comparable to the accuracies achieved so far in the existing systems. The classification accuracy can
be further improved by increasing the number of diverse training images, choosing better features and better
classifiers and using controlled environmental lighting conditions during image acquisition. using more diverse
digital fundus images from normal and glaucoma subjects can further enhance the percentage of correct
diagnosis. We can conclude that the energy obtained from the detailed coefficients can be used to distinguish
between normal and glaucomatous images with very high accuracy.
VI.REFERENCES
Journal Papers:
[1] R. Haralick, K. Shanmugam, and I. Dinstein, (1973) “Textural Features for Image Classification”, IEEE Trans. on Systems, Man and
Cybernetics, SMC–3(6):610–621
[2] Sumeet Dua, Senior Member, IEEE, U. Rajendra Acharya, Pradeep Chowriappa “Wavelet-Based Energy Features for Glaucomatous
Image Classification” VOL. 16, NO. 1, JANUARY 2012
[3] U.Rajendra Acharya, Sumeet Due, Xian Du,and Vinitha Sree S “Automated Diagnosis of Glaucoma Using Textural and Higher
Order Spectra Features”
Books:
[4] R. C. Gonzales, R. E.Woods, and S. L. Eddins. Digital Image Processing Using MATLAB.
Chapters in Books:
[5] J. M. Miquel-Jimenez et al., “Glaucoma detection by wavelet-based analysis of the global flash multifocal electroretinogram,” Med.
Eng. Phys., vol. 32, pp. 617–622, 2010
[6] Bino Sebastian V, A. Unnikrishnan and Kannan Balakrishnan “grey level co-occurrence matrices: generalisation and some new
features” (IJCSEIT), Vol.2, No.2, April 2012
[7] F. I. Alam, R. U. Faruqui, (2011) “Optimized Calculations of Haralick Texture Features”, European Journal of Scientific Research,
Vol. 50 No. 4, pp. 543-553
Theses:
[8] Celina Rani George “Glaucomatous Image Classification Using Wavelet Based Energy Signatures And Neural Networks” (IJERT)
ISSN: 2278-0181 Vol. 2 Issue 3, March – 2013
[9] Miguel-Jiménez J M , Blanco R, “Glaucoma detection by wavelet-based analysis of the global flash multifocal electroretinogram,”
Med. Eng. Phys., vol. 32, pp. 617–622, 2010.
Proceedings Papers:
[10] P. C. Chen and T. Pavlidis, “Segmentation of texture using correlation,” IEEE Trans. Pattern Anal. Machine Intell., vol. PAMI-5, pp.
64–69, Jan. 1983.
[11] Tou, J. Y., Tay, Y. H., & Lau, P. Y. (2009). Recent Trends in Texture Classification: A Review. Proceedings Symposium on
Progress, in Information and Communication Technology 2009 (SPICT 2009), Kuala Lumpur, pp. 63-68.
[12] A. Laine and J. Fan, “Texture classification by wavelet packet signatures,” IEEE Trans. Pattern Recognit. Machine Intell., vol. 15,
pp. 1186–1191,](https://image.slidesharecdn.com/c01511217-150114044054-conversion-gate02/75/Automated-Diagnosis-of-Glaucoma-using-Haralick-Texture-Features-6-2048.jpg)

This paper presents an automated system for glaucoma diagnosis utilizing Haralick texture features extracted from digital fundus images, achieving over 98% accuracy in classification. The methodology employs K nearest neighbors (KNN) classifiers for supervised classification, supported by analysis of gray level co-occurrence matrices to derive texture features. The study highlights the significance of these features for early detection of glaucoma, which is crucial in preventing blindness caused by the disease.