Download to read offline


![International Journal of Modern Engineering Research (IJMER)
www.ijmer.com Vol.3, Issue.1, Jan-Feb. 2013 pp-284-290 ISSN: 2249-6645
IV. CONCLUSIONS
Based on laboratory and field tests results, the following conclusions can be drawn, for sandy soil with Correlation
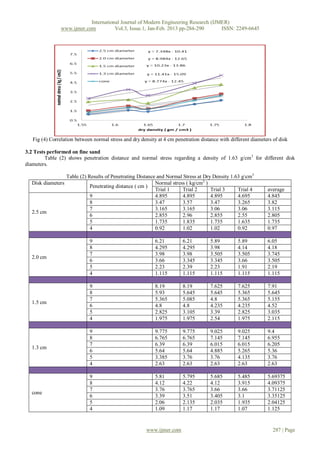
between normal stress and penetration distance with different rings (cm) diameter at different dry density (gm / cm 3) for
coarse sand , Correlation between Normal Stress and Dry Density at different Penetration Distance with Different Diameters
of Rings for coarse sand, Correlation between normal stress and penetration distance with different rings (cm) diameter at
different dry density (gm / cm3) for fine sand and Correlation between Normal Stress and Dry Density at different
Penetration Distance with Different Diameters of Rings for fine sand.
References
[1] ASAE Standards, 46th Ed. 1999a. ASAE S313.3, Soil cone penetrometer. St. Joseph, Mich.: ASAE.
[2] ASAE 1999b. ASAE EP542. Procedures for using and reporting data obtained with the soil cone penetrometer. St. Joseph, Mich.:
ASAE.
[3] Godwin,R.J.,N.L.Warner, and D..L.O. Smith. 1991. The development of a dynamic drop-cone device for the assessment of soil
strength and the effects of machinerytraffic. J. Agric. Eng. Res. 48:123–131.
[4] Herrick, J. E. and Jones, T. L. 2002. A dynamic cone penetrometer for measuring soil penetration resistance, Soil Sci. Soc. Am. J.
66:1320–1324
[5] Perumpral, J.V. 1987. Cone penetrometer applications—A review. Trans. ASAE 30:939–944.
[6] Raper, R. L., B. H. Washington, and J. D. Jarrell. 1999. A tractor-mounted multiple-probe soil cone penetrometer. Applied
Engineering in Agriculture 15(4): 287-290.
[7] Raper, R. L. and A. K. Sharma 2004 .Soil moisture effects on energy requirements and Soil dis ruption of subsoiling a coastal plain
soil,Transactions of the ASAE Vol.
[8] Sanglerat, G. 1972. The penetrometer and soil exploration. Interpretation of penetration diagrams-theory and practice.
Transportation Research Board. 500 Fifth St. NW, Washington DC, 2001, National Academy of Sciences.
[9] Tollner, E.W. and Verma, B.P., 1987. Lubricated and nonlubricated cone penetrometer comparison in six soils. Trans. ASAE 30(6),
1611-1618.
www.ijmer.com 290 | Page](https://image.slidesharecdn.com/bu31284290-130314025003-phpapp02/85/Bu31284290-7-320.jpg)

The document describes a study that used a penetrometer needle apparatus to measure soil parameters. Laboratory tests were conducted on coarse and fine sand samples compacted to different densities. The penetrometer was used to measure penetration distance under different applied normal stresses. Correlations between stress, density, and penetration distance were obtained. These correlations could be used to estimate soil parameters like friction angle and Young's modulus. The experimental setup, sample preparation methods, and some test results are presented.