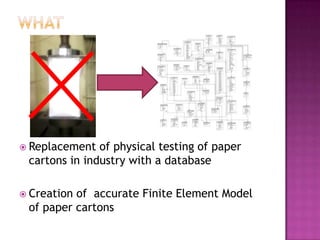
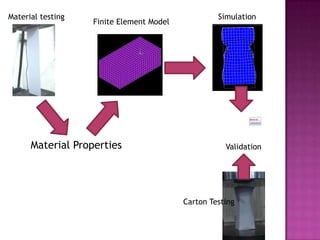
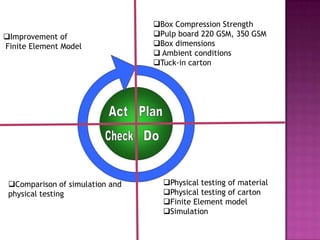
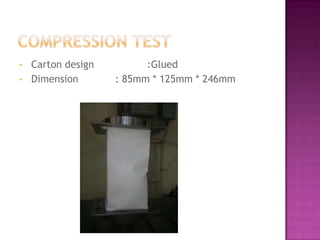
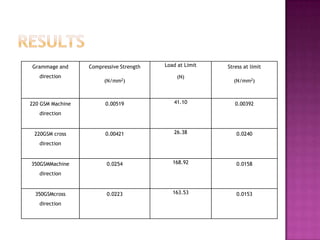
Geetha
Jagadeesan
Janet Amely
College of Engineering Guindy
 Replacement  of physical testing of paper
 cartons in industry with a database

 Creationof accurate Finite Element Model
 of paper cartons
 Investment   on physical testing

 Time


 Optimization


 Help   SSI’s and Startups

 Paper   cartons dominate packaging market
CARTON DATABASE


        VALIDATED SIMULATION


                   FINITE ELEMENT MODEL
 Creation   of finite element model of paper
 cartons

 Physicaltesting of cartons for the purpose of
 validation

 Simulation   of loads

 validation
Material testing                                           Simulation
                   Finite Element Model


                                                       force(N)

                                                                                         physical
                                                 200                                     simulation

                                                 150


                                                 100


      Material Properties                        50
                                                                      Validation
                                                                                          displacement(mm)
                                                           2      4    6   8   10   12      14     16


                                          Carton Testing
Box Compression Strength
Improvement of                  Pulp board 220 GSM, 350 GSM
Finite Element Model             Box dimensions
                                  Ambient conditions
                                 Tuck-in carton


 Comparison of simulation and     Physical testing of material
 physical testing                  Physical testing of carton
                                   Finite Element model
                                   Simulation
 Grain   direction
    Machine and cross direction


 Orthotropic
 Geometry


 Thickness


 Young’s   modulus

 Shear   modulus

 Poisson’s   ratio
 Paperboard    selection
 •   Pulp board with similar properties on both sides


 Paperboard    conditioning
 •   Temperature               :27+/-1 ̊ C
 •   Relative humidity         :65+/-2%
Grammage     Dimensions   Thickness   Tensile    Young’s modulus
   and                      (mm)      strength      (N/mm2)
Direction                             (N/mm2)

220 GSM       L=180mm        0.238     26.62           334.47
 Machine      W=25mm
 direction

220 GSM       L=180mm       0.238      15.18         144.75
  Cross       W=25mm
 direction

350GSM        L=180mm       0.375      30.11         345.95

 Machine     W=25mm
 direction

350GSM        L=180mm       0.375      17.79         167.27

  Cross       W=25mm
 direction
350 GSM Machine Direction

       Stress (kgf/cm²)


300                                                                         Break


                                                          Greatest Slope


200


100


            Preload
 00
      0.0                       5.0          10.0                          15.0              20.0
                                       Percentage Strain


                       350 GSM Cross Direction

       Stress (kgf/cm²)


200
                                                                                    Break


150


                                         Greatest Slope
100


 50


  0
      0.0                 5.0         10.0                      15.0                  20.0          25.0
                                        Percentage Strain
•   Geometric model

•   Finite Element Model

•   Analysis

•   Postprocessing

•   Refining Results
MESH SIZE (mm)   FORCE (N)
12.3             0.7542
6.15             1.2057
3.075            1.2060
•   Carton design         :Glued
•   Dimension       : 85mm * 125mm * 246mm
Grammage and      Compressive Strength   Load at Limit   Stress at limit
   direction                                  (N)
                       (N/mm2)                             (N/mm2)


220 GSM Machine         0.00519             41.10           0.00392
   direction


 220GSM cross           0.00421             26.38           0.0240
   direction


350GSMMachine           0.0254              168.92          0.0158
   direction


 350GSMcross            0.0223              163.53          0.0153
   direction
y
                                 simulation
200                              physical testing


150


Force (N)
100


50


                                                         x
          2   4   6   8     10   12   14    16      18
                          displacement(mm)
force(N)

                                          physical
200                                       simulation

150


100


50


                                           displacement(mm)
          2      4    6    8    10   12      14     16

                     • 10% force deviation
                     • 4mm peak deviation
force(N)

                                       physical
200                                    simulation

150


100


50


                                        displacement(mm)
          2      4   6   8   10   12      14     16
 Simulation   reliable

 Scope
      for improvement- creasing
 phenomenon

Paper Carton Analysis

  • 1.
  • 2.
     Replacement of physical testing of paper cartons in industry with a database  Creationof accurate Finite Element Model of paper cartons
  • 3.
     Investment on physical testing  Time  Optimization  Help SSI’s and Startups  Paper cartons dominate packaging market
  • 4.
    CARTON DATABASE VALIDATED SIMULATION FINITE ELEMENT MODEL
  • 5.
     Creation of finite element model of paper cartons  Physicaltesting of cartons for the purpose of validation  Simulation of loads  validation
  • 6.
    Material testing Simulation Finite Element Model force(N) physical 200 simulation 150 100 Material Properties 50 Validation displacement(mm) 2 4 6 8 10 12 14 16 Carton Testing
  • 7.
    Box Compression Strength Improvementof Pulp board 220 GSM, 350 GSM Finite Element Model Box dimensions  Ambient conditions Tuck-in carton Comparison of simulation and Physical testing of material physical testing Physical testing of carton Finite Element model Simulation
  • 9.
     Grain direction  Machine and cross direction  Orthotropic
  • 10.
     Geometry  Thickness Young’s modulus  Shear modulus  Poisson’s ratio
  • 11.
     Paperboard selection • Pulp board with similar properties on both sides  Paperboard conditioning • Temperature :27+/-1 ̊ C • Relative humidity :65+/-2%
  • 13.
    Grammage Dimensions Thickness Tensile Young’s modulus and (mm) strength (N/mm2) Direction (N/mm2) 220 GSM L=180mm 0.238 26.62 334.47 Machine W=25mm direction 220 GSM L=180mm 0.238 15.18 144.75 Cross W=25mm direction 350GSM L=180mm 0.375 30.11 345.95 Machine W=25mm direction 350GSM L=180mm 0.375 17.79 167.27 Cross W=25mm direction
  • 14.
    350 GSM MachineDirection Stress (kgf/cm²) 300 Break Greatest Slope 200 100 Preload 00 0.0 5.0 10.0 15.0 20.0 Percentage Strain 350 GSM Cross Direction Stress (kgf/cm²) 200 Break 150 Greatest Slope 100 50 0 0.0 5.0 10.0 15.0 20.0 25.0 Percentage Strain
  • 16.
    Geometric model • Finite Element Model • Analysis • Postprocessing • Refining Results
  • 26.
    MESH SIZE (mm) FORCE (N) 12.3 0.7542 6.15 1.2057 3.075 1.2060
  • 27.
    Carton design :Glued • Dimension : 85mm * 125mm * 246mm
  • 28.
    Grammage and Compressive Strength Load at Limit Stress at limit direction (N) (N/mm2) (N/mm2) 220 GSM Machine 0.00519 41.10 0.00392 direction 220GSM cross 0.00421 26.38 0.0240 direction 350GSMMachine 0.0254 168.92 0.0158 direction 350GSMcross 0.0223 163.53 0.0153 direction
  • 30.
    y simulation 200 physical testing 150 Force (N) 100 50 x 2 4 6 8 10 12 14 16 18 displacement(mm)
  • 31.
    force(N) physical 200 simulation 150 100 50 displacement(mm) 2 4 6 8 10 12 14 16 • 10% force deviation • 4mm peak deviation
  • 32.
    force(N) physical 200 simulation 150 100 50 displacement(mm) 2 4 6 8 10 12 14 16
  • 33.
     Simulation reliable  Scope for improvement- creasing phenomenon