SlideShare a Scribd company logo
Krit Phosamritlert
                                                                         Physics Period 1
                                                                            May 23, 2011

                                     Plastic Ball Dive

         In this investigation, a free falling ball dropped into a water container was
observed. When a ball is dropped into water, the ball will decelerate itself, due to the
ball’s tendency to float, until it stops moving at a certain depth and then will accelerate
back up to the water surface. The depth of the ball varies directly with the impact
velocity of the ball into the water. The impact velocity depends on the density of the ball
dropped (or its affective mass) as a more massive object would have a higher velocity
when dropped from a certain height, as long as it does not reach terminal velocity. In this
research, the relationship between the density of the ball dropped into the water and the
dive distance will be investigated.

        In Theory, the relationship between density (affective mass) and dive distance can
be described by using the equation x = (m/b)v (source: http://hyperphysics.phy-
astr.gsu.edu/hbase/lindrg3.html).


                                                                                   Equation 1

       This equation predicts that the relationship between the density, d, and dive
distance, x, is proportional to each other. The density can be found by using the equation
below.

                                         D= m/v

Where D is density, m is mass, and v is volume.

By using these two equations, the correlation between the density of the ball and the dive
distance can be found as shown in this investigation.
Design:

Research Question: What is the relationship between the density and the dive distance of
a free falling ball into water?

Variables:

        The independent variable is the density of the ball while the dependent variable is
the dive distance of the plastic ball into the water. The controlled variables are the height
of the water (43 ± 1 cm) which was controlled by adding water if the water level goes
below 43 cm. The surface of the water was kept constant by waiting for the waves to
dissipate before doing the next trial. The temperature of the room was controlled at 27 ±
1°C by turning the air conditioning unit in front of the direction of the ball off. The type
of ball used was kept constant by using the exact same ball for every trial. The camera
and the angle of the camera were kept constant by using a tripod.

Procedure:
         A six sided water container with approximately 60 ± 1 cm in height, a base
perimeter approximately 108 ± 1 cm, and the top perimeter approximately 126 ± 1 cm,
was filled with water up to 43 ± 1 cm from the base of the container. The plastic ball was
then dropped from the ceiling of the room, about 240 ± 1 cm, and the density of the ball
was changed by adding water into the ball. The ball was then weighed with an electronic
scale and recorded. Each time the water was added to the ball, the ball was used in the
experiment three times. The ball was centered on the container by using a string that was
taped on the roof of the room that was aimed at the center of the container. The slow
motion camera was set up so that it records perpendicular to the surface of the water and
about 1.5 meters away from the container, in case of splashing water coming out of the
container. The camera was then set at high-speed mode (420 frames per second). Lights
were set around the container to provide light for the high-speed camera. Record. After
three trials water was added into the ball using a pumper. Using logger pro, the video
was imported and analyzed for the dive distance of the ball frame by frame, measuring
the position displacement until no further advancement is made. Record dive distance.
After the experiment was done the ball was then cut to measure the diameter of the ball.
Meter Stick


                                                                   Water filled to 43cm


Figure 1: Shows the setup of the container and the scale device (meter stick) for the
camera to record.

Data Collecting and Processing:

Camera used: Casio Exilim Ex-FS10

Diameter of the squash ball: 13 ± 1 cm

There was no height uncertainty due to the fact that the ball was placed right on the
ceiling before each trial.
Mass (± 0.01 g)                                      Trial
                  58.86                                             1
                  75.80                                             2
                 111.11                                             3
                 148.00                                             4
                 160.60                                             5
                 215.60                                             6

Table 1: Shows the raw data of the mass that was recorded of each trial

By using the data above, the density of the ball was calculated using the equation shown
below.
                                          D = m/v

Where D is the density, m is the mass, and v is the volume. To calculate the volume, the
equation below was used.

                                       V = (4/3)πr3

After the density of the ball of each trial was found, the data that was analyzed from the
video in LoggerPro was put into comparison as shown by the table below.

                       Density
                                        Trial   Dive Distance (±0.6 cm)
                   (± 0.001 g/cm3)
                                          1                3.31
                        0.051             2                2.19
                                          3                2.85
                 Average                                   2.78
                                          1                7.70
                        0.066             2                7.42
                                          3                7.68
                 Average                                   7.60
                                          1                9.94
                        0.097             2                9.77
                                          3                8.57
                 Average                                   9.43
                                          1                9.48
                        0.129             2               10.44
                                          3               10.48
                 Average                                  10.13
                                          1               11.53
                        0.140             2               11.26
                                          3               11.33
                 Average                                  11.37
1               14.69
                        0.187            2               13.32
                                         3               13.33
                 Average                                 13.78

Table 2: This is the raw data that was analyzed from the video showing correlation
between the dive distance and also the calculated density of the ball.


Figure 2: This is a sample graph of density (0.129 ± 0.001 g/cm3) 4 trial 1 showing the
maximum dive distance the ball reached of -9.48 (±0.01 cm). The more negative the
ball’s position, the deeper the dive distance.
Figure 3: This graph shows the density of the ball in correlation to the dive distance
which is close to one which shows a linear relationship.


Figure 4: Shows the high low fit for the data range showing the level of confidence of the
data. The first data point was left out due to it being an outlier.
Sample Calculation:
   1. Determining the volume of the ball
         a. V = (4/3)πr3
          b. (4/3)(π)(6.5cm)3
          c. V = 1150.35
   2. Determining the density of the ball density 4 trial 1
          a. D = m/v
          b. 148.00g/1150.35cm3
         c. D = 0.129g/cm3
   3. Uncertainty of dive distance for density 1 (highest uncertainty)
          a. (high – low) / 2
          b. Dive distance high = 3.31cm
          c. Dive distance low = 2.19cm
          d. (3.31cm - 2.19cm)/2 = 0.6cm


Conclusion:
        According to figure 3, the relationship between the density of the plastic ball and
the dive distance of the ball is a linear relationship. This can be seen in the following
equation:

                                  y = 50 (± 20) x + 4 (± 2)

The equation above contradicts the theory mentioned in the introduction due to the fact
that the theory predicts that the relationship would be a proportional one. This is due to
the fact that there are many factors that affect the dive distance of the ball such as surface
tension, buoyancy of the ball, and the viscosity of water. The surface tension and the
buoyancy of the ball would act as an upwards force pushing the ball upwards and
therefore would decrease the dive distance. The viscosity of water would also affect the
dive distance since the ball changes medium during its free fall. These factors add result
in the value of the y-intercept which makes the relationship a linear relationship rather
than a proportional relationship as predicted by the theory. Despite the fact that many
factors that would affect the result were overlooked, the quality of the data seems to be
quite accurate, excluding the outlier of the first density trials. The linear fit went through
all the error bars which mean that the data is within the accepted error range.

The results from this investigation is only applicable to specific conditions such as the
ball must be exactly the same as the one used in this investigation, the factors that also
affect the dive distance and velocity of the ball must not be included into the system, and
also performed at low heights (2-3 meters) since if the ball has enough time to reach its
terminal velocity, then the change in density (or mass) would therefore have no effect
since the object would be moving at terminal velocity and anymore increase would not
increase the dive distance.
Evaluation:

One of the errors that occurred during the investigation would be the control of where the
ball lands on the surface of the water. Since the camera cannot judge the depth of field, if
the ball does not drop right in the center of the container, the dive distance that was
analyzed from the video would vary. This is because the balls moving closer or further
away from the scale object (the meter stick in this case). This error might be caused by
the air flow inside the room since only the air conditioning unit in front of the ball was
closed but not all of them. This might also be due to the fact that during this
investigation a mechanical release mechanism was not used but rather using human hand
so therefore there might be slight deviation between each drop. This is an example of a
random error which could be improved by adding a mechanical release mechanism or
using a pipe for the ball to fall into to control the landing spot of the ball.

Another factor that could be improved would be the camera itself. Since the camera used
in this investigation only had 420 frames per second setting, the amount of data collect
was quite minimal. Also when this was imported to LoggerPro, the video was blurry and
it was hard to judge where the position of the ball is. This systematic error can be
improved by using a higher resolution camera that has a higher quality video capture
capability and also have more frames per second timing.

The water container was also too small making the water reflects off the side of the
container and therefore hitting the ball. The water also splashes out of the container
during each trial which would also affect the dive distance of the ball. This can be
improved by using a larger container where the waves generated by the ball would not
come back and affect the ball and where the water would not splash out.

Also one of the data points in this investigation is seen as an outlier due to its low value
according to figure 3. Since the ball did not contain any water initially, the ball would
have a greater tendency to float than the rest of the trials so the ball would have less force
pushing it downwards than the other trials that contained water in the ball. The ball’s
own buoyancy would therefore have a force pushing upwards which would affect the
dive distance. This can be improved by making the first trial contain some water already
and not starting off with any water.

More Related Content

Similar to Physics IRP

IB Physic Full Investigation
IB Physic Full InvestigationIB Physic Full Investigation
IB Physic Full Investigation
Ertu?rul Akay
 
IB Physics SL - Design Lab
IB Physics SL - Design  LabIB Physics SL - Design  Lab
IB Physics SL - Design Lab
Lorrchan
 
Write up
Write upWrite up
Write up
Zayd Shamas
 
Investigation 1h1 (cm)h2 (cm)ΔP (h2 - h1)Δt1 for 1.25 cm (sec)Δt2 .docx
Investigation 1h1 (cm)h2 (cm)ΔP (h2 - h1)Δt1 for 1.25 cm (sec)Δt2 .docxInvestigation 1h1 (cm)h2 (cm)ΔP (h2 - h1)Δt1 for 1.25 cm (sec)Δt2 .docx
Investigation 1h1 (cm)h2 (cm)ΔP (h2 - h1)Δt1 for 1.25 cm (sec)Δt2 .docx
christiandean12115
 
Welcome to International Journal of Engineering Research and Development (IJERD)
Welcome to International Journal of Engineering Research and Development (IJERD)Welcome to International Journal of Engineering Research and Development (IJERD)
Welcome to International Journal of Engineering Research and Development (IJERD)
IJERD Editor
 
Sheet1470 Real1kTotal RCurrent470 R Voltage1k VoltageAmmeter Volta.docx
Sheet1470 Real1kTotal RCurrent470 R Voltage1k VoltageAmmeter Volta.docxSheet1470 Real1kTotal RCurrent470 R Voltage1k VoltageAmmeter Volta.docx
Sheet1470 Real1kTotal RCurrent470 R Voltage1k VoltageAmmeter Volta.docx
bagotjesusa
 
Sa open inquiry complete
Sa open inquiry completeSa open inquiry complete
Sa open inquiry complete
FHSSSA
 
Physics IRP
Physics IRPPhysics IRP
Physics IRP
EmmanuelCastano
 
Chiu i hsuan
Chiu i hsuanChiu i hsuan
Chiu i hsuan
chiuihsuan
 
Chiu i hsuan
Chiu i hsuanChiu i hsuan
Chiu i hsuan
chiuihsuan
 
Physics (praktikum)
Physics (praktikum)Physics (praktikum)
Physics (praktikum)
Elsens Viele
 
Josh lim cupcakes and drag
Josh lim cupcakes and dragJosh lim cupcakes and drag
Josh lim cupcakes and drag
Josh Lim
 
1-D Consolidation Test
1-D Consolidation Test1-D Consolidation Test
1-D Consolidation Test
A K
 
Independent research ryohei kimura
Independent research   ryohei kimuraIndependent research   ryohei kimura
Independent research ryohei kimura
Ryohei Kimura
 
Independent research
Independent researchIndependent research
Independent research
Ryohei Kimura
 
Report for Experiment 4 Newton’s Second Law .docx
Report for Experiment 4 Newton’s Second Law  .docxReport for Experiment 4 Newton’s Second Law  .docx
Report for Experiment 4 Newton’s Second Law .docx
sodhi3
 
ConfinedBrownian MotionPhysRevE.49.5158.pdf
ConfinedBrownian MotionPhysRevE.49.5158.pdfConfinedBrownian MotionPhysRevE.49.5158.pdf
ConfinedBrownian MotionPhysRevE.49.5158.pdf
luc faucheux
 
Pressure vs rate of flow
Pressure vs rate of flowPressure vs rate of flow
Pressure vs rate of flow
NonnieZ
 
Kevin_Park_OSU_ Master_Project Report
Kevin_Park_OSU_ Master_Project ReportKevin_Park_OSU_ Master_Project Report
Kevin_Park_OSU_ Master_Project Report
Kevin Park
 
Reconstruction of underwater image by bispectrum
Reconstruction of underwater image by bispectrumReconstruction of underwater image by bispectrum
Reconstruction of underwater image by bispectrum
prasanna9111
 

Similar to Physics IRP (20)

IB Physic Full Investigation
IB Physic Full InvestigationIB Physic Full Investigation
IB Physic Full Investigation
 
IB Physics SL - Design Lab
IB Physics SL - Design  LabIB Physics SL - Design  Lab
IB Physics SL - Design Lab
 
Write up
Write upWrite up
Write up
 
Investigation 1h1 (cm)h2 (cm)ΔP (h2 - h1)Δt1 for 1.25 cm (sec)Δt2 .docx
Investigation 1h1 (cm)h2 (cm)ΔP (h2 - h1)Δt1 for 1.25 cm (sec)Δt2 .docxInvestigation 1h1 (cm)h2 (cm)ΔP (h2 - h1)Δt1 for 1.25 cm (sec)Δt2 .docx
Investigation 1h1 (cm)h2 (cm)ΔP (h2 - h1)Δt1 for 1.25 cm (sec)Δt2 .docx
 
Welcome to International Journal of Engineering Research and Development (IJERD)
Welcome to International Journal of Engineering Research and Development (IJERD)Welcome to International Journal of Engineering Research and Development (IJERD)
Welcome to International Journal of Engineering Research and Development (IJERD)
 
Sheet1470 Real1kTotal RCurrent470 R Voltage1k VoltageAmmeter Volta.docx
Sheet1470 Real1kTotal RCurrent470 R Voltage1k VoltageAmmeter Volta.docxSheet1470 Real1kTotal RCurrent470 R Voltage1k VoltageAmmeter Volta.docx
Sheet1470 Real1kTotal RCurrent470 R Voltage1k VoltageAmmeter Volta.docx
 
Sa open inquiry complete
Sa open inquiry completeSa open inquiry complete
Sa open inquiry complete
 
Physics IRP
Physics IRPPhysics IRP
Physics IRP
 
Chiu i hsuan
Chiu i hsuanChiu i hsuan
Chiu i hsuan
 
Chiu i hsuan
Chiu i hsuanChiu i hsuan
Chiu i hsuan
 
Physics (praktikum)
Physics (praktikum)Physics (praktikum)
Physics (praktikum)
 
Josh lim cupcakes and drag
Josh lim cupcakes and dragJosh lim cupcakes and drag
Josh lim cupcakes and drag
 
1-D Consolidation Test
1-D Consolidation Test1-D Consolidation Test
1-D Consolidation Test
 
Independent research ryohei kimura
Independent research   ryohei kimuraIndependent research   ryohei kimura
Independent research ryohei kimura
 
Independent research
Independent researchIndependent research
Independent research
 
Report for Experiment 4 Newton’s Second Law .docx
Report for Experiment 4 Newton’s Second Law  .docxReport for Experiment 4 Newton’s Second Law  .docx
Report for Experiment 4 Newton’s Second Law .docx
 
ConfinedBrownian MotionPhysRevE.49.5158.pdf
ConfinedBrownian MotionPhysRevE.49.5158.pdfConfinedBrownian MotionPhysRevE.49.5158.pdf
ConfinedBrownian MotionPhysRevE.49.5158.pdf
 
Pressure vs rate of flow
Pressure vs rate of flowPressure vs rate of flow
Pressure vs rate of flow
 
Kevin_Park_OSU_ Master_Project Report
Kevin_Park_OSU_ Master_Project ReportKevin_Park_OSU_ Master_Project Report
Kevin_Park_OSU_ Master_Project Report
 
Reconstruction of underwater image by bispectrum
Reconstruction of underwater image by bispectrumReconstruction of underwater image by bispectrum
Reconstruction of underwater image by bispectrum
 

Recently uploaded

A Deep Dive into ScyllaDB's Architecture
A Deep Dive into ScyllaDB's ArchitectureA Deep Dive into ScyllaDB's Architecture
A Deep Dive into ScyllaDB's Architecture
ScyllaDB
 
Must Know Postgres Extension for DBA and Developer during Migration
Must Know Postgres Extension for DBA and Developer during MigrationMust Know Postgres Extension for DBA and Developer during Migration
Must Know Postgres Extension for DBA and Developer during Migration
Mydbops
 
“Temporal Event Neural Networks: A More Efficient Alternative to the Transfor...
“Temporal Event Neural Networks: A More Efficient Alternative to the Transfor...“Temporal Event Neural Networks: A More Efficient Alternative to the Transfor...
“Temporal Event Neural Networks: A More Efficient Alternative to the Transfor...
Edge AI and Vision Alliance
 
AppSec PNW: Android and iOS Application Security with MobSF
AppSec PNW: Android and iOS Application Security with MobSFAppSec PNW: Android and iOS Application Security with MobSF
AppSec PNW: Android and iOS Application Security with MobSF
Ajin Abraham
 
Crafting Excellence: A Comprehensive Guide to iOS Mobile App Development Serv...
Crafting Excellence: A Comprehensive Guide to iOS Mobile App Development Serv...Crafting Excellence: A Comprehensive Guide to iOS Mobile App Development Serv...
Crafting Excellence: A Comprehensive Guide to iOS Mobile App Development Serv...
Pitangent Analytics & Technology Solutions Pvt. Ltd
 
The Microsoft 365 Migration Tutorial For Beginner.pptx
The Microsoft 365 Migration Tutorial For Beginner.pptxThe Microsoft 365 Migration Tutorial For Beginner.pptx
The Microsoft 365 Migration Tutorial For Beginner.pptx
operationspcvita
 
Northern Engraving | Modern Metal Trim, Nameplates and Appliance Panels
Northern Engraving | Modern Metal Trim, Nameplates and Appliance PanelsNorthern Engraving | Modern Metal Trim, Nameplates and Appliance Panels
Northern Engraving | Modern Metal Trim, Nameplates and Appliance Panels
Northern Engraving
 
Monitoring and Managing Anomaly Detection on OpenShift.pdf
Monitoring and Managing Anomaly Detection on OpenShift.pdfMonitoring and Managing Anomaly Detection on OpenShift.pdf
Monitoring and Managing Anomaly Detection on OpenShift.pdf
Tosin Akinosho
 
LF Energy Webinar: Carbon Data Specifications: Mechanisms to Improve Data Acc...
LF Energy Webinar: Carbon Data Specifications: Mechanisms to Improve Data Acc...LF Energy Webinar: Carbon Data Specifications: Mechanisms to Improve Data Acc...
LF Energy Webinar: Carbon Data Specifications: Mechanisms to Improve Data Acc...
DanBrown980551
 
Mutation Testing for Task-Oriented Chatbots
Mutation Testing for Task-Oriented ChatbotsMutation Testing for Task-Oriented Chatbots
Mutation Testing for Task-Oriented Chatbots
Pablo Gómez Abajo
 
"Frontline Battles with DDoS: Best practices and Lessons Learned", Igor Ivaniuk
"Frontline Battles with DDoS: Best practices and Lessons Learned",  Igor Ivaniuk"Frontline Battles with DDoS: Best practices and Lessons Learned",  Igor Ivaniuk
"Frontline Battles with DDoS: Best practices and Lessons Learned", Igor Ivaniuk
Fwdays
 
Overcoming the PLG Trap: Lessons from Canva's Head of Sales & Head of EMEA Da...
Overcoming the PLG Trap: Lessons from Canva's Head of Sales & Head of EMEA Da...Overcoming the PLG Trap: Lessons from Canva's Head of Sales & Head of EMEA Da...
Overcoming the PLG Trap: Lessons from Canva's Head of Sales & Head of EMEA Da...
saastr
 
Skybuffer SAM4U tool for SAP license adoption
Skybuffer SAM4U tool for SAP license adoptionSkybuffer SAM4U tool for SAP license adoption
Skybuffer SAM4U tool for SAP license adoption
Tatiana Kojar
 
Essentials of Automations: Exploring Attributes & Automation Parameters
Essentials of Automations: Exploring Attributes & Automation ParametersEssentials of Automations: Exploring Attributes & Automation Parameters
Essentials of Automations: Exploring Attributes & Automation Parameters
Safe Software
 
Session 1 - Intro to Robotic Process Automation.pdf
Session 1 - Intro to Robotic Process Automation.pdfSession 1 - Intro to Robotic Process Automation.pdf
Session 1 - Intro to Robotic Process Automation.pdf
UiPathCommunity
 
"Scaling RAG Applications to serve millions of users", Kevin Goedecke
"Scaling RAG Applications to serve millions of users",  Kevin Goedecke"Scaling RAG Applications to serve millions of users",  Kevin Goedecke
"Scaling RAG Applications to serve millions of users", Kevin Goedecke
Fwdays
 
Connector Corner: Seamlessly power UiPath Apps, GenAI with prebuilt connectors
Connector Corner: Seamlessly power UiPath Apps, GenAI with prebuilt connectorsConnector Corner: Seamlessly power UiPath Apps, GenAI with prebuilt connectors
Connector Corner: Seamlessly power UiPath Apps, GenAI with prebuilt connectors
DianaGray10
 
5th LF Energy Power Grid Model Meet-up Slides
5th LF Energy Power Grid Model Meet-up Slides5th LF Energy Power Grid Model Meet-up Slides
5th LF Energy Power Grid Model Meet-up Slides
DanBrown980551
 
Christine's Supplier Sourcing Presentaion.pptx
Christine's Supplier Sourcing Presentaion.pptxChristine's Supplier Sourcing Presentaion.pptx
Christine's Supplier Sourcing Presentaion.pptx
christinelarrosa
 
Christine's Product Research Presentation.pptx
Christine's Product Research Presentation.pptxChristine's Product Research Presentation.pptx
Christine's Product Research Presentation.pptx
christinelarrosa
 

Recently uploaded (20)

A Deep Dive into ScyllaDB's Architecture
A Deep Dive into ScyllaDB's ArchitectureA Deep Dive into ScyllaDB's Architecture
A Deep Dive into ScyllaDB's Architecture
 
Must Know Postgres Extension for DBA and Developer during Migration
Must Know Postgres Extension for DBA and Developer during MigrationMust Know Postgres Extension for DBA and Developer during Migration
Must Know Postgres Extension for DBA and Developer during Migration
 
“Temporal Event Neural Networks: A More Efficient Alternative to the Transfor...
“Temporal Event Neural Networks: A More Efficient Alternative to the Transfor...“Temporal Event Neural Networks: A More Efficient Alternative to the Transfor...
“Temporal Event Neural Networks: A More Efficient Alternative to the Transfor...
 
AppSec PNW: Android and iOS Application Security with MobSF
AppSec PNW: Android and iOS Application Security with MobSFAppSec PNW: Android and iOS Application Security with MobSF
AppSec PNW: Android and iOS Application Security with MobSF
 
Crafting Excellence: A Comprehensive Guide to iOS Mobile App Development Serv...
Crafting Excellence: A Comprehensive Guide to iOS Mobile App Development Serv...Crafting Excellence: A Comprehensive Guide to iOS Mobile App Development Serv...
Crafting Excellence: A Comprehensive Guide to iOS Mobile App Development Serv...
 
The Microsoft 365 Migration Tutorial For Beginner.pptx
The Microsoft 365 Migration Tutorial For Beginner.pptxThe Microsoft 365 Migration Tutorial For Beginner.pptx
The Microsoft 365 Migration Tutorial For Beginner.pptx
 
Northern Engraving | Modern Metal Trim, Nameplates and Appliance Panels
Northern Engraving | Modern Metal Trim, Nameplates and Appliance PanelsNorthern Engraving | Modern Metal Trim, Nameplates and Appliance Panels
Northern Engraving | Modern Metal Trim, Nameplates and Appliance Panels
 
Monitoring and Managing Anomaly Detection on OpenShift.pdf
Monitoring and Managing Anomaly Detection on OpenShift.pdfMonitoring and Managing Anomaly Detection on OpenShift.pdf
Monitoring and Managing Anomaly Detection on OpenShift.pdf
 
LF Energy Webinar: Carbon Data Specifications: Mechanisms to Improve Data Acc...
LF Energy Webinar: Carbon Data Specifications: Mechanisms to Improve Data Acc...LF Energy Webinar: Carbon Data Specifications: Mechanisms to Improve Data Acc...
LF Energy Webinar: Carbon Data Specifications: Mechanisms to Improve Data Acc...
 
Mutation Testing for Task-Oriented Chatbots
Mutation Testing for Task-Oriented ChatbotsMutation Testing for Task-Oriented Chatbots
Mutation Testing for Task-Oriented Chatbots
 
"Frontline Battles with DDoS: Best practices and Lessons Learned", Igor Ivaniuk
"Frontline Battles with DDoS: Best practices and Lessons Learned",  Igor Ivaniuk"Frontline Battles with DDoS: Best practices and Lessons Learned",  Igor Ivaniuk
"Frontline Battles with DDoS: Best practices and Lessons Learned", Igor Ivaniuk
 
Overcoming the PLG Trap: Lessons from Canva's Head of Sales & Head of EMEA Da...
Overcoming the PLG Trap: Lessons from Canva's Head of Sales & Head of EMEA Da...Overcoming the PLG Trap: Lessons from Canva's Head of Sales & Head of EMEA Da...
Overcoming the PLG Trap: Lessons from Canva's Head of Sales & Head of EMEA Da...
 
Skybuffer SAM4U tool for SAP license adoption
Skybuffer SAM4U tool for SAP license adoptionSkybuffer SAM4U tool for SAP license adoption
Skybuffer SAM4U tool for SAP license adoption
 
Essentials of Automations: Exploring Attributes & Automation Parameters
Essentials of Automations: Exploring Attributes & Automation ParametersEssentials of Automations: Exploring Attributes & Automation Parameters
Essentials of Automations: Exploring Attributes & Automation Parameters
 
Session 1 - Intro to Robotic Process Automation.pdf
Session 1 - Intro to Robotic Process Automation.pdfSession 1 - Intro to Robotic Process Automation.pdf
Session 1 - Intro to Robotic Process Automation.pdf
 
"Scaling RAG Applications to serve millions of users", Kevin Goedecke
"Scaling RAG Applications to serve millions of users",  Kevin Goedecke"Scaling RAG Applications to serve millions of users",  Kevin Goedecke
"Scaling RAG Applications to serve millions of users", Kevin Goedecke
 
Connector Corner: Seamlessly power UiPath Apps, GenAI with prebuilt connectors
Connector Corner: Seamlessly power UiPath Apps, GenAI with prebuilt connectorsConnector Corner: Seamlessly power UiPath Apps, GenAI with prebuilt connectors
Connector Corner: Seamlessly power UiPath Apps, GenAI with prebuilt connectors
 
5th LF Energy Power Grid Model Meet-up Slides
5th LF Energy Power Grid Model Meet-up Slides5th LF Energy Power Grid Model Meet-up Slides
5th LF Energy Power Grid Model Meet-up Slides
 
Christine's Supplier Sourcing Presentaion.pptx
Christine's Supplier Sourcing Presentaion.pptxChristine's Supplier Sourcing Presentaion.pptx
Christine's Supplier Sourcing Presentaion.pptx
 
Christine's Product Research Presentation.pptx
Christine's Product Research Presentation.pptxChristine's Product Research Presentation.pptx
Christine's Product Research Presentation.pptx
 

Physics IRP

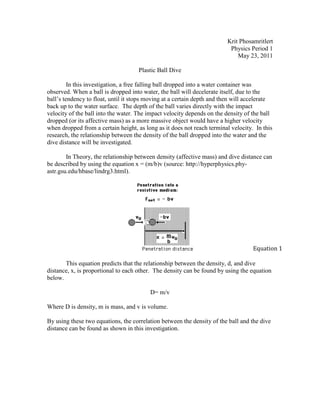
  • 1. Krit Phosamritlert Physics Period 1 May 23, 2011 Plastic Ball Dive In this investigation, a free falling ball dropped into a water container was observed. When a ball is dropped into water, the ball will decelerate itself, due to the ball’s tendency to float, until it stops moving at a certain depth and then will accelerate back up to the water surface. The depth of the ball varies directly with the impact velocity of the ball into the water. The impact velocity depends on the density of the ball dropped (or its affective mass) as a more massive object would have a higher velocity when dropped from a certain height, as long as it does not reach terminal velocity. In this research, the relationship between the density of the ball dropped into the water and the dive distance will be investigated. In Theory, the relationship between density (affective mass) and dive distance can be described by using the equation x = (m/b)v (source: http://hyperphysics.phy- astr.gsu.edu/hbase/lindrg3.html). Equation 1 This equation predicts that the relationship between the density, d, and dive distance, x, is proportional to each other. The density can be found by using the equation below. D= m/v Where D is density, m is mass, and v is volume. By using these two equations, the correlation between the density of the ball and the dive distance can be found as shown in this investigation.
  • 2. Design: Research Question: What is the relationship between the density and the dive distance of a free falling ball into water? Variables: The independent variable is the density of the ball while the dependent variable is the dive distance of the plastic ball into the water. The controlled variables are the height of the water (43 ± 1 cm) which was controlled by adding water if the water level goes below 43 cm. The surface of the water was kept constant by waiting for the waves to dissipate before doing the next trial. The temperature of the room was controlled at 27 ± 1°C by turning the air conditioning unit in front of the direction of the ball off. The type of ball used was kept constant by using the exact same ball for every trial. The camera and the angle of the camera were kept constant by using a tripod. Procedure: A six sided water container with approximately 60 ± 1 cm in height, a base perimeter approximately 108 ± 1 cm, and the top perimeter approximately 126 ± 1 cm, was filled with water up to 43 ± 1 cm from the base of the container. The plastic ball was then dropped from the ceiling of the room, about 240 ± 1 cm, and the density of the ball was changed by adding water into the ball. The ball was then weighed with an electronic scale and recorded. Each time the water was added to the ball, the ball was used in the experiment three times. The ball was centered on the container by using a string that was taped on the roof of the room that was aimed at the center of the container. The slow motion camera was set up so that it records perpendicular to the surface of the water and about 1.5 meters away from the container, in case of splashing water coming out of the container. The camera was then set at high-speed mode (420 frames per second). Lights were set around the container to provide light for the high-speed camera. Record. After three trials water was added into the ball using a pumper. Using logger pro, the video was imported and analyzed for the dive distance of the ball frame by frame, measuring the position displacement until no further advancement is made. Record dive distance. After the experiment was done the ball was then cut to measure the diameter of the ball.
  • 3. Meter Stick Water filled to 43cm Figure 1: Shows the setup of the container and the scale device (meter stick) for the camera to record. Data Collecting and Processing: Camera used: Casio Exilim Ex-FS10 Diameter of the squash ball: 13 ± 1 cm There was no height uncertainty due to the fact that the ball was placed right on the ceiling before each trial.
  • 4. Mass (± 0.01 g) Trial 58.86 1 75.80 2 111.11 3 148.00 4 160.60 5 215.60 6 Table 1: Shows the raw data of the mass that was recorded of each trial By using the data above, the density of the ball was calculated using the equation shown below. D = m/v Where D is the density, m is the mass, and v is the volume. To calculate the volume, the equation below was used. V = (4/3)πr3 After the density of the ball of each trial was found, the data that was analyzed from the video in LoggerPro was put into comparison as shown by the table below. Density Trial Dive Distance (±0.6 cm) (± 0.001 g/cm3) 1 3.31 0.051 2 2.19 3 2.85 Average 2.78 1 7.70 0.066 2 7.42 3 7.68 Average 7.60 1 9.94 0.097 2 9.77 3 8.57 Average 9.43 1 9.48 0.129 2 10.44 3 10.48 Average 10.13 1 11.53 0.140 2 11.26 3 11.33 Average 11.37
  • 5. 1 14.69 0.187 2 13.32 3 13.33 Average 13.78 Table 2: This is the raw data that was analyzed from the video showing correlation between the dive distance and also the calculated density of the ball. Figure 2: This is a sample graph of density (0.129 ± 0.001 g/cm3) 4 trial 1 showing the maximum dive distance the ball reached of -9.48 (±0.01 cm). The more negative the ball’s position, the deeper the dive distance.
  • 6. Figure 3: This graph shows the density of the ball in correlation to the dive distance which is close to one which shows a linear relationship. Figure 4: Shows the high low fit for the data range showing the level of confidence of the data. The first data point was left out due to it being an outlier.
  • 7. Sample Calculation: 1. Determining the volume of the ball a. V = (4/3)πr3 b. (4/3)(π)(6.5cm)3 c. V = 1150.35 2. Determining the density of the ball density 4 trial 1 a. D = m/v b. 148.00g/1150.35cm3 c. D = 0.129g/cm3 3. Uncertainty of dive distance for density 1 (highest uncertainty) a. (high – low) / 2 b. Dive distance high = 3.31cm c. Dive distance low = 2.19cm d. (3.31cm - 2.19cm)/2 = 0.6cm Conclusion: According to figure 3, the relationship between the density of the plastic ball and the dive distance of the ball is a linear relationship. This can be seen in the following equation: y = 50 (± 20) x + 4 (± 2) The equation above contradicts the theory mentioned in the introduction due to the fact that the theory predicts that the relationship would be a proportional one. This is due to the fact that there are many factors that affect the dive distance of the ball such as surface tension, buoyancy of the ball, and the viscosity of water. The surface tension and the buoyancy of the ball would act as an upwards force pushing the ball upwards and therefore would decrease the dive distance. The viscosity of water would also affect the dive distance since the ball changes medium during its free fall. These factors add result in the value of the y-intercept which makes the relationship a linear relationship rather than a proportional relationship as predicted by the theory. Despite the fact that many factors that would affect the result were overlooked, the quality of the data seems to be quite accurate, excluding the outlier of the first density trials. The linear fit went through all the error bars which mean that the data is within the accepted error range. The results from this investigation is only applicable to specific conditions such as the ball must be exactly the same as the one used in this investigation, the factors that also affect the dive distance and velocity of the ball must not be included into the system, and also performed at low heights (2-3 meters) since if the ball has enough time to reach its terminal velocity, then the change in density (or mass) would therefore have no effect since the object would be moving at terminal velocity and anymore increase would not increase the dive distance.
  • 8. Evaluation: One of the errors that occurred during the investigation would be the control of where the ball lands on the surface of the water. Since the camera cannot judge the depth of field, if the ball does not drop right in the center of the container, the dive distance that was analyzed from the video would vary. This is because the balls moving closer or further away from the scale object (the meter stick in this case). This error might be caused by the air flow inside the room since only the air conditioning unit in front of the ball was closed but not all of them. This might also be due to the fact that during this investigation a mechanical release mechanism was not used but rather using human hand so therefore there might be slight deviation between each drop. This is an example of a random error which could be improved by adding a mechanical release mechanism or using a pipe for the ball to fall into to control the landing spot of the ball. Another factor that could be improved would be the camera itself. Since the camera used in this investigation only had 420 frames per second setting, the amount of data collect was quite minimal. Also when this was imported to LoggerPro, the video was blurry and it was hard to judge where the position of the ball is. This systematic error can be improved by using a higher resolution camera that has a higher quality video capture capability and also have more frames per second timing. The water container was also too small making the water reflects off the side of the container and therefore hitting the ball. The water also splashes out of the container during each trial which would also affect the dive distance of the ball. This can be improved by using a larger container where the waves generated by the ball would not come back and affect the ball and where the water would not splash out. Also one of the data points in this investigation is seen as an outlier due to its low value according to figure 3. Since the ball did not contain any water initially, the ball would have a greater tendency to float than the rest of the trials so the ball would have less force pushing it downwards than the other trials that contained water in the ball. The ball’s own buoyancy would therefore have a force pushing upwards which would affect the dive distance. This can be improved by making the first trial contain some water already and not starting off with any water.