Download as PDF, PPTX


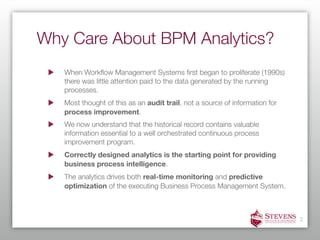

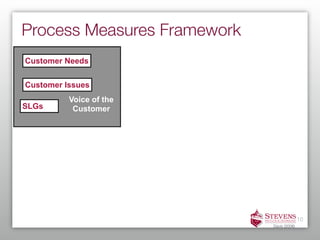
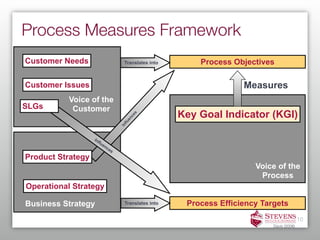
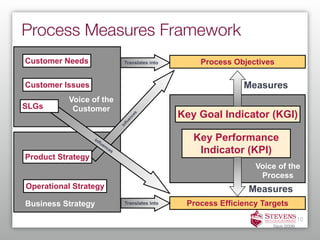

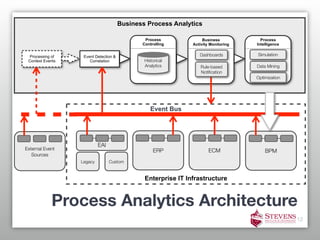
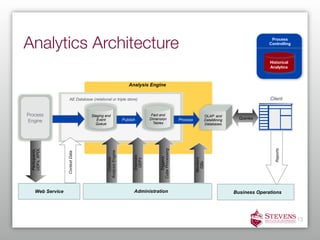


The document discusses the importance of business process management (BPM) analytics, emphasizing how valuable historical data can drive continuous process improvement and business intelligence. It outlines the evolution of BPM, the significance of analytics in real-time monitoring and predictive optimization, and various frameworks for measuring process performance. Additionally, it highlights the role of predictive simulation and the need for understanding semantics and context within BPM analytics.


