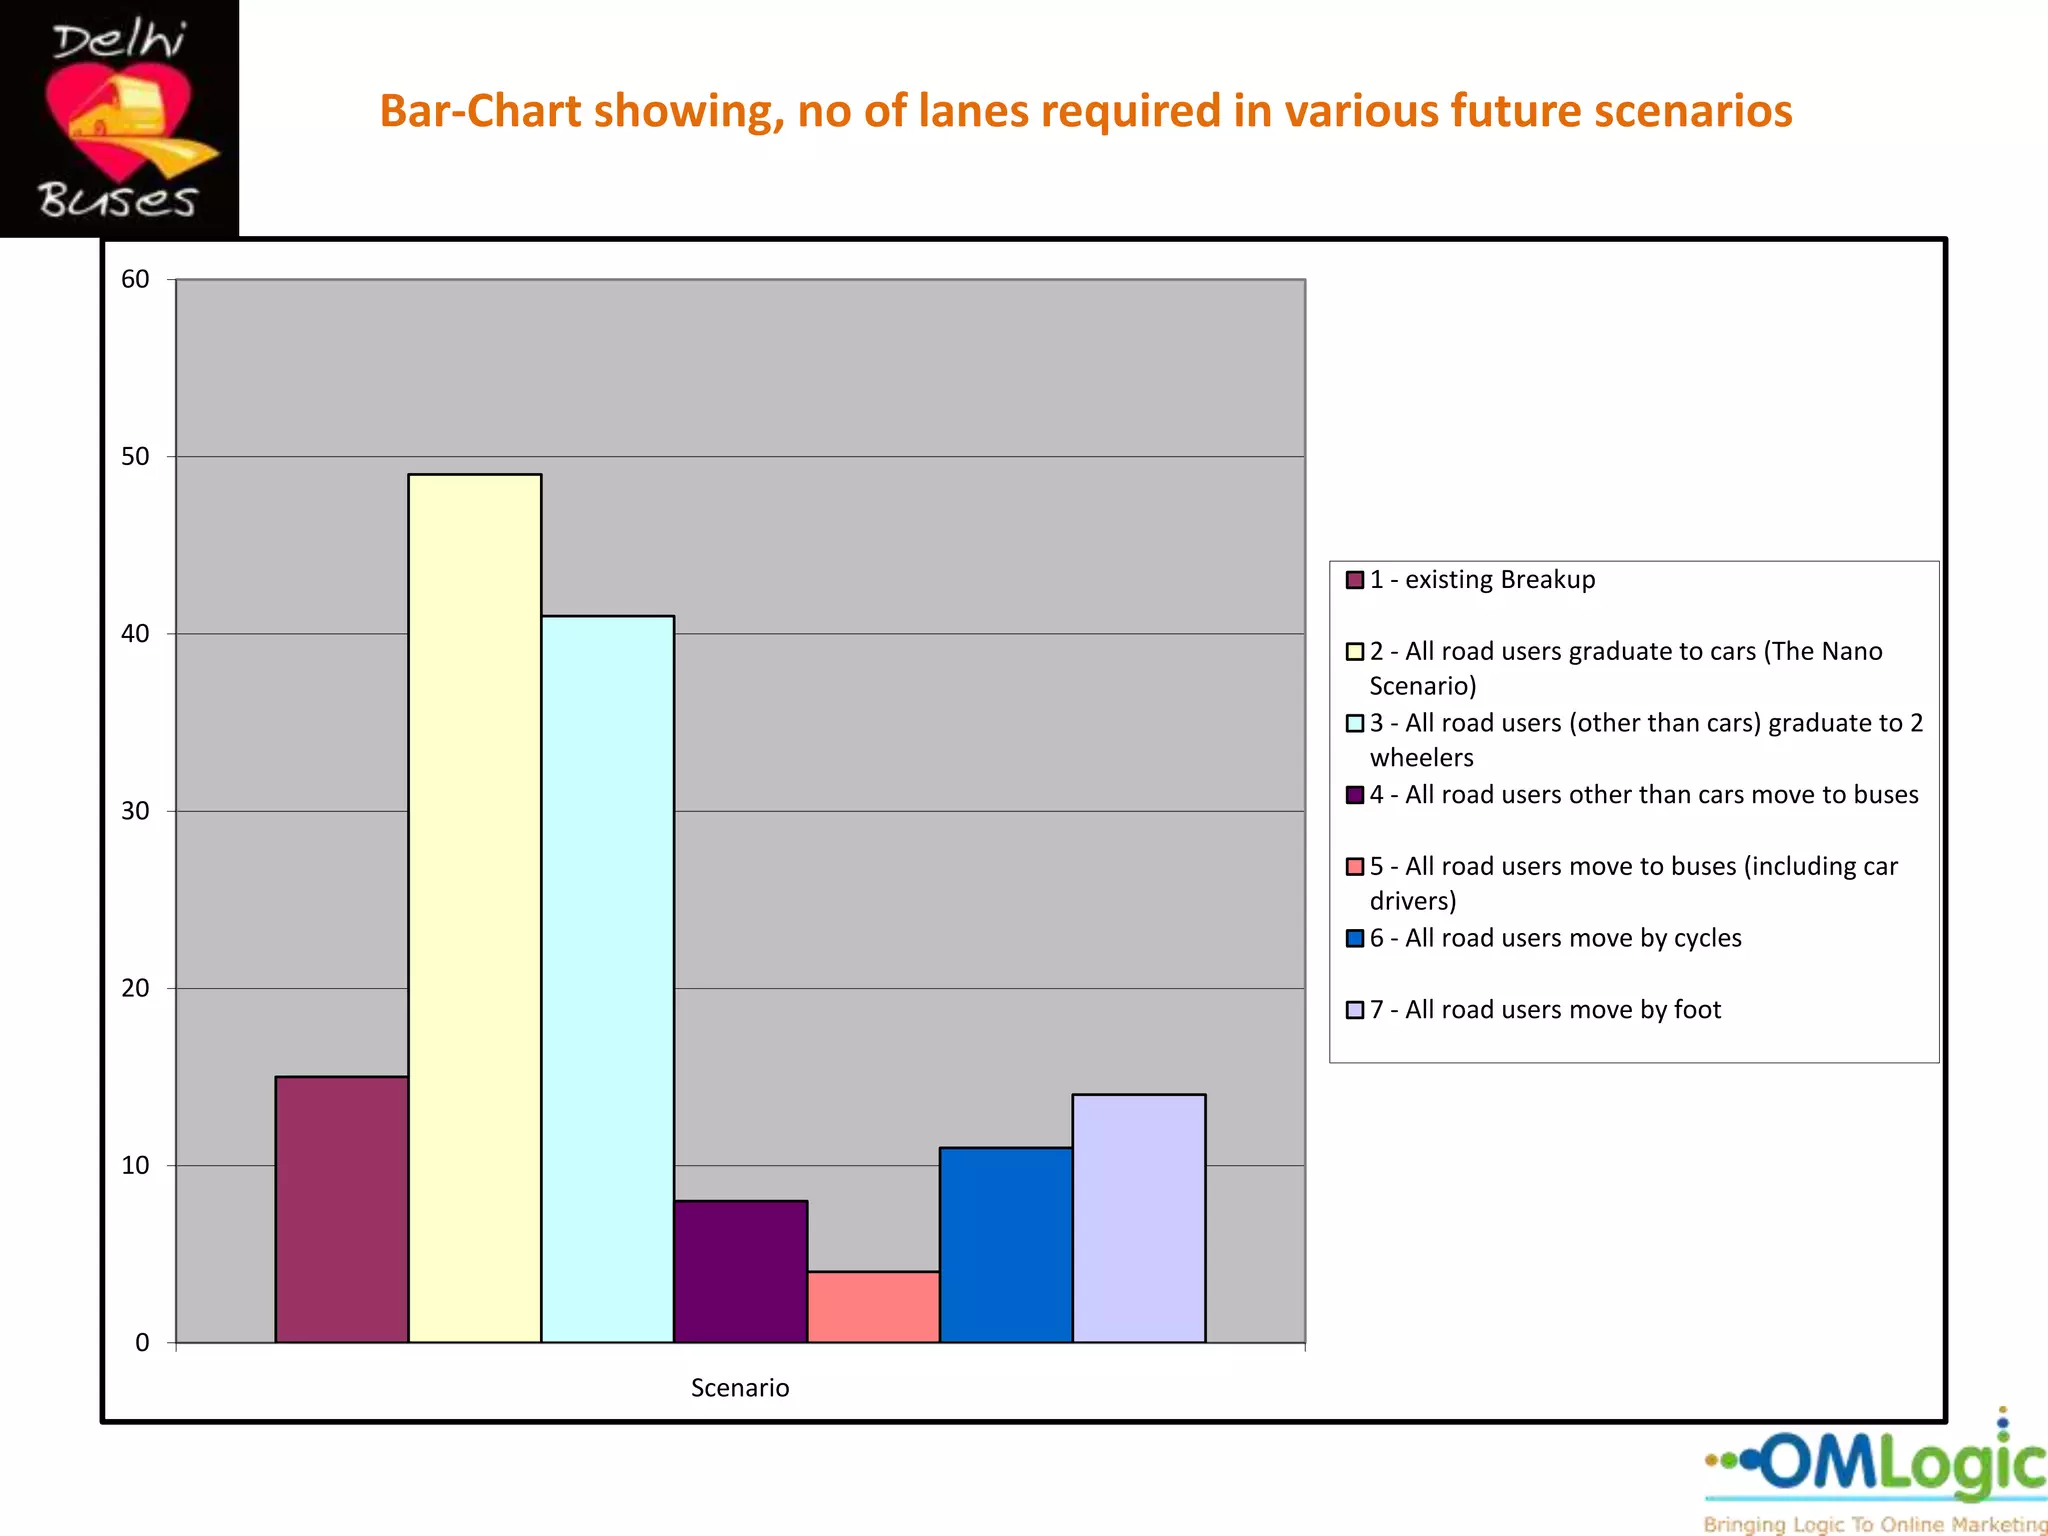
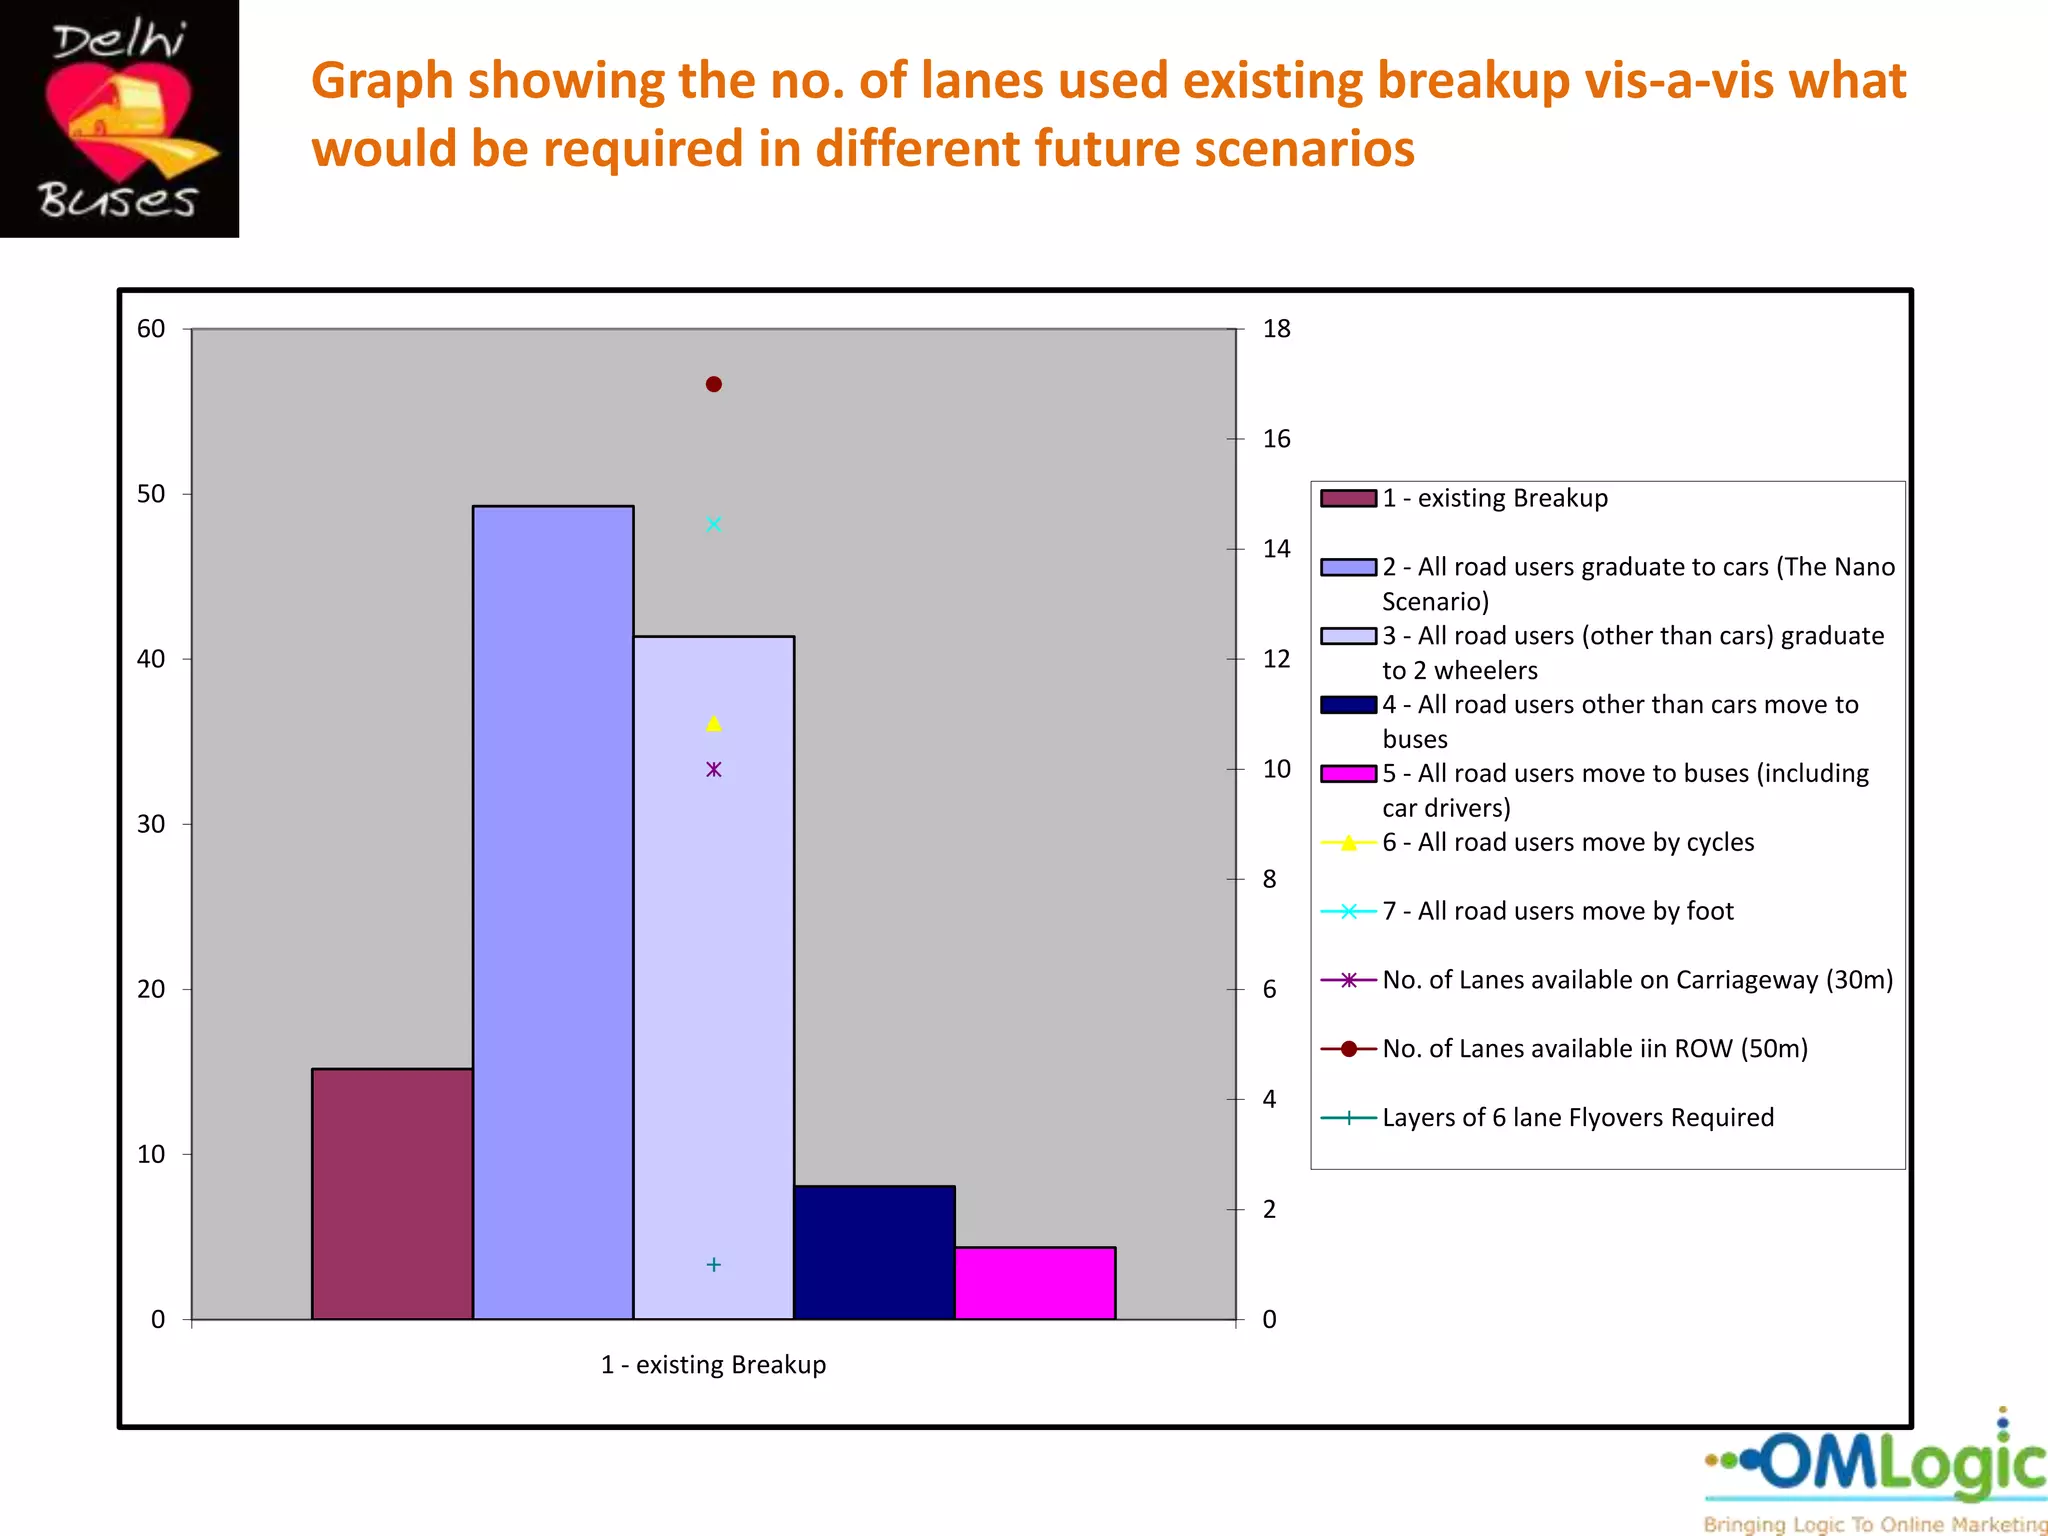
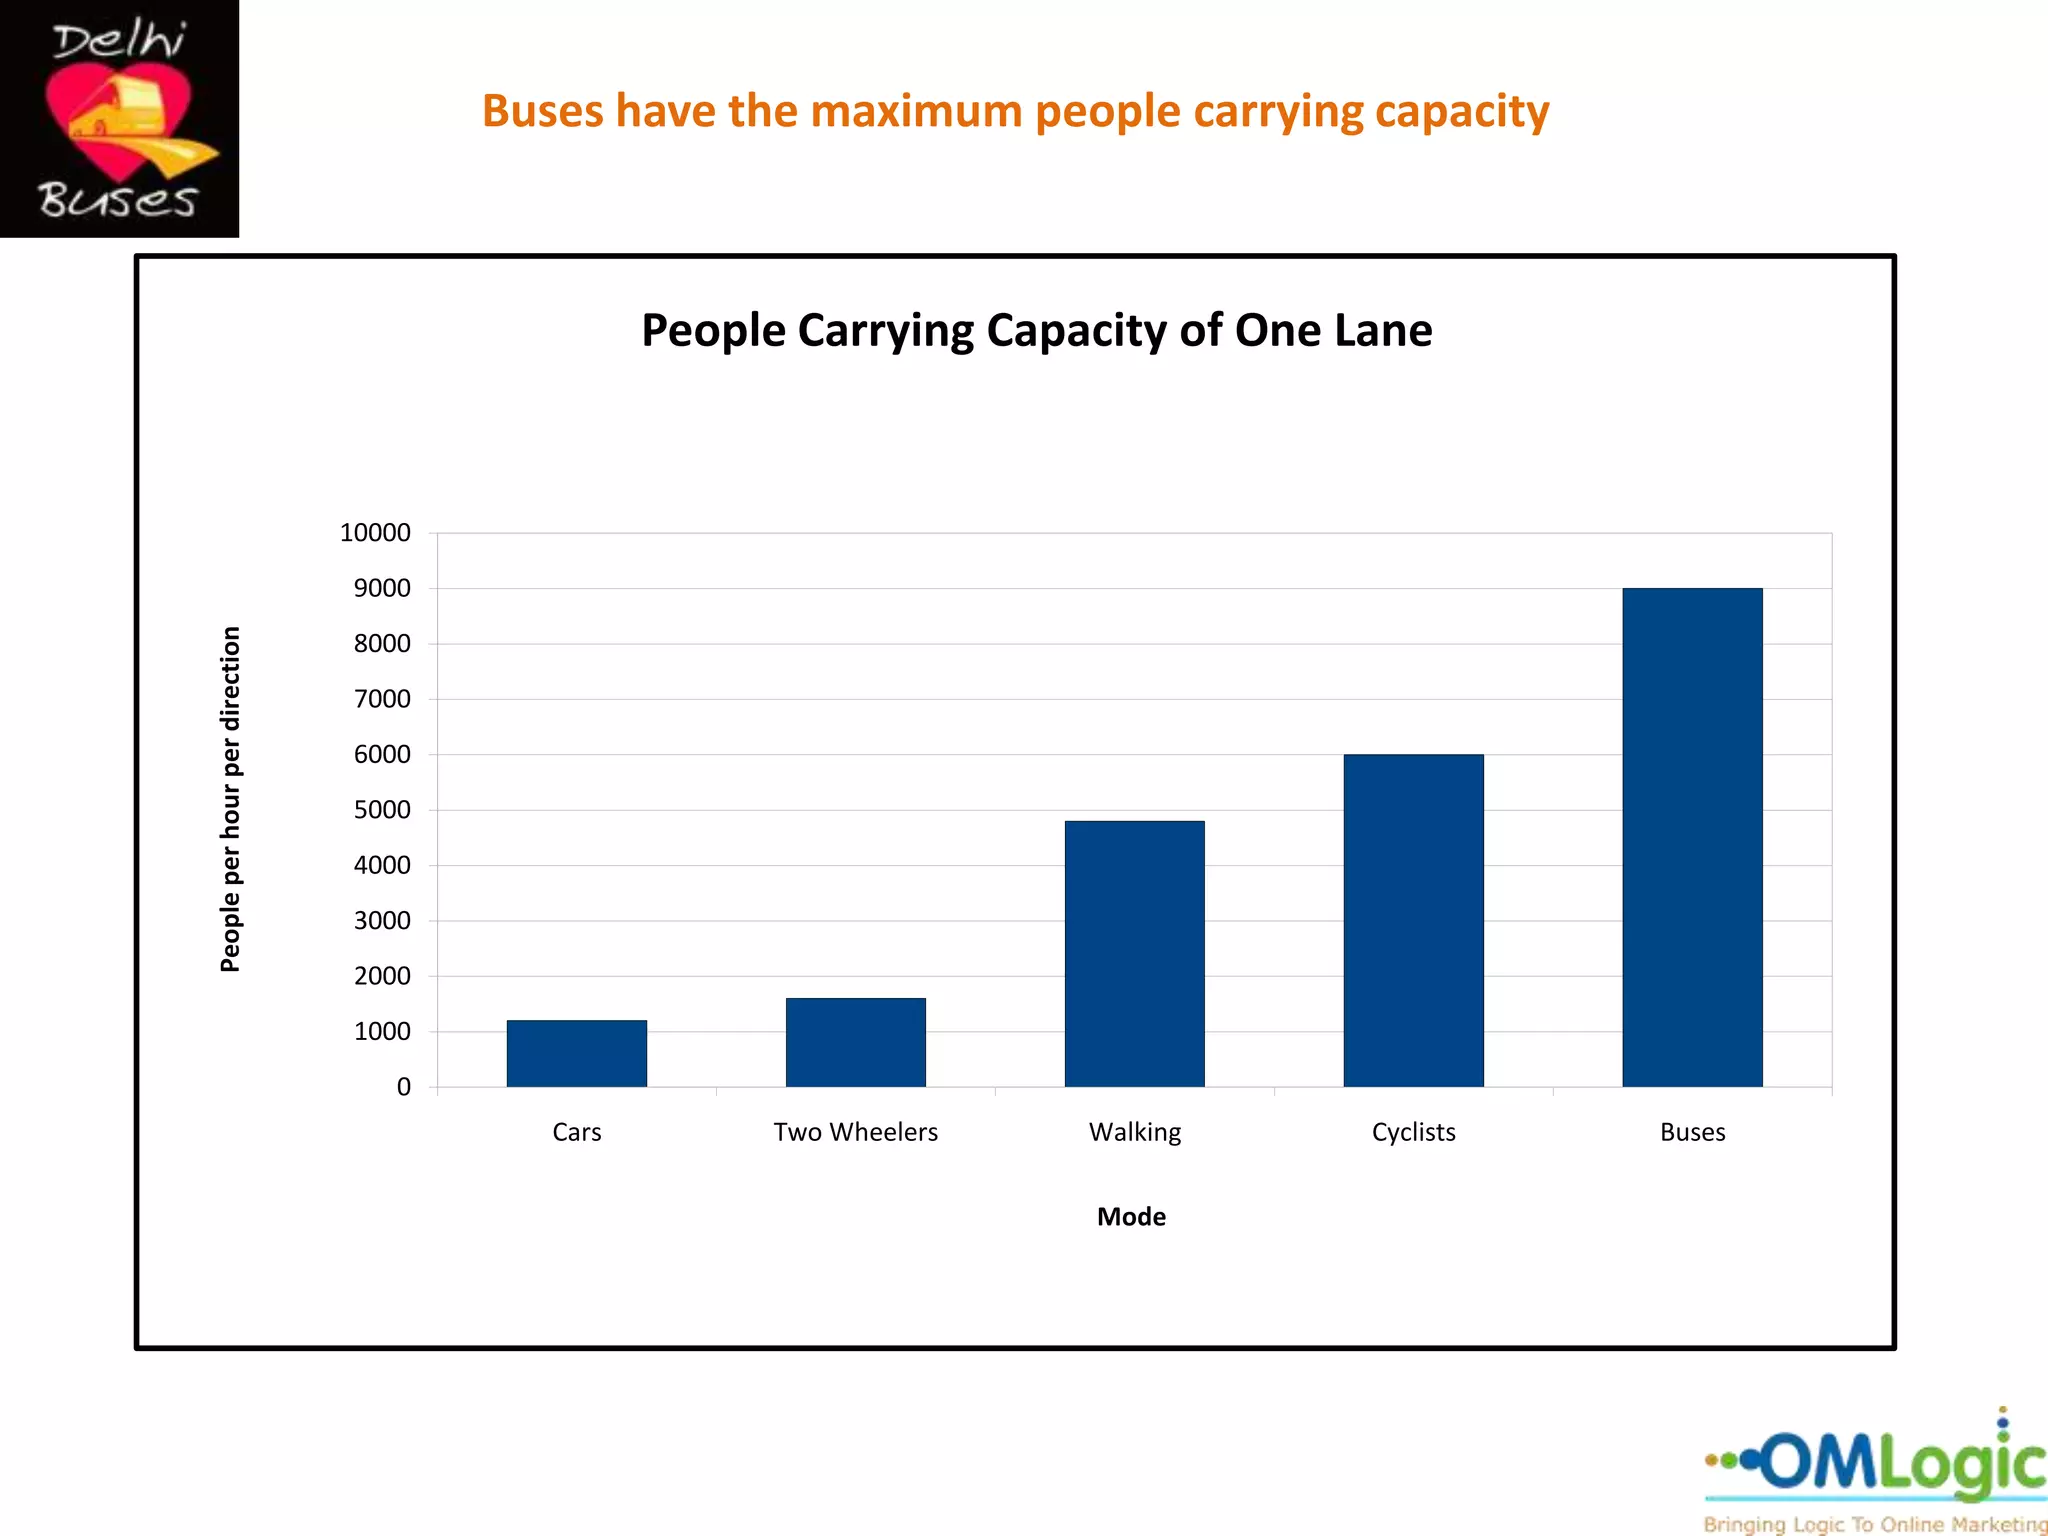
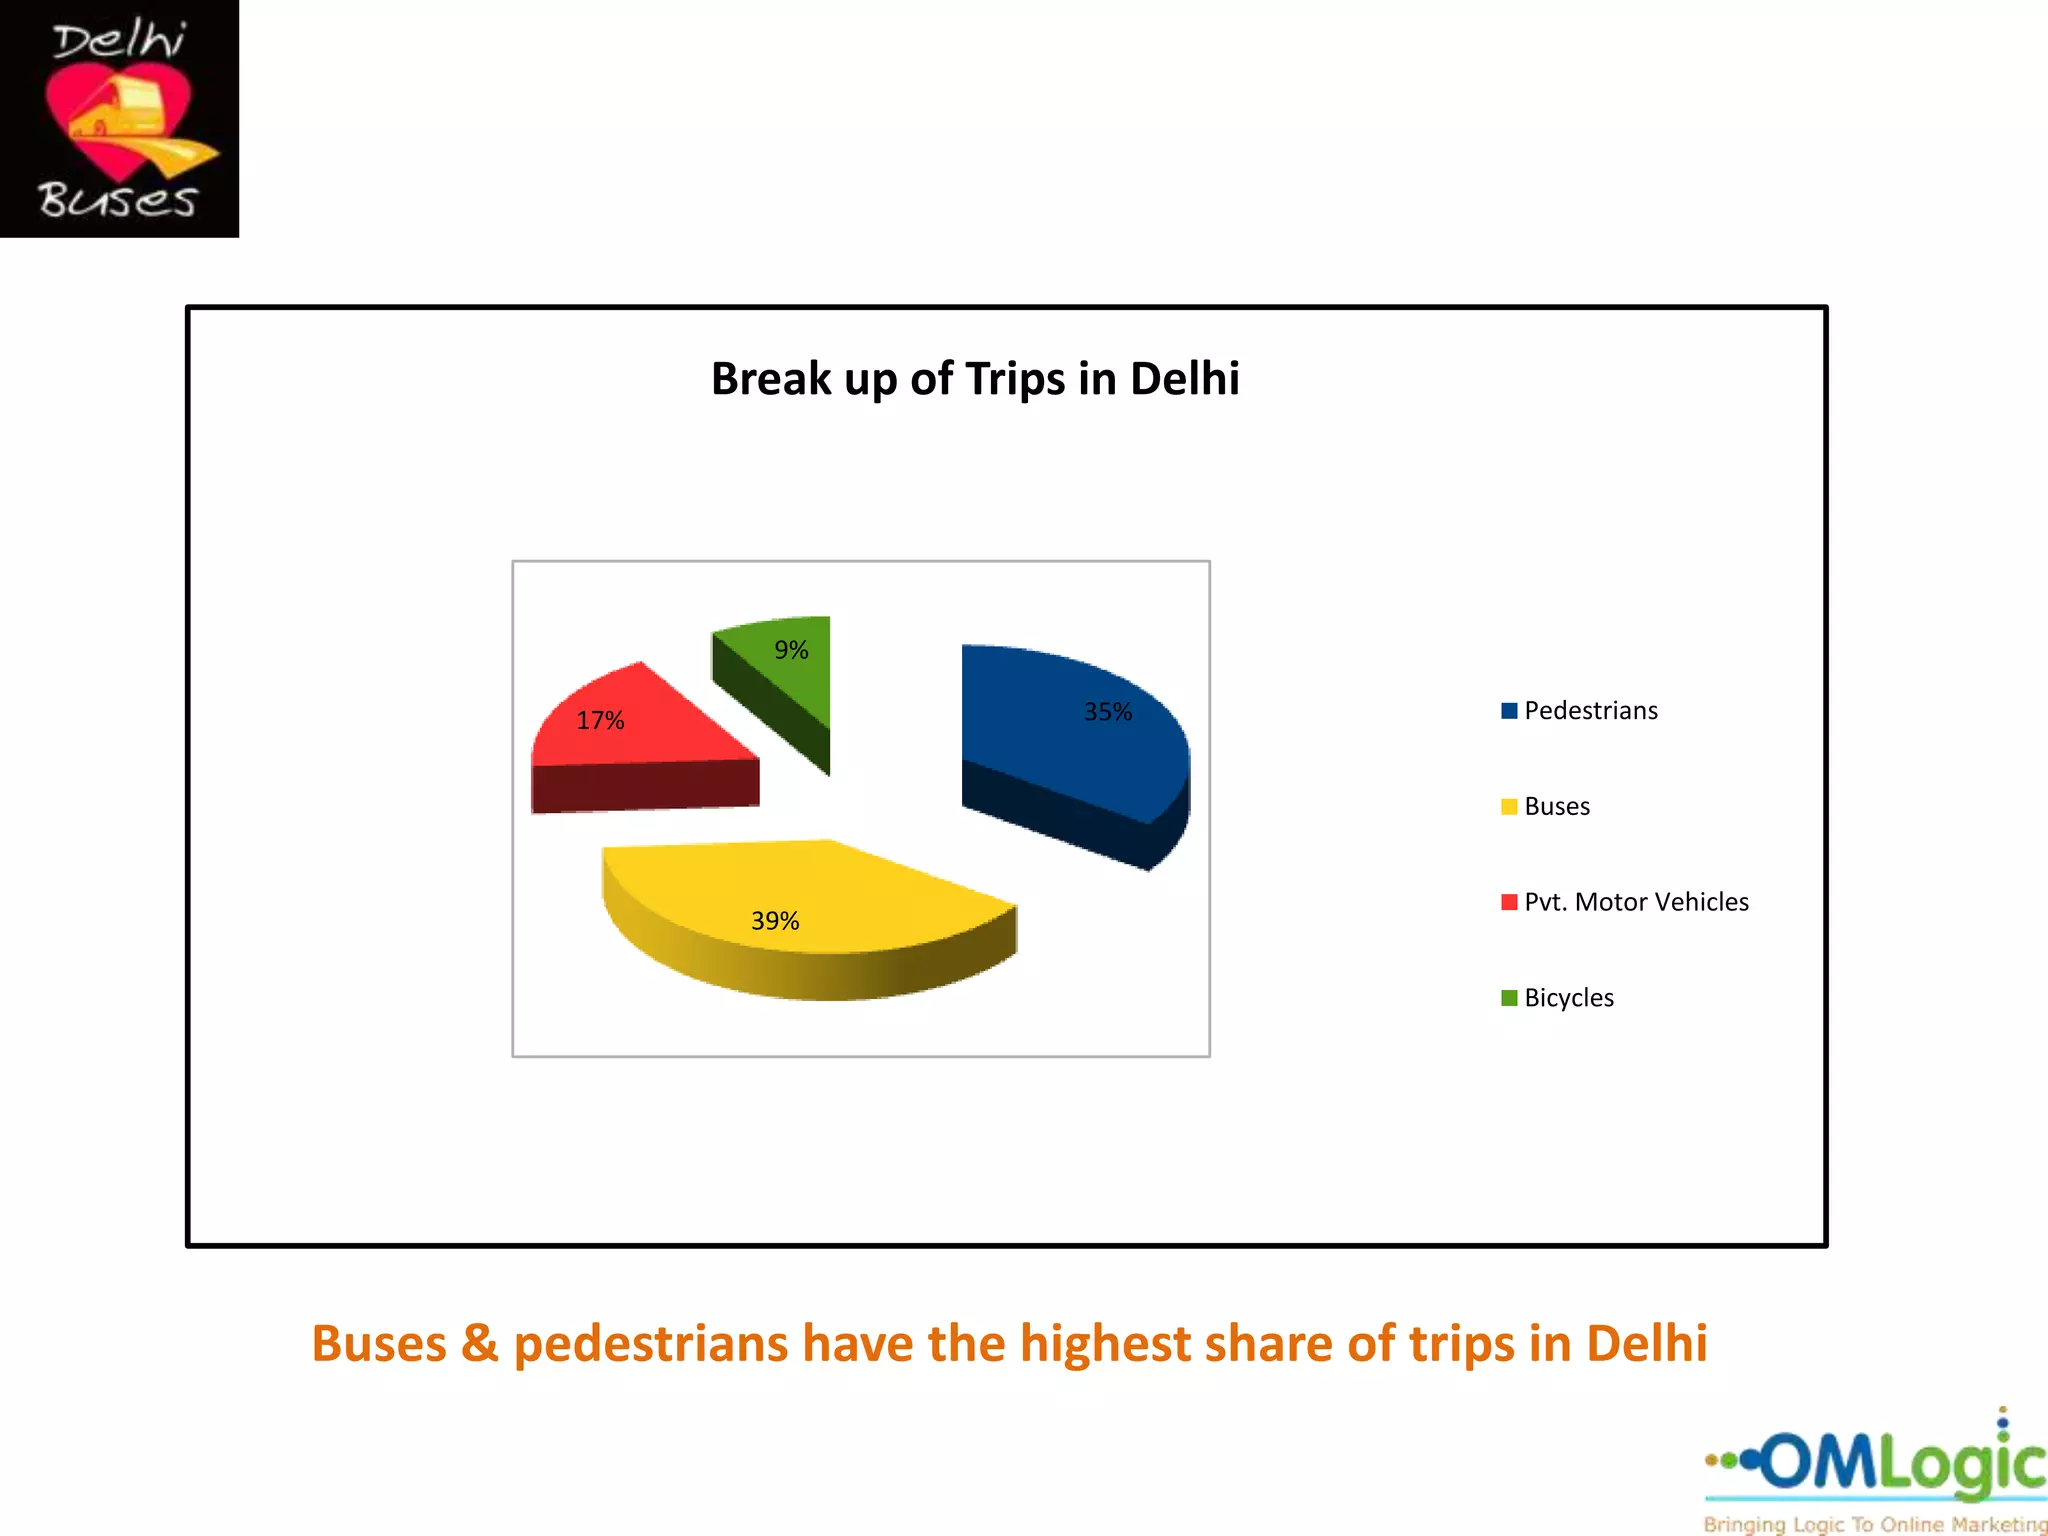
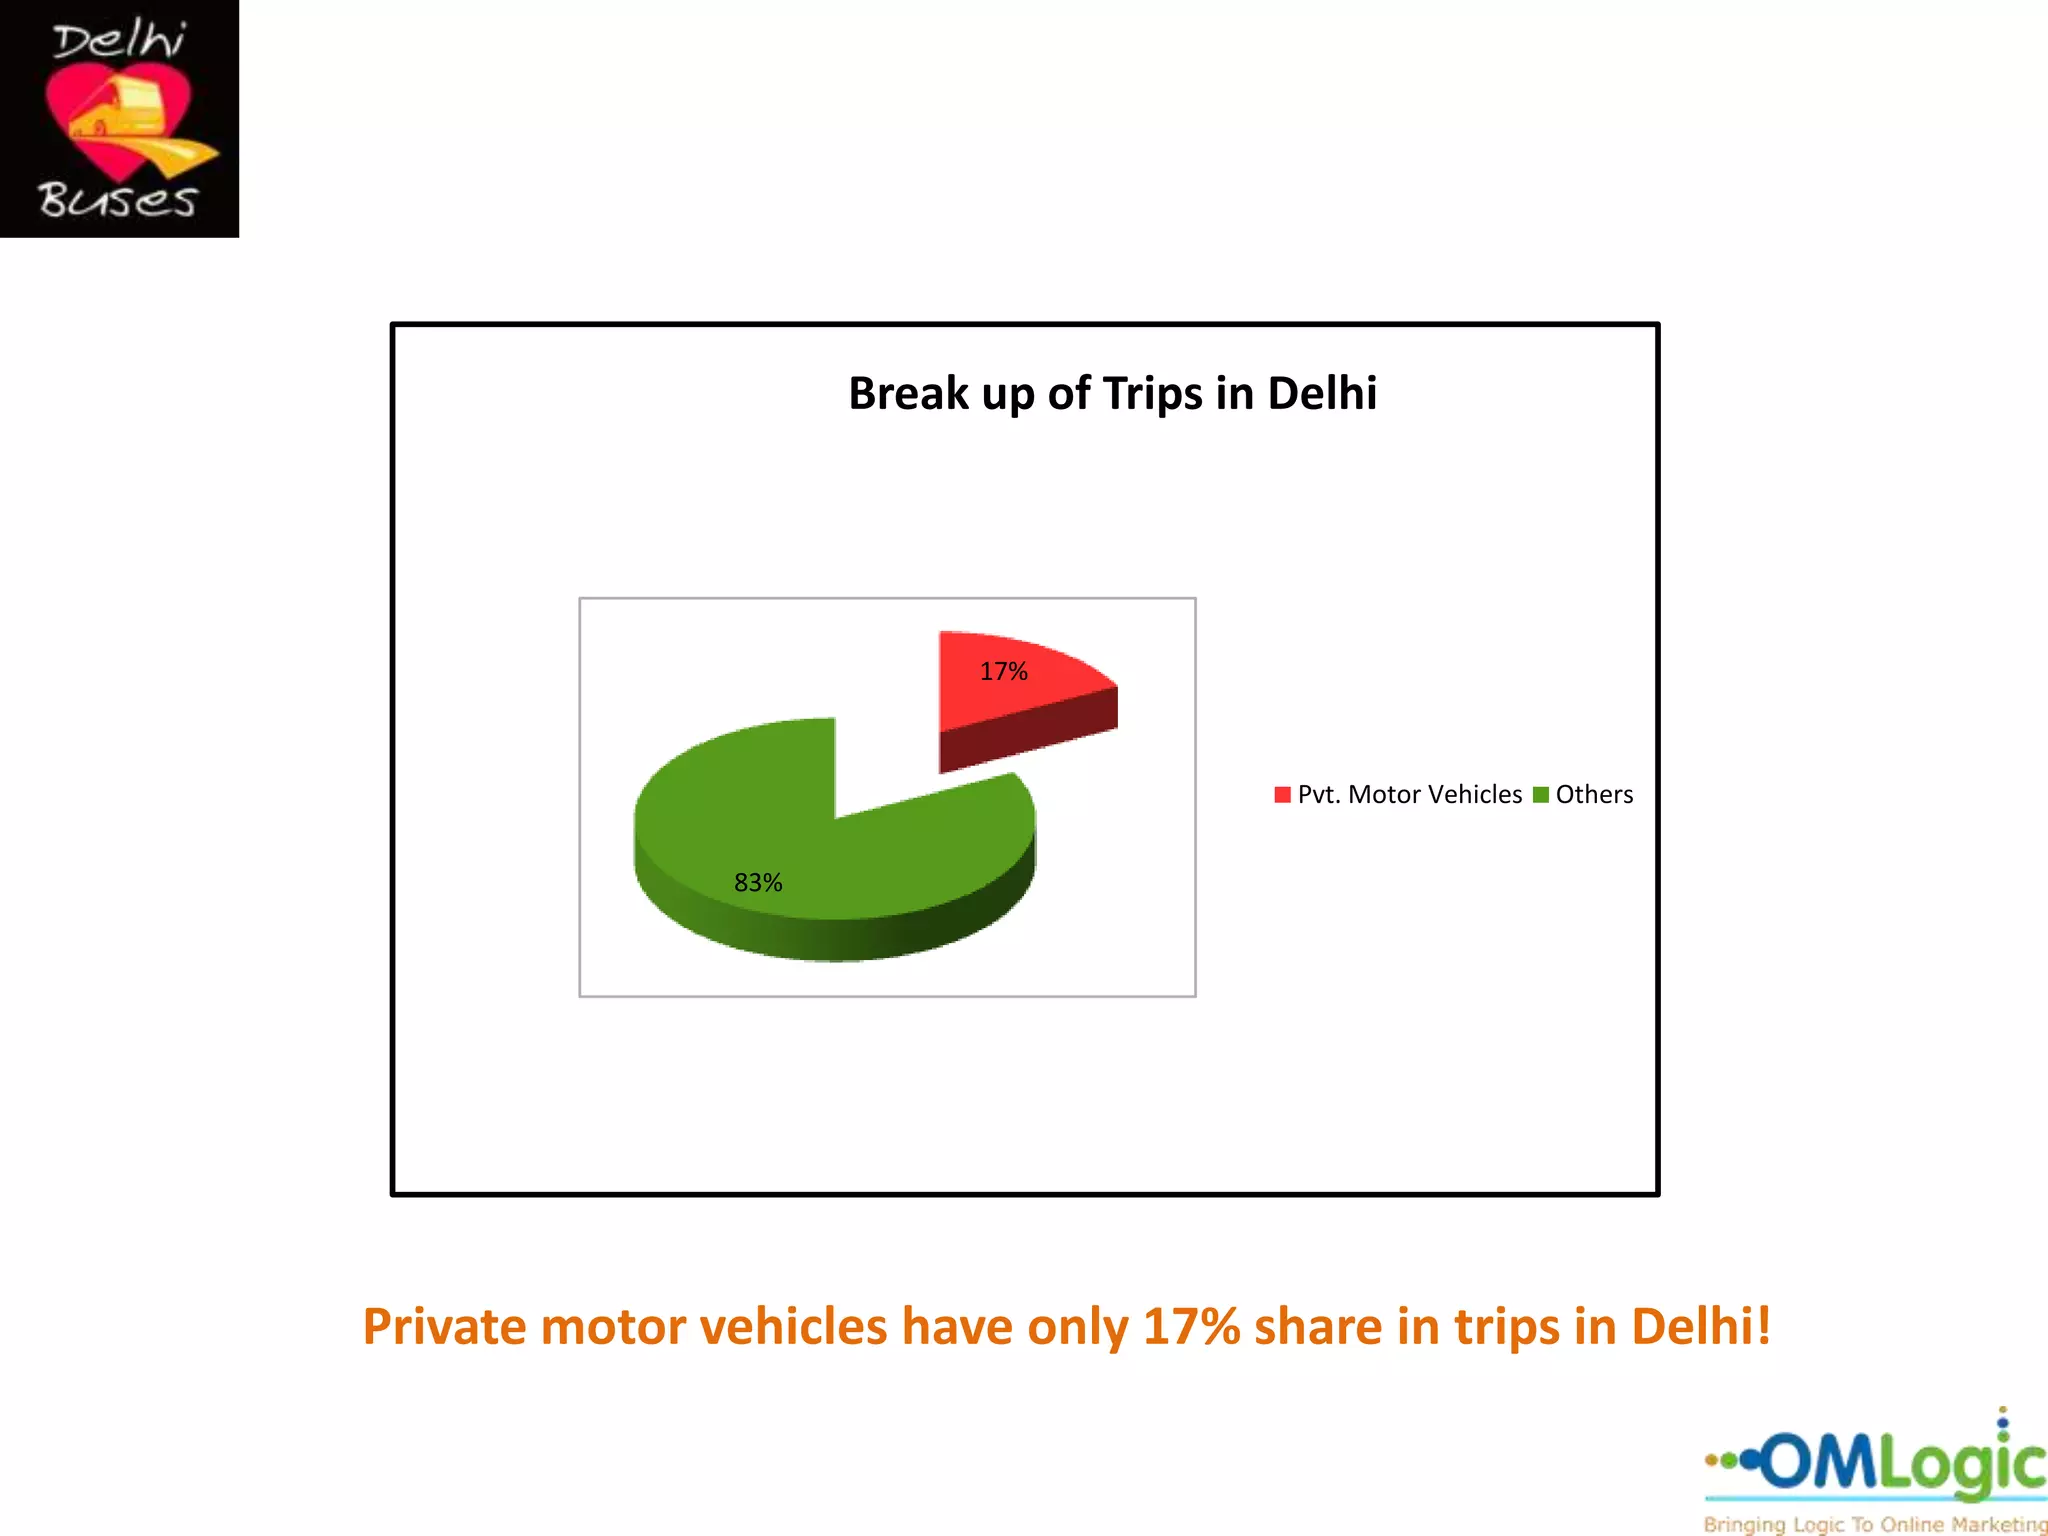
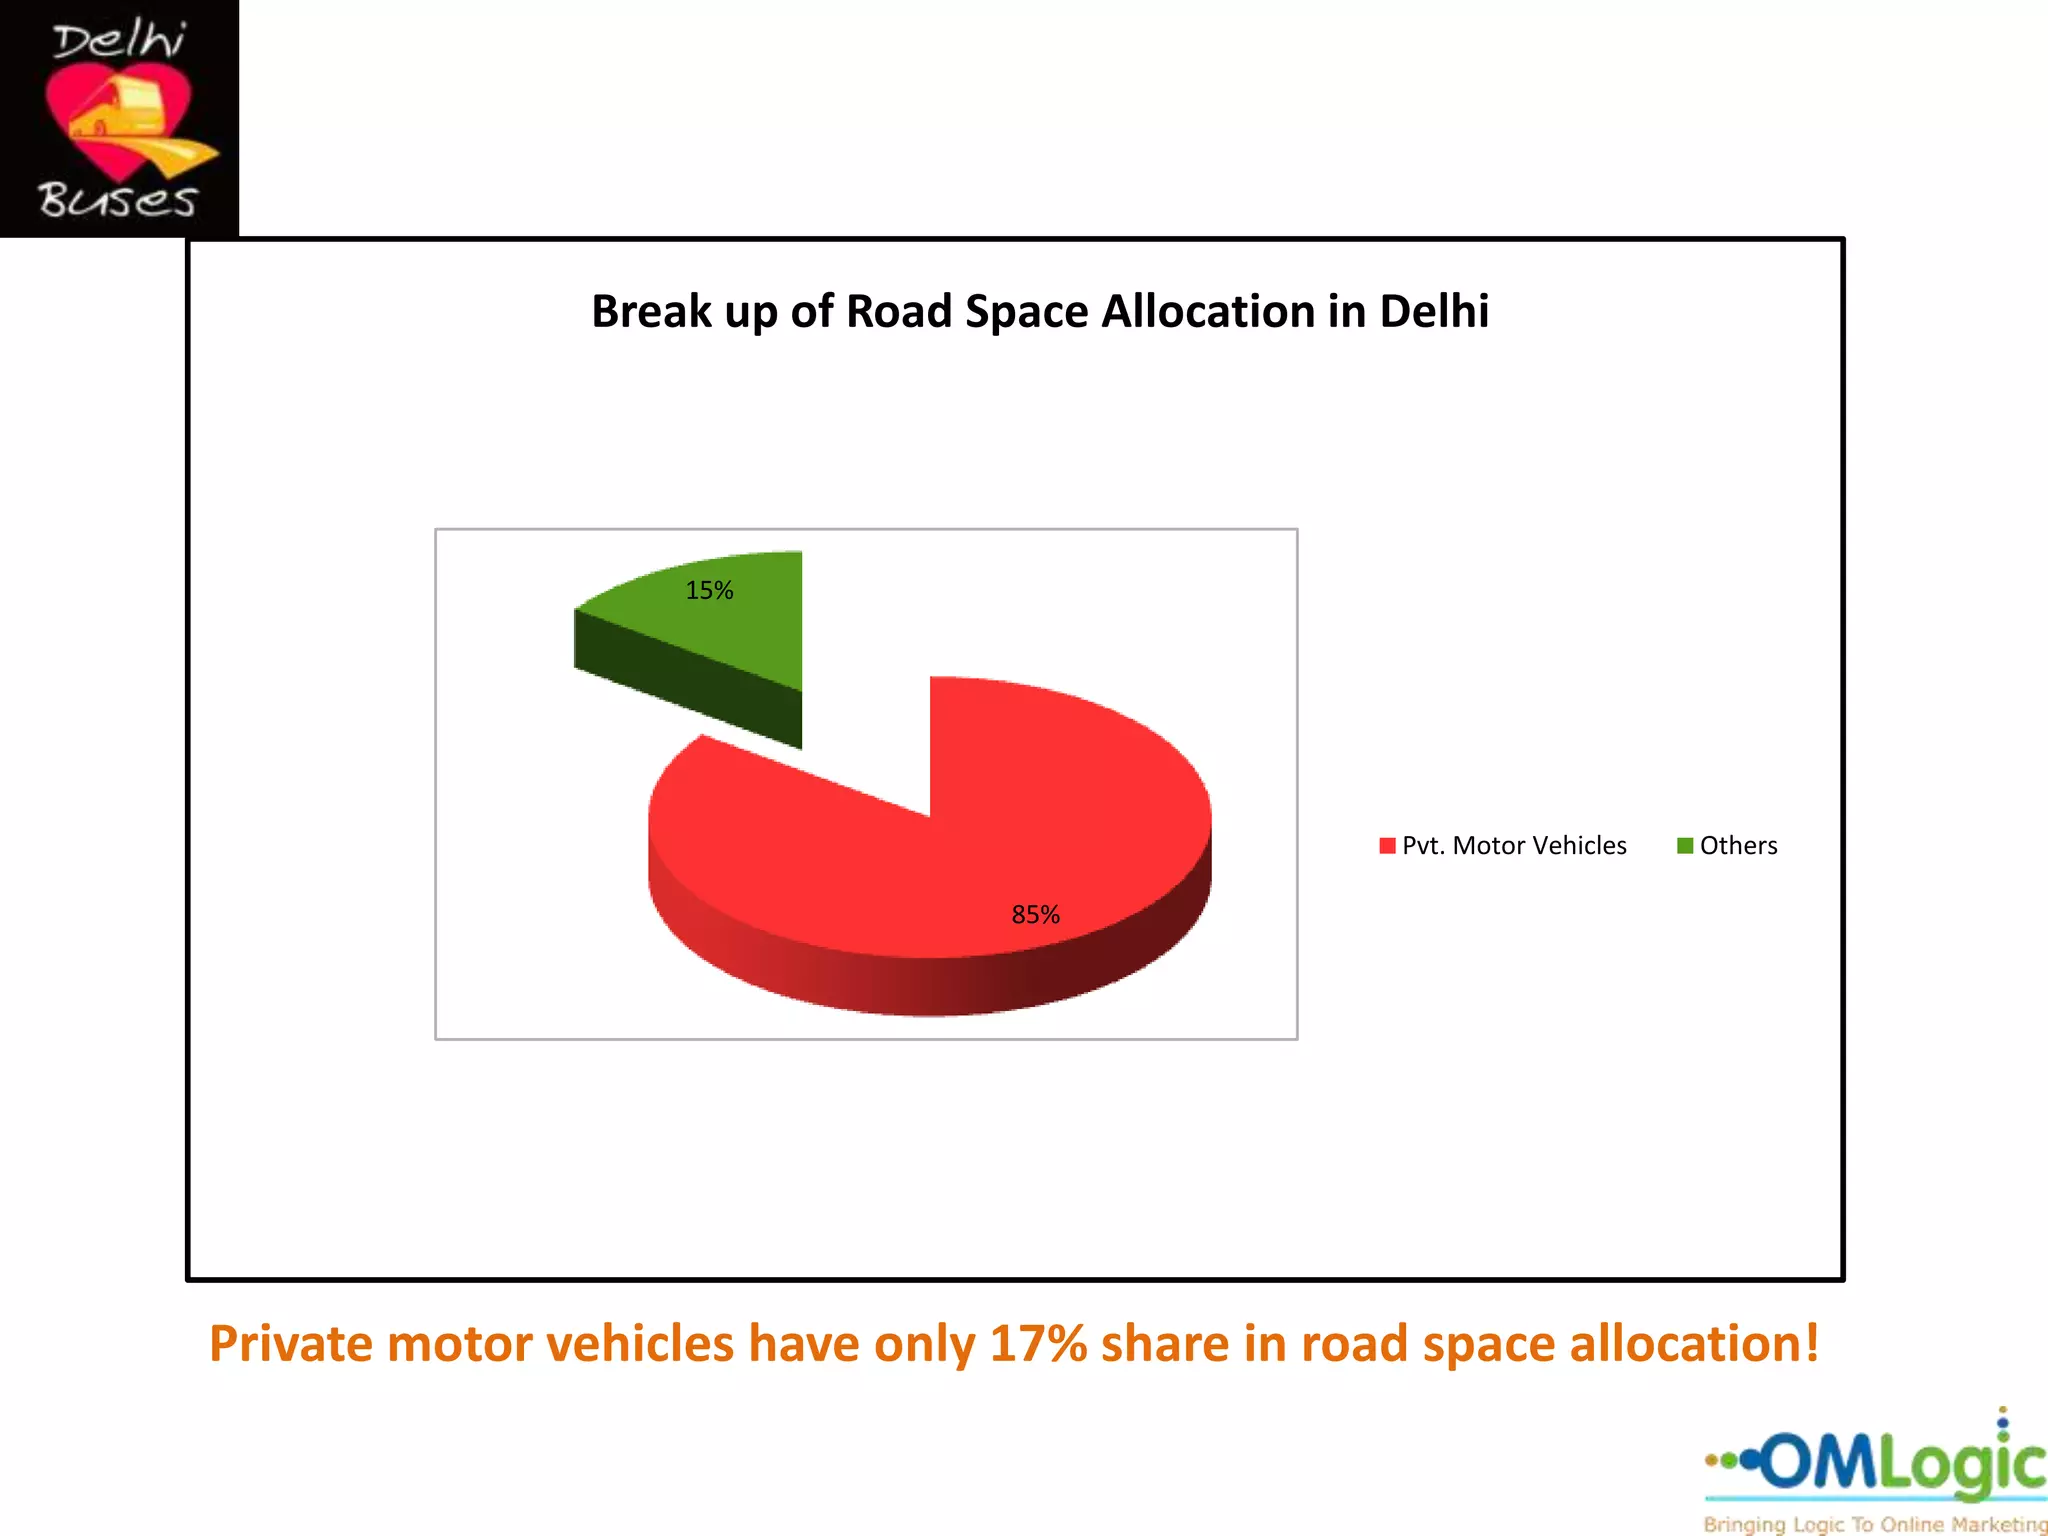
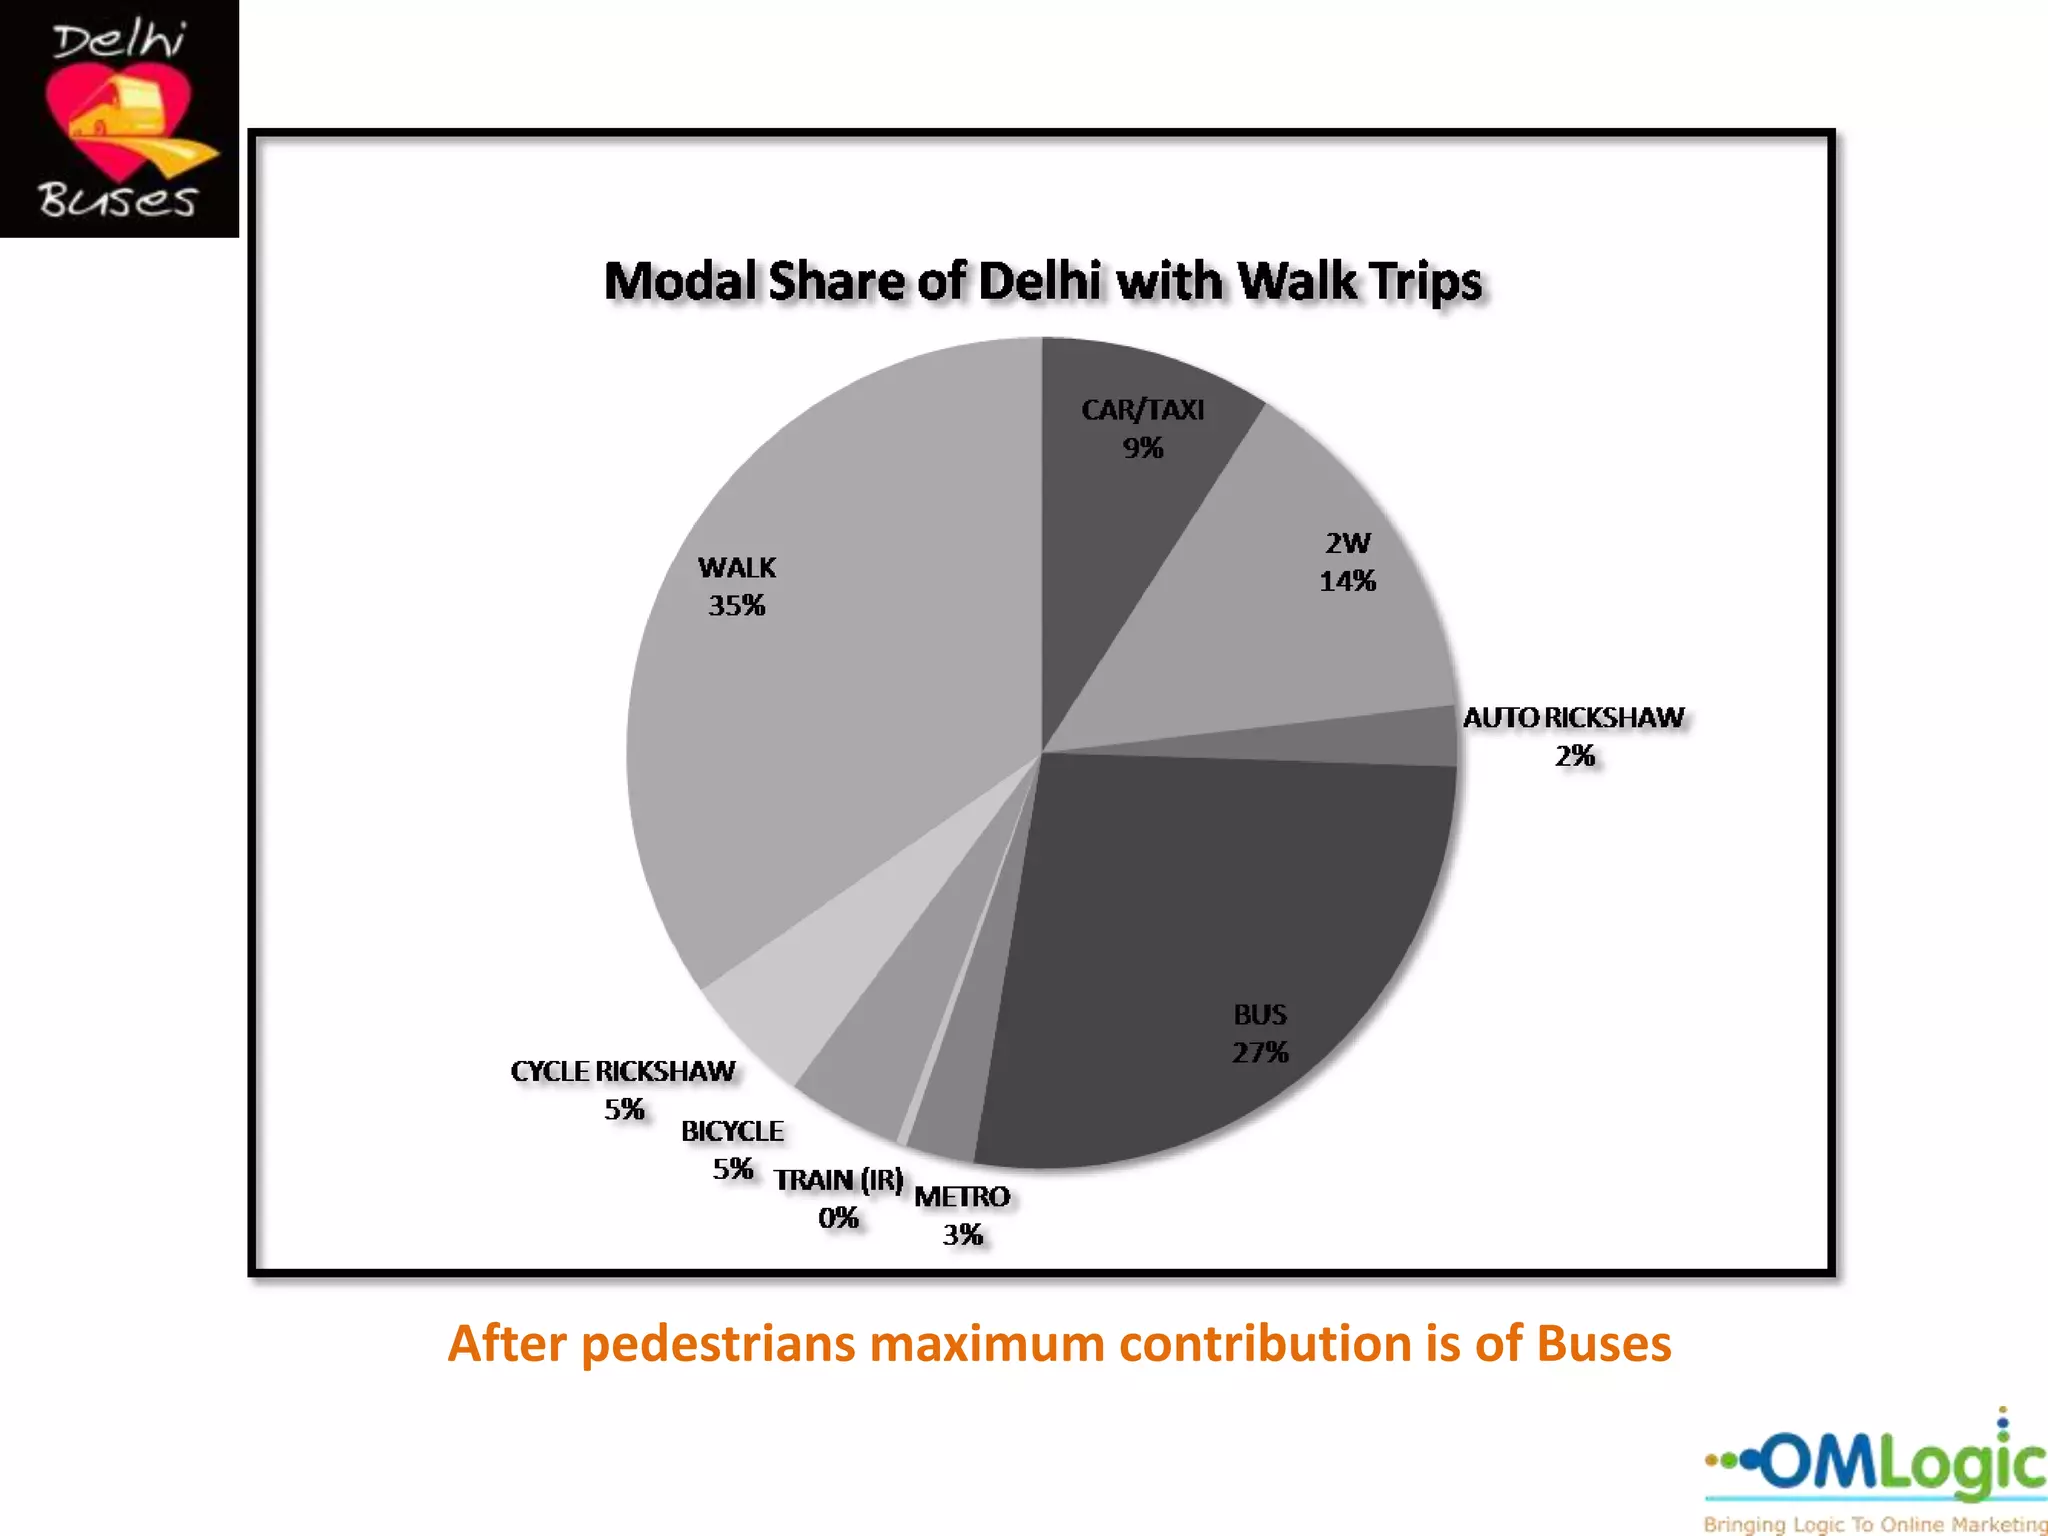
Some facts for the people of
           Delhi
Did you know?
• Bus lanes can’t be segregated, there being property entrances, petrol
  pump etc. Buses move faster without disturbing any other modes on BRT.

• Since in case of BRT, bus stands are in the middle, this reduces the
  number of lanes that need to be crossed and since stations are built on
  traffic signals that have zebra crossing increases safety.

• BRT can ferry 9000 passengers per hour per lane as opposed to only 2400
  otherwise. More people in BRT results in lesser cars, which leads to lesser
  congestion.

• Time to enter a metro makes metro ideal for longer stretches of 15 to 20
  Kms but for shorter distances bus is ideal.
Bar-Chart showing, no of lanes required in various future scenarios


60


50


                                                   1 - existing Breakup
40
                                                   2 - All road users graduate to cars (The Nano
                                                   Scenario)
                                                   3 - All road users (other than cars) graduate to 2
                                                   wheelers
                                                   4 - All road users other than cars move to buses
30
                                                   5 - All road users move to buses (including car
                                                   drivers)
                                                   6 - All road users move by cycles
20
                                                   7 - All road users move by foot


10


 0
                   Scenario
Graph showing the no. of lanes used existing breakup vis-a-vis what
     would be required in different future scenarios


60                                          18


                                            16
50                                               1 - existing Breakup
                                            14
                                                 2 - All road users graduate to cars (The Nano
                                                 Scenario)
                                                 3 - All road users (other than cars) graduate
40                                          12   to 2 wheelers
                                                 4 - All road users other than cars move to
                                                 buses
                                            10   5 - All road users move to buses (including
                                                 car drivers)
30
                                                 6 - All road users move by cycles
                                            8
                                                 7 - All road users move by foot

20                                          6    No. of Lanes available on Carriageway (30m)

                                                 No. of Lanes available iin ROW (50m)
                                            4
                                                 Layers of 6 lane Flyovers Required
10
                                            2


0                                           0
                 1 - existing Breakup
Buses have the maximum people carrying capacity


                                                  People Carrying Capacity of One Lane


                                10000
                                9000
People per hour per direction


                                8000
                                7000
                                6000
                                5000
                                4000
                                3000
                                2000
                                1000
                                    0
                                           Cars         Two Wheelers   Walking     Cyclists   Buses

                                                                       Mode
Break up of Trips in Delhi


                    9%

           17%                     35%              Pedestrians


                                                    Buses


                                                    Pvt. Motor Vehicles
                  39%

                                                    Bicycles


Buses & pedestrians have the highest share of trips in Delhi
Break up of Trips in Delhi


                            17%


                                            Pvt. Motor Vehicles   Others


                83%


Private motor vehicles have only 17% share in trips in Delhi!
Break up of Road Space Allocation in Delhi


                    15%


                                                     Pvt. Motor Vehicles   Others

                                   85%


Private motor vehicles have only 17% share in road space allocation!
After pedestrians maximum contribution is of Buses
Buses have 42% share in Vehicular Modal Share of Delhi

Facts about BRT and buses in Delhi

  • 1.
    Some facts forthe people of Delhi
  • 2.
    Did you know? •Bus lanes can’t be segregated, there being property entrances, petrol pump etc. Buses move faster without disturbing any other modes on BRT. • Since in case of BRT, bus stands are in the middle, this reduces the number of lanes that need to be crossed and since stations are built on traffic signals that have zebra crossing increases safety. • BRT can ferry 9000 passengers per hour per lane as opposed to only 2400 otherwise. More people in BRT results in lesser cars, which leads to lesser congestion. • Time to enter a metro makes metro ideal for longer stretches of 15 to 20 Kms but for shorter distances bus is ideal.
  • 3.
    Bar-Chart showing, noof lanes required in various future scenarios 60 50 1 - existing Breakup 40 2 - All road users graduate to cars (The Nano Scenario) 3 - All road users (other than cars) graduate to 2 wheelers 4 - All road users other than cars move to buses 30 5 - All road users move to buses (including car drivers) 6 - All road users move by cycles 20 7 - All road users move by foot 10 0 Scenario
  • 4.
    Graph showing theno. of lanes used existing breakup vis-a-vis what would be required in different future scenarios 60 18 16 50 1 - existing Breakup 14 2 - All road users graduate to cars (The Nano Scenario) 3 - All road users (other than cars) graduate 40 12 to 2 wheelers 4 - All road users other than cars move to buses 10 5 - All road users move to buses (including car drivers) 30 6 - All road users move by cycles 8 7 - All road users move by foot 20 6 No. of Lanes available on Carriageway (30m) No. of Lanes available iin ROW (50m) 4 Layers of 6 lane Flyovers Required 10 2 0 0 1 - existing Breakup
  • 5.
    Buses have themaximum people carrying capacity People Carrying Capacity of One Lane 10000 9000 People per hour per direction 8000 7000 6000 5000 4000 3000 2000 1000 0 Cars Two Wheelers Walking Cyclists Buses Mode
  • 6.
    Break up ofTrips in Delhi 9% 17% 35% Pedestrians Buses Pvt. Motor Vehicles 39% Bicycles Buses & pedestrians have the highest share of trips in Delhi
  • 7.
    Break up ofTrips in Delhi 17% Pvt. Motor Vehicles Others 83% Private motor vehicles have only 17% share in trips in Delhi!
  • 8.
    Break up ofRoad Space Allocation in Delhi 15% Pvt. Motor Vehicles Others 85% Private motor vehicles have only 17% share in road space allocation!
  • 9.
    After pedestrians maximumcontribution is of Buses
  • 10.
    Buses have 42%share in Vehicular Modal Share of Delhi

Editor's Notes

  • #7 Buses & pedestrians have the highest share of trips in Delhi