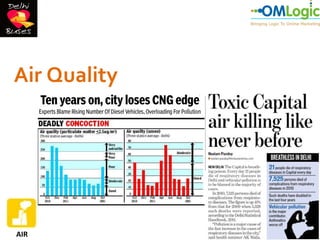
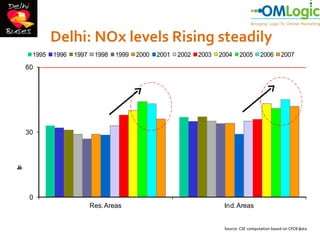
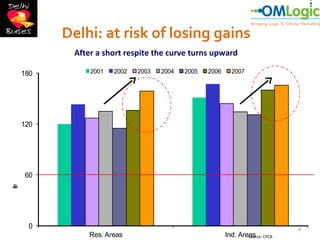
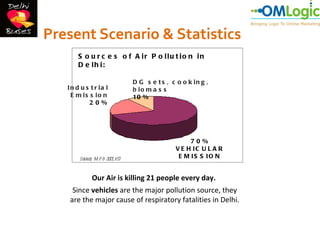
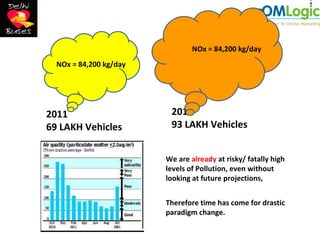
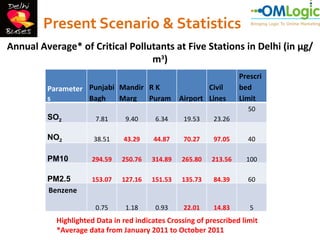
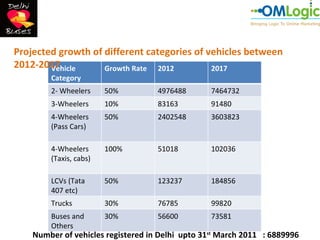
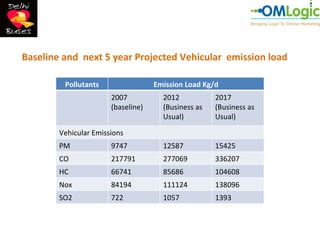
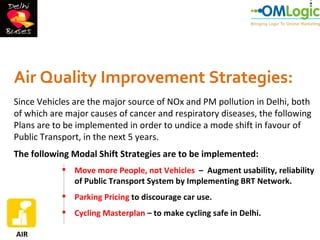
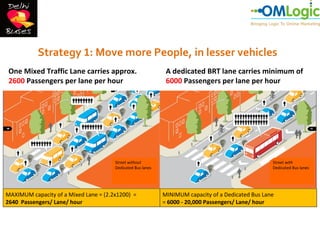
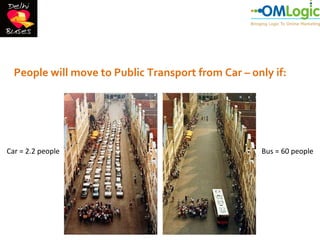
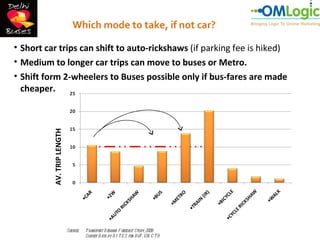
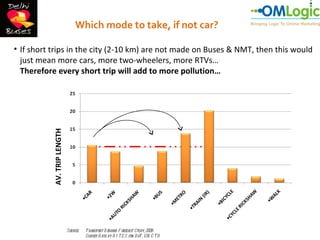
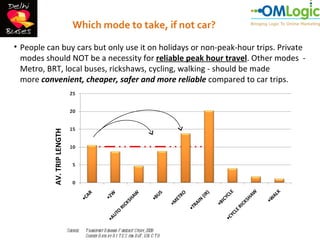
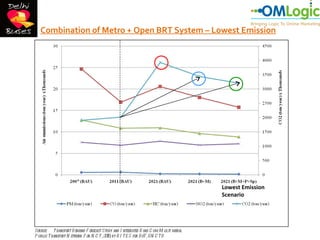
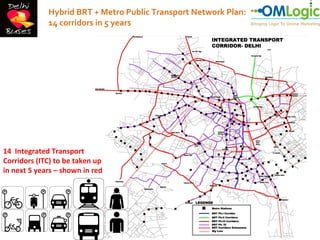
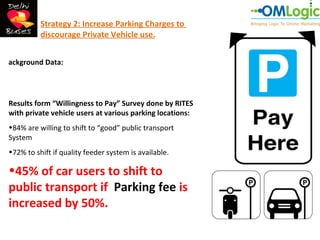
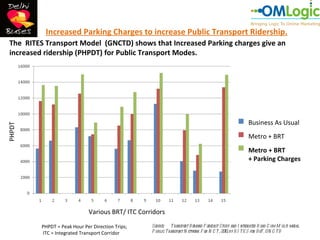
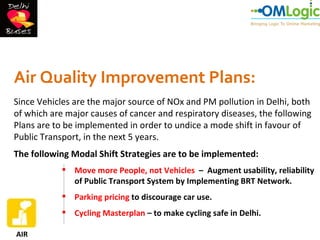
BRT- A must have for Delhi!
Air Quality


AIR
Delhi: NOx levels Rising steadily
     1995   1996   1997    1998   1999   2000   2001   2002   2003   2004    2005       2006      2007

    60


    30
m
e
b
u
a
g
o
c
r
t
/
i


     0
                          Res. Areas                                  Ind. Areas


                                                                      Source: CSE computation based on CPCB 3
                                                                                                            data
Delhi: at risk of losing gains
           After a short respite the curve turns upward

    180        2001   2002   2003   2004   2005   2006     2007


    120


    60
m
e
b
u
a
g
o
c
r
t
/
i


     0                                                                     4
               Res. Areas                                Ind. Areas CPCB
                                                                 Source:
Present Scenario & Statistics
       S o u r c e s o f A ir P o llu t io n in
       D e lh i:

                                  D G s e t s , c o o k in g ,
   In d u s t r ia l              b io m a s s
    E m is s io n                 10 %
           20%


                                                      70%
                                                 V E H IC U L A R
        Source: M P D 2021, p57
                                                  E M IS S IO N


              Our Air is killing 21 people every day.
     Since vehicles are the major pollution source, they
    are the major cause of respiratory fatalities in Delhi.
NOx = 84,200 kg/day
  NOx = 84,200 kg/day


2011                     2016
69 LAKH Vehicles         93 LAKH Vehicles


                        We are already at risky/ fatally high
                        levels of Pollution, even without
                        looking at future projections,


                        Therefore time has come for drastic
                        paradigm change.
Present Scenario & Statistics
Annual Average* of Critical Pollutants at Five Stations in Delhi (in µg/
                                 m3)
                                                                   Prescri
         Parameter Punjabi Mandir R K                    Civil     bed
         s         Bagh    Marg   Puram          Airport Lines     Limit
                                                                      50
         SO2           7.81     9.40     6.34     19.53    23.26

         NO2          38.51    43.29    44.87     70.27    97.05      40

         PM10        294.59    250.76   314.89   265.80   213.56     100

         PM2.5       153.07    127.16   151.53   135.73    84.39      60
         Benzene

                       0.75     1.18     0.93     22.01    14.83      5
           Highlighted Data in red indicates Crossing of prescribed limit
           *Average data from January 2011 to October 2011
Mass Emission Standards for Bharat Stage –IV
ategory M and Category N vehicles manufactured after the 1st April 2010 with gross vehicle
weight not exceeding 3500 kg, shall be as under:
Emission norms for different categories of vehicles
Norms      Passenger car          Two wheelers   Heavy Vehicles (Diesel) (gm/Km Hr)
             (Gasoline             (Gasoline)
             (gm/Km)                (gm/Km)


          CO      HC +        CO        HC +     CO      HC       NOx       PM
                  NOx                   NOx
BS I      2.72    0.97        2.0       2.0      4.5     1.1      8.0       0.36

BS II     2.2     0.5         1.5       1.5      4.0     1.1      7.0       0.15

BS III    2.3     0.35        1.0       1.0      2.1     0.66     5.0       0.10
                  (COMBINED
                  )

BS IV     1.0     0.18        -         -        1.5     0.96     3.5       0.02
                  (Combined
                  )
Projected growth of different categories of vehicles between
2012-2017
        Vehicle     Growth Rate 2012         2017
        Category
        2- Wheelers     50%         4976488       7464732
        3-Wheelers      10%         83163         91480
        4-Wheelers      50%         2402548       3603823
        (Pass Cars)

        4-Wheelers      100%        51018         102036
        (Taxis, cabs)

        LCVs (Tata      50%         123237        184856
        407 etc)
        Trucks          30%         76785         99820
        Buses and       30%         56600         73581
        Others
    Number of vehicles registered in Delhi upto 31st March 2011 : 6889996
Baseline and next 5 year Projected Vehicular emission load

         Pollutants                 Emission Load Kg/d
                       2007           2012           2017
                       (baseline)     (Business as   (Business as
                                      Usual)         Usual)

        Vehicular Emissions
        PM             9747           12587          15425
        CO             217791         277069         336207
        HC             66741          85686          104608
        Nox            84194          111124         138096
        SO2            722            1057           1393
Air Quality Improvement Strategies:
Since Vehicles are the major source of NOx and PM pollution in Delhi, both
of which are major causes of cancer and respiratory diseases, the following
Plans are to be implemented in order to undice a mode shift in favour of
Public Transport, in the next 5 years.
The following Modal Shift Strategies are to be implemented:
             Move more People, not Vehicles – Augment usability, reliability
              of Public Transport System by Implementing BRT Network.
             Parking Pricing to discourage car use.
             Cycling Masterplan – to make cycling safe in Delhi.

AIR
Strategy 1: Move more People, in lesser vehicles
 One Mixed Traffic Lane carries approx.                       A dedicated BRT lane carries minimum of
 2600 Passengers per lane per hour                            6000 Passengers per lane per hour


                                       Street without                                               Street with
                                       Dedicated Bus lanes                                          Dedicated Bus lanes


MAXIMUM capacity of a Mixed Lane = (2.2x1200) =              MINIMUM capacity of a Dedicated Bus Lane
2640 Passengers/ Lane/ hour                                  = 6000 - 20,000 Passengers/ Lane/ hour
• It is FASTER (possible only if there is Congestion for private vehicles)
  • It is CHEAPER (possible with fuel price rise, hike in parking fee, etc.)
  People will move to Public Transport from Car – only if:


Car = 2.2 people                                                Bus = 60 people
Which mode to take, if not car?

• Short car trips can shift to auto-rickshaws (if parking fee is hiked)
• Medium to longer car trips can move to buses or Metro.
• Shift form 2-wheelers to Buses possible only if bus-fares are made
  cheaper.
          AV. TRIP LENGTH


                            Source:   T ransport D emand F orecast Study, 2008
                                      Survey D ata by R I T E S for D oT , GN C T D
Which mode to take, if not car?

• If short trips in the city (2-10 km) are not made on Buses & NMT, then this would
  just mean more cars, more two-wheelers, more RTVs…
  Therefore every short trip will add to more pollution…
          AV. TRIP LENGTH


                            Source:   T ransport D emand F orecast Study, 2008
                                      Survey D ata by R I T E S for D oT , GN C T D
Which mode to take, if not car?

• People can buy cars but only use it on holidays or non-peak-hour trips. Private
  modes should NOT be a necessity for reliable peak hour travel. Other modes -
  Metro, BRT, local buses, rickshaws, cycling, walking - should be made
  more convenient, cheaper, safer and more reliable compared to car trips.
          AV. TRIP LENGTH


                            Source:   T ransport D emand F orecast Study, 2008
                                      Survey D ata by R I T E S for D oT , GN C T D
Why is Bus System Augmentation critical, inspite of Metro
   BRT corridors take the buses out of the traffic jam, thus making the entire bus system
    many times more reliable and faster.
    Need for mode interchange removed at least at one end of the trip in BRT, because the
    local bus itself takes people to their home/final destination.
                                               Local
                                          bus routes

                                                                   Bus Corridor
                                                                 fully segregated


   For Metro, a feeder mode is required at both ends, requiring time, money,
    inconvenience. This interchange delay is more acceptable when trip lengths are longer. For
    example, for a 6 km trip, an interchage after 3 km is undesirable and a direct mode is more
    preferable.

                  DESTINATION   Metro                  Feeders
                                Station


                                 Interchange                          ORIGIN
                                        point
Why is Bus System Augmentation critical, inspite of Metro
   Average Trip lengths in NCT is 10km. So bus is ideal and most convenient since it picks and
    drops door-to-door.
   Metro is best for 15-20km trip, as longer trip length neutralizes the interchange time &
    hassle for the commuter.


                  • 80% of Trips in Delhi are below 10 KMs.
Why is Bus System Augmentation critical, inspite of Metro
   For trip lengths between 5-10 KM, Bus is the ideal mode of Public Transport in Delhi.

                      MODE                         Average Trip Length (KM)
            •CAR                                                     10.5
            •2W                                                      8.7
            •AUTO RICKSHAW                                           4.7
            •BUS                                                     8.8
            •METRO                                                   13.8
            •TRAIN (IR)                                              20.2
            •BICYCLE                                                 4.0
            •CYCLE RICKSHAW                                          1.7
            •WALK                                                    1.1

   By adding short trips to Metro (2-10km commuters), it makes Metro too crowded
    for long distance travellers, thus making them shift back to other modes. This has
    already happened in corridors like Vikas Marg, Gurgaon, etc. because bus
    commuter (instead of car ) have moved to the Metro!!

           Source:   T ransport D emand F orecast Study, 2008
                     Survey D ata by R I T E S for D oT , GN C T D
FUTURE SCENARIOS –
              Business as Usual vs. Various Public Transport Scenarios.
• Continuing current trends shows a “decrease” in PT share.
• Implementing Metro & closed BRT only maintains the current Mode share.
• Implementing an Open/Hybrid BRT Netork along wit higher Parking Charges –
  induces a positive shift towards Public Transport!

                              Base 2007                  Business as                          Metro +       Open Network BRT/
                              (CURRENT)                  Usual (2021)                     few Closed BRT       Bus System +
                                                                                            (with Higher      Higher Parking
                  MODE                                                                   Parking Charges)        Charges
                                                                                                2021
                                                           Mode Share                       Mode Share          Mode Share
                             Mode Share (%)                   (%)                              (%)                 (%)

                     CAR             15.5                        23.4                          17.1                14.6

            2-Wheeler                27.1                        21.9                          20.0                8.7

      Auto-rickshaw                   4.4                         5.1                           3.2                4.1

    Public Transport                 53.0                        49.6                          59.7                72.6

         TOTAL TRIPS                100.0                       100.0                          100.0              100.0
    Source: T ransport D emand F orecast Study and I ntegrated R oad C um M ulti-modal
    P ublic T ransport N etwork F or N C T , 2010; by R I T E S for D oT , GN C T D
Combination of Metro + Open BRT System – Lowest Emission


                                                                                     Lowest Emission
                                                                                     Scenario


Source: T ransport D emand F orecast Study and I ntegrated R oad C um M ulti-modal
P ublic T ransport N etwork F or N C T , 2010; by R I T E S for D oT , GN C T D
Hybrid BRT + Metro Public Transport Network Plan:
                 14 corridors in 5 years


14 Integrated Transport
Corridors (ITC) to be taken up
in next 5 years – shown in red


SYMBOLS: IIT- MUMBAI
Strategy 2: Increase Parking Charges to
          discourage Private Vehicle use.


ackground Data:


Results form “Willingness to Pay” Survey done by RITES
with private vehicle users at various parking locations:
•84% are willing to shift to “good” public transport
System
•72% to shift if quality feeder system is available.

•45% of car users to shift to
public transport if Parking fee is
increased by 50%.
Increased Parking Charges to increase Public Transport Ridership.
 The RITES Transport Model (GNCTD) shows that Increased Parking charges give an
 increased ridership (PHPDT) for Public Transport Modes.


                                                                                                        Business As Usual
PHPDT


                                                                                                        Metro + BRT
                                                                                                        Metro + BRT
                                                                                                        + Parking Charges


                              Various BRT/ ITC Corridors

          PHPDT = Peak Hour Per Direction Trips;   Source: T ransport D emand F orecast Study and I ntegrated R oad C um M ulti-modal
          ITC = Integrated Transport Corridor      P ublic T ransport N etwork F or N C T , 2010; by R I T E S for D oT , GN C T D
Strategy 3: Cycling Masterplan – Make Cycling Safe in Delhi!
It is interesting to Note from the Data below that:
 Of the 19% car owning households of the city, 9% use their vehicles regularly for
travel;
 However out of the 35% Bicycle Owners, only 5% use them for travel!!
           Vehicle Ownership In Delhi                             Modal Share
       VEHICLE OWNED     % OF HOUSEHOLDS                   MODE           % of PERSON TRIPS

     •CAR                                                                WITH WALK TRIPS
         - 1 no.               16.4                                      (2007-08)

         - 2 nos.              2.5              •CAR/TAXI                        9.09
         - 3 nos.              0.4              •2W                             14.07
         ≥ 4 nos.              0.1              •AUTO RICKSHAW                   2.36
            TOTAL              19.4             •BUS                            27.12
     •2W
                                                •METRO                           2.66
         - 1 nos.              37.7
                                                •TRAIN (IR)                      0.42
         - 2 nos.              5.1
                                                •BICYCLE                         4.46
         - 3 nos.              0.5
                                                •CYCLE RICKSHAW                  5.16
         ≥ 4 nos.              0.1
                                                •WALK                           34.67
            TOTAL              43.4
     •NO MOTOR VEHICLE         47.9             TOTAL                            100

     •BICYCLE                  35.0             TOTAL TRIPS/DAY              219.87 LAKH
Promotion of NMT/ Cycling helps in drastic reduction in Emissions
                            __
       E


                                  (Better Vehicles)   (High Cycling
                                                       & NMT use.
Data Source: www.unep.org
A complete City-wide Safe Cycling Network to be developed.


     Arterial Roads to have safe Cycle Tracks
A complete City-wide Safe Cycling Network to be developed.


     Nallahs can be Cycle-Ecomobility corridors, forming a City-wide Network.
The South Delhi Greenways
                  project (CDP, Delhi):
                  .


                  • Continuous non-motorized corridor
                    along Nallahs for connectivity to
                    Metro/ BRT.
                  • Connects to heritage destinations.
                  • Provides scope to locally recycle
                    sewage and infiltrate groundwater.
                  • Stormwater conveyance System with
                    parks as temporary detention
                    facilities.
                  • Forests allow for detention and
                    infiltration facilities and green lungs.
                                                     30
© oasis designs
The South Delhi Greenways
                  project (CDP, Delhi):
                  .


                      • Provides scope to locally recycle
                        sewage and infiltrate groundwater.
                      • Stormwater conveyance System with
                        parks as temporary detention
                        facilities.
                      • Forests allow for detention and
                        infiltration facilities and green lungs.
                      • Continuous non-motorized corridor
                        along Nallahs for connectivity to
                        Metro/ BRT.
                      • Connects to heritage destinations.

AFTER
BEFORE                                                     31
© morphogenesis
Nallah Corridors become a shorter Cycling Connection to Stations


                                               NIZAMUDDIN
                                                 STATION


                                                            ISBT SARAI
                                                            KALE KHAN


                             JANGPURA
                           METRO STATION
             2.0 KMS

                       3.5 KMS


                  BRT CORRIDOR


                                                                     32
Air Quality Improvement Plans:
Since Vehicles are the major source of NOx and PM pollution in Delhi, both
of which are major causes of cancer and respiratory diseases, the following
Plans are to be implemented in order to undice a mode shift in favour of
Public Transport, in the next 5 years.
The following Modal Shift Strategies are to be implemented:
             Move more People, not Vehicles – Augment usability, reliability
              of Public Transport System by Implementing BRT Network.
             Parking pricing to discourage car use.
             Cycling Masterplan – to make cycling safe in Delhi.

AIR

BRT- A Must Have for Delhi

  • 1.
    BRT- A musthave for Delhi!
  • 2.
  • 3.
    Delhi: NOx levelsRising steadily 1995 1996 1997 1998 1999 2000 2001 2002 2003 2004 2005 2006 2007 60 30 m e b u a g o c r t / i 0 Res. Areas Ind. Areas Source: CSE computation based on CPCB 3 data
  • 4.
    Delhi: at riskof losing gains After a short respite the curve turns upward 180 2001 2002 2003 2004 2005 2006 2007 120 60 m e b u a g o c r t / i 0 4 Res. Areas Ind. Areas CPCB Source:
  • 5.
    Present Scenario &Statistics S o u r c e s o f A ir P o llu t io n in D e lh i: D G s e t s , c o o k in g , In d u s t r ia l b io m a s s E m is s io n 10 % 20% 70% V E H IC U L A R Source: M P D 2021, p57 E M IS S IO N Our Air is killing 21 people every day. Since vehicles are the major pollution source, they are the major cause of respiratory fatalities in Delhi.
  • 6.
    NOx = 84,200kg/day NOx = 84,200 kg/day 2011 2016 69 LAKH Vehicles 93 LAKH Vehicles We are already at risky/ fatally high levels of Pollution, even without looking at future projections, Therefore time has come for drastic paradigm change.
  • 7.
    Present Scenario &Statistics Annual Average* of Critical Pollutants at Five Stations in Delhi (in µg/ m3) Prescri Parameter Punjabi Mandir R K Civil bed s Bagh Marg Puram Airport Lines Limit 50 SO2 7.81 9.40 6.34 19.53 23.26 NO2 38.51 43.29 44.87 70.27 97.05 40 PM10 294.59 250.76 314.89 265.80 213.56 100 PM2.5 153.07 127.16 151.53 135.73 84.39 60 Benzene 0.75 1.18 0.93 22.01 14.83 5 Highlighted Data in red indicates Crossing of prescribed limit *Average data from January 2011 to October 2011
  • 8.
    Mass Emission Standardsfor Bharat Stage –IV ategory M and Category N vehicles manufactured after the 1st April 2010 with gross vehicle weight not exceeding 3500 kg, shall be as under:
  • 9.
    Emission norms fordifferent categories of vehicles Norms Passenger car Two wheelers Heavy Vehicles (Diesel) (gm/Km Hr) (Gasoline (Gasoline) (gm/Km) (gm/Km) CO HC + CO HC + CO HC NOx PM NOx NOx BS I 2.72 0.97 2.0 2.0 4.5 1.1 8.0 0.36 BS II 2.2 0.5 1.5 1.5 4.0 1.1 7.0 0.15 BS III 2.3 0.35 1.0 1.0 2.1 0.66 5.0 0.10 (COMBINED ) BS IV 1.0 0.18 - - 1.5 0.96 3.5 0.02 (Combined )
  • 10.
    Projected growth ofdifferent categories of vehicles between 2012-2017 Vehicle Growth Rate 2012 2017 Category 2- Wheelers 50% 4976488 7464732 3-Wheelers 10% 83163 91480 4-Wheelers 50% 2402548 3603823 (Pass Cars) 4-Wheelers 100% 51018 102036 (Taxis, cabs) LCVs (Tata 50% 123237 184856 407 etc) Trucks 30% 76785 99820 Buses and 30% 56600 73581 Others Number of vehicles registered in Delhi upto 31st March 2011 : 6889996
  • 11.
    Baseline and next5 year Projected Vehicular emission load Pollutants Emission Load Kg/d 2007 2012 2017 (baseline) (Business as (Business as Usual) Usual) Vehicular Emissions PM 9747 12587 15425 CO 217791 277069 336207 HC 66741 85686 104608 Nox 84194 111124 138096 SO2 722 1057 1393
  • 12.
    Air Quality ImprovementStrategies: Since Vehicles are the major source of NOx and PM pollution in Delhi, both of which are major causes of cancer and respiratory diseases, the following Plans are to be implemented in order to undice a mode shift in favour of Public Transport, in the next 5 years. The following Modal Shift Strategies are to be implemented:  Move more People, not Vehicles – Augment usability, reliability of Public Transport System by Implementing BRT Network.  Parking Pricing to discourage car use.  Cycling Masterplan – to make cycling safe in Delhi. AIR
  • 13.
    Strategy 1: Movemore People, in lesser vehicles One Mixed Traffic Lane carries approx. A dedicated BRT lane carries minimum of 2600 Passengers per lane per hour 6000 Passengers per lane per hour Street without Street with Dedicated Bus lanes Dedicated Bus lanes MAXIMUM capacity of a Mixed Lane = (2.2x1200) = MINIMUM capacity of a Dedicated Bus Lane 2640 Passengers/ Lane/ hour = 6000 - 20,000 Passengers/ Lane/ hour
  • 14.
    • It isFASTER (possible only if there is Congestion for private vehicles) • It is CHEAPER (possible with fuel price rise, hike in parking fee, etc.) People will move to Public Transport from Car – only if: Car = 2.2 people Bus = 60 people
  • 15.
    Which mode totake, if not car? • Short car trips can shift to auto-rickshaws (if parking fee is hiked) • Medium to longer car trips can move to buses or Metro. • Shift form 2-wheelers to Buses possible only if bus-fares are made cheaper. AV. TRIP LENGTH Source: T ransport D emand F orecast Study, 2008 Survey D ata by R I T E S for D oT , GN C T D
  • 16.
    Which mode totake, if not car? • If short trips in the city (2-10 km) are not made on Buses & NMT, then this would just mean more cars, more two-wheelers, more RTVs… Therefore every short trip will add to more pollution… AV. TRIP LENGTH Source: T ransport D emand F orecast Study, 2008 Survey D ata by R I T E S for D oT , GN C T D
  • 17.
    Which mode totake, if not car? • People can buy cars but only use it on holidays or non-peak-hour trips. Private modes should NOT be a necessity for reliable peak hour travel. Other modes - Metro, BRT, local buses, rickshaws, cycling, walking - should be made more convenient, cheaper, safer and more reliable compared to car trips. AV. TRIP LENGTH Source: T ransport D emand F orecast Study, 2008 Survey D ata by R I T E S for D oT , GN C T D
  • 18.
    Why is BusSystem Augmentation critical, inspite of Metro  BRT corridors take the buses out of the traffic jam, thus making the entire bus system many times more reliable and faster. Need for mode interchange removed at least at one end of the trip in BRT, because the local bus itself takes people to their home/final destination. Local bus routes Bus Corridor fully segregated  For Metro, a feeder mode is required at both ends, requiring time, money, inconvenience. This interchange delay is more acceptable when trip lengths are longer. For example, for a 6 km trip, an interchage after 3 km is undesirable and a direct mode is more preferable. DESTINATION Metro Feeders Station Interchange ORIGIN point
  • 19.
    Why is BusSystem Augmentation critical, inspite of Metro  Average Trip lengths in NCT is 10km. So bus is ideal and most convenient since it picks and drops door-to-door.  Metro is best for 15-20km trip, as longer trip length neutralizes the interchange time & hassle for the commuter. • 80% of Trips in Delhi are below 10 KMs.
  • 20.
    Why is BusSystem Augmentation critical, inspite of Metro  For trip lengths between 5-10 KM, Bus is the ideal mode of Public Transport in Delhi. MODE Average Trip Length (KM) •CAR 10.5 •2W 8.7 •AUTO RICKSHAW 4.7 •BUS 8.8 •METRO 13.8 •TRAIN (IR) 20.2 •BICYCLE 4.0 •CYCLE RICKSHAW 1.7 •WALK 1.1  By adding short trips to Metro (2-10km commuters), it makes Metro too crowded for long distance travellers, thus making them shift back to other modes. This has already happened in corridors like Vikas Marg, Gurgaon, etc. because bus commuter (instead of car ) have moved to the Metro!! Source: T ransport D emand F orecast Study, 2008 Survey D ata by R I T E S for D oT , GN C T D
  • 21.
    FUTURE SCENARIOS – Business as Usual vs. Various Public Transport Scenarios. • Continuing current trends shows a “decrease” in PT share. • Implementing Metro & closed BRT only maintains the current Mode share. • Implementing an Open/Hybrid BRT Netork along wit higher Parking Charges – induces a positive shift towards Public Transport! Base 2007 Business as Metro + Open Network BRT/ (CURRENT) Usual (2021) few Closed BRT Bus System + (with Higher Higher Parking MODE Parking Charges) Charges 2021 Mode Share Mode Share Mode Share Mode Share (%) (%) (%) (%) CAR 15.5 23.4 17.1 14.6 2-Wheeler 27.1 21.9 20.0 8.7 Auto-rickshaw 4.4 5.1 3.2 4.1 Public Transport 53.0 49.6 59.7 72.6 TOTAL TRIPS 100.0 100.0 100.0 100.0 Source: T ransport D emand F orecast Study and I ntegrated R oad C um M ulti-modal P ublic T ransport N etwork F or N C T , 2010; by R I T E S for D oT , GN C T D
  • 22.
    Combination of Metro+ Open BRT System – Lowest Emission Lowest Emission Scenario Source: T ransport D emand F orecast Study and I ntegrated R oad C um M ulti-modal P ublic T ransport N etwork F or N C T , 2010; by R I T E S for D oT , GN C T D
  • 23.
    Hybrid BRT +Metro Public Transport Network Plan: 14 corridors in 5 years 14 Integrated Transport Corridors (ITC) to be taken up in next 5 years – shown in red SYMBOLS: IIT- MUMBAI
  • 24.
    Strategy 2: IncreaseParking Charges to discourage Private Vehicle use. ackground Data: Results form “Willingness to Pay” Survey done by RITES with private vehicle users at various parking locations: •84% are willing to shift to “good” public transport System •72% to shift if quality feeder system is available. •45% of car users to shift to public transport if Parking fee is increased by 50%.
  • 25.
    Increased Parking Chargesto increase Public Transport Ridership. The RITES Transport Model (GNCTD) shows that Increased Parking charges give an increased ridership (PHPDT) for Public Transport Modes. Business As Usual PHPDT Metro + BRT Metro + BRT + Parking Charges Various BRT/ ITC Corridors PHPDT = Peak Hour Per Direction Trips; Source: T ransport D emand F orecast Study and I ntegrated R oad C um M ulti-modal ITC = Integrated Transport Corridor P ublic T ransport N etwork F or N C T , 2010; by R I T E S for D oT , GN C T D
  • 26.
    Strategy 3: CyclingMasterplan – Make Cycling Safe in Delhi! It is interesting to Note from the Data below that:  Of the 19% car owning households of the city, 9% use their vehicles regularly for travel;  However out of the 35% Bicycle Owners, only 5% use them for travel!! Vehicle Ownership In Delhi Modal Share VEHICLE OWNED % OF HOUSEHOLDS MODE % of PERSON TRIPS •CAR WITH WALK TRIPS - 1 no. 16.4 (2007-08) - 2 nos. 2.5 •CAR/TAXI 9.09 - 3 nos. 0.4 •2W 14.07 ≥ 4 nos. 0.1 •AUTO RICKSHAW 2.36 TOTAL 19.4 •BUS 27.12 •2W •METRO 2.66 - 1 nos. 37.7 •TRAIN (IR) 0.42 - 2 nos. 5.1 •BICYCLE 4.46 - 3 nos. 0.5 •CYCLE RICKSHAW 5.16 ≥ 4 nos. 0.1 •WALK 34.67 TOTAL 43.4 •NO MOTOR VEHICLE 47.9 TOTAL 100 •BICYCLE 35.0 TOTAL TRIPS/DAY 219.87 LAKH
  • 27.
    Promotion of NMT/Cycling helps in drastic reduction in Emissions __ E (Better Vehicles) (High Cycling & NMT use. Data Source: www.unep.org
  • 28.
    A complete City-wideSafe Cycling Network to be developed. Arterial Roads to have safe Cycle Tracks
  • 29.
    A complete City-wideSafe Cycling Network to be developed. Nallahs can be Cycle-Ecomobility corridors, forming a City-wide Network.
  • 30.
    The South DelhiGreenways project (CDP, Delhi): . • Continuous non-motorized corridor along Nallahs for connectivity to Metro/ BRT. • Connects to heritage destinations. • Provides scope to locally recycle sewage and infiltrate groundwater. • Stormwater conveyance System with parks as temporary detention facilities. • Forests allow for detention and infiltration facilities and green lungs. 30 © oasis designs
  • 31.
    The South DelhiGreenways project (CDP, Delhi): . • Provides scope to locally recycle sewage and infiltrate groundwater. • Stormwater conveyance System with parks as temporary detention facilities. • Forests allow for detention and infiltration facilities and green lungs. • Continuous non-motorized corridor along Nallahs for connectivity to Metro/ BRT. • Connects to heritage destinations. AFTER BEFORE 31 © morphogenesis
  • 32.
    Nallah Corridors becomea shorter Cycling Connection to Stations NIZAMUDDIN STATION ISBT SARAI KALE KHAN JANGPURA METRO STATION 2.0 KMS 3.5 KMS BRT CORRIDOR 32
  • 33.
    Air Quality ImprovementPlans: Since Vehicles are the major source of NOx and PM pollution in Delhi, both of which are major causes of cancer and respiratory diseases, the following Plans are to be implemented in order to undice a mode shift in favour of Public Transport, in the next 5 years. The following Modal Shift Strategies are to be implemented:  Move more People, not Vehicles – Augment usability, reliability of Public Transport System by Implementing BRT Network.  Parking pricing to discourage car use.  Cycling Masterplan – to make cycling safe in Delhi. AIR