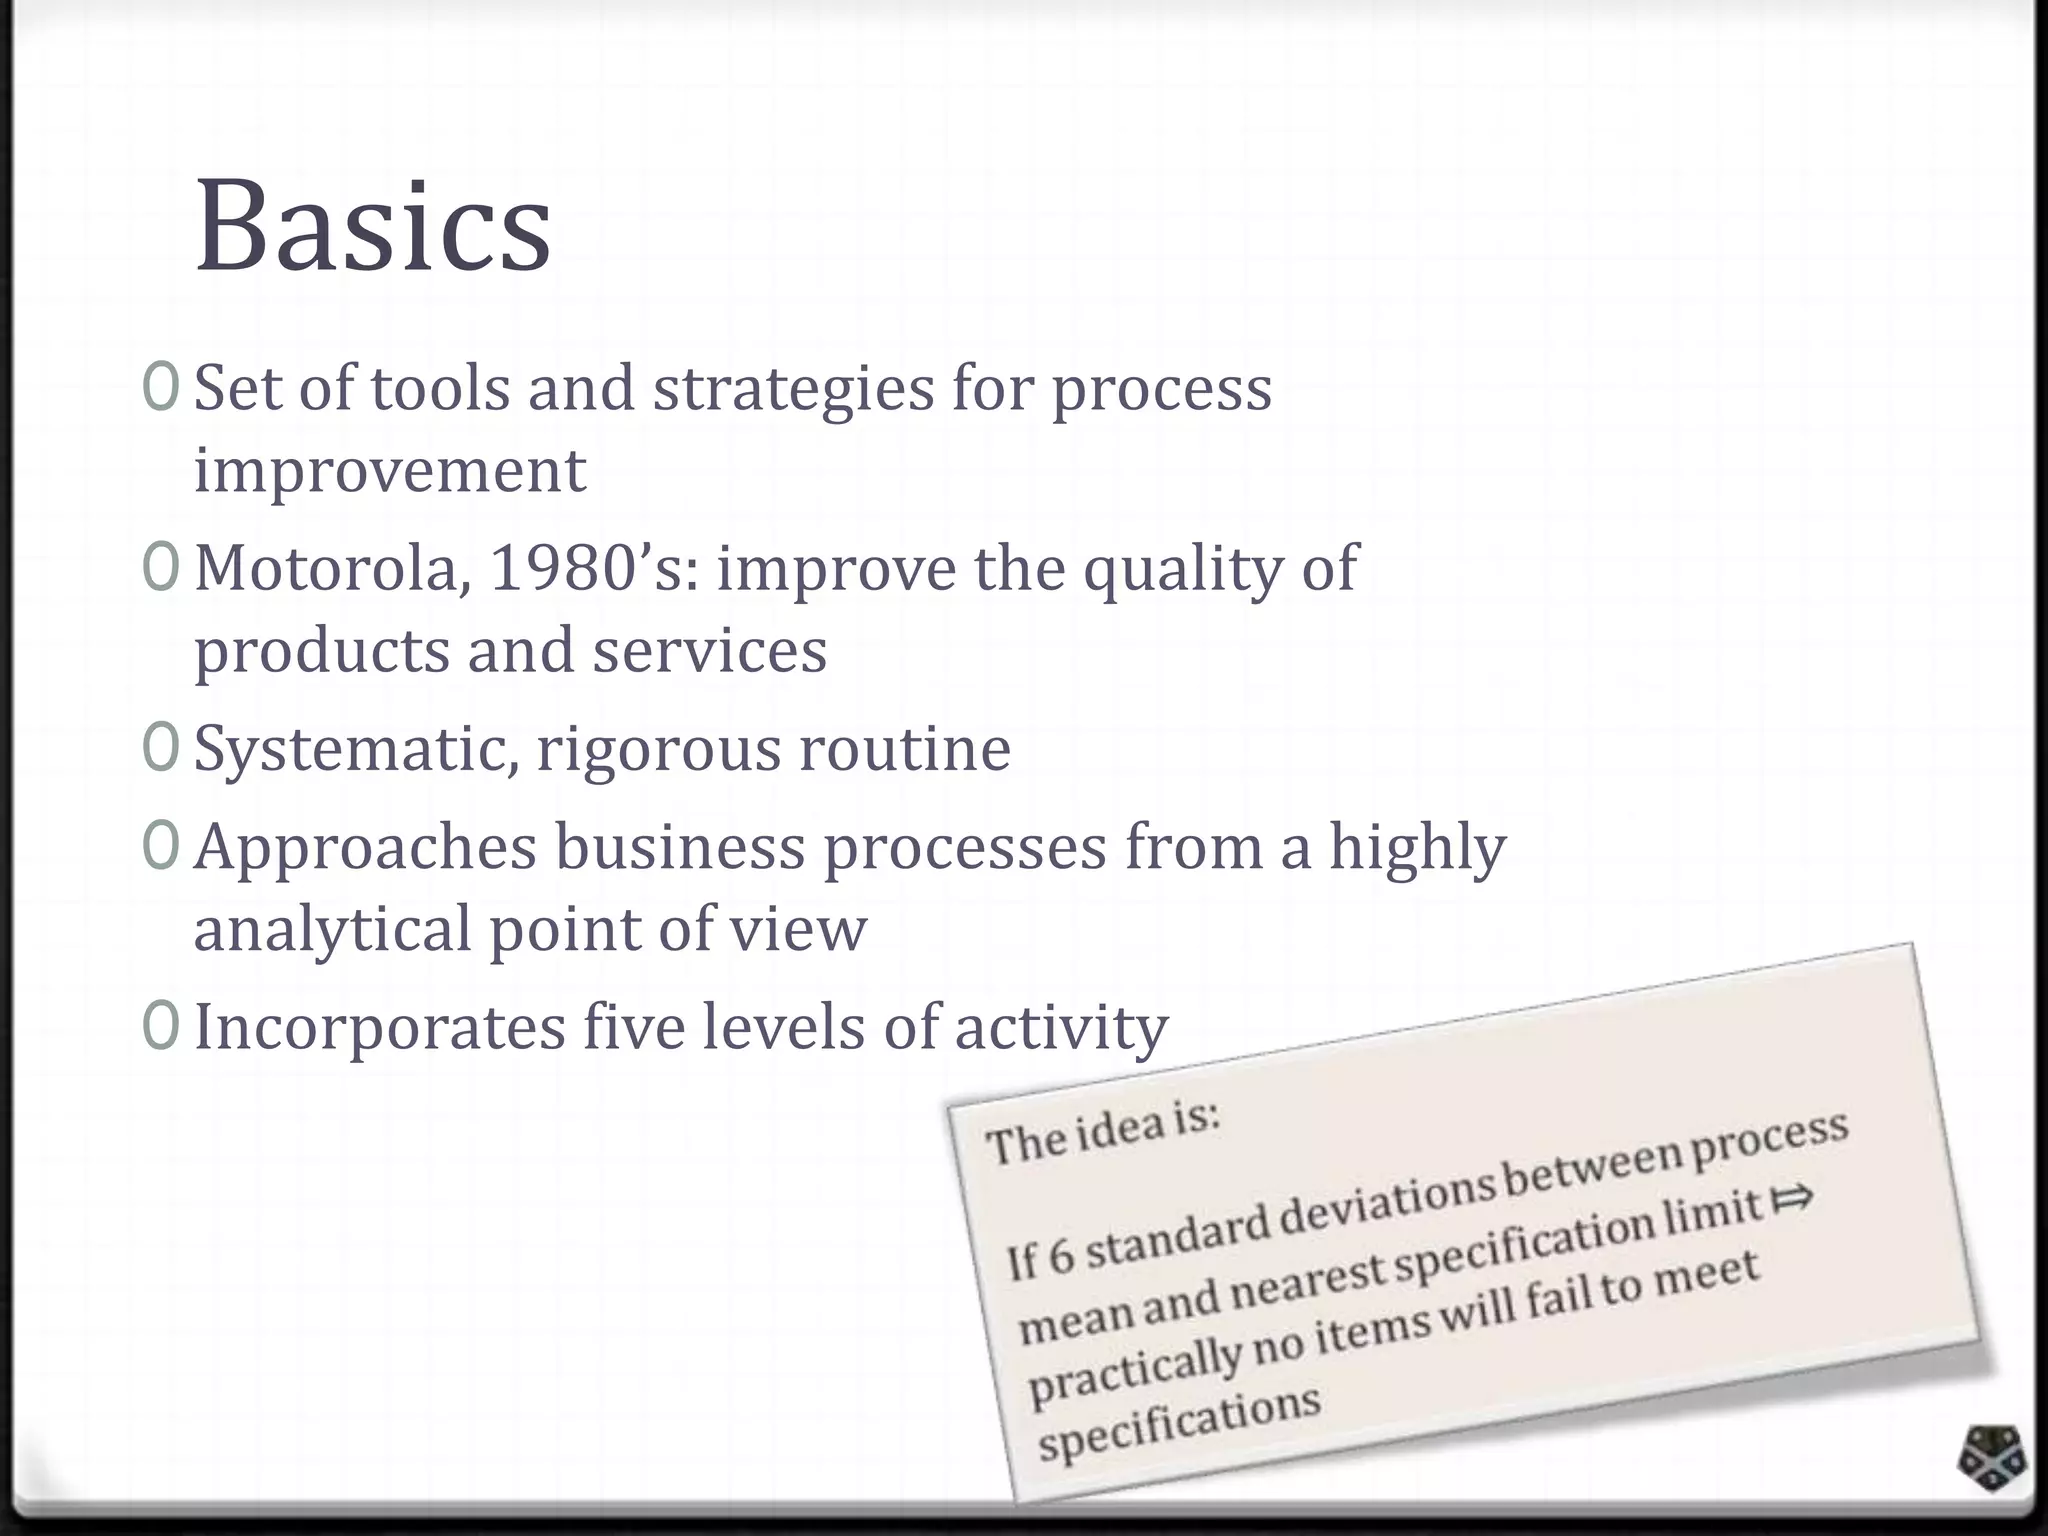
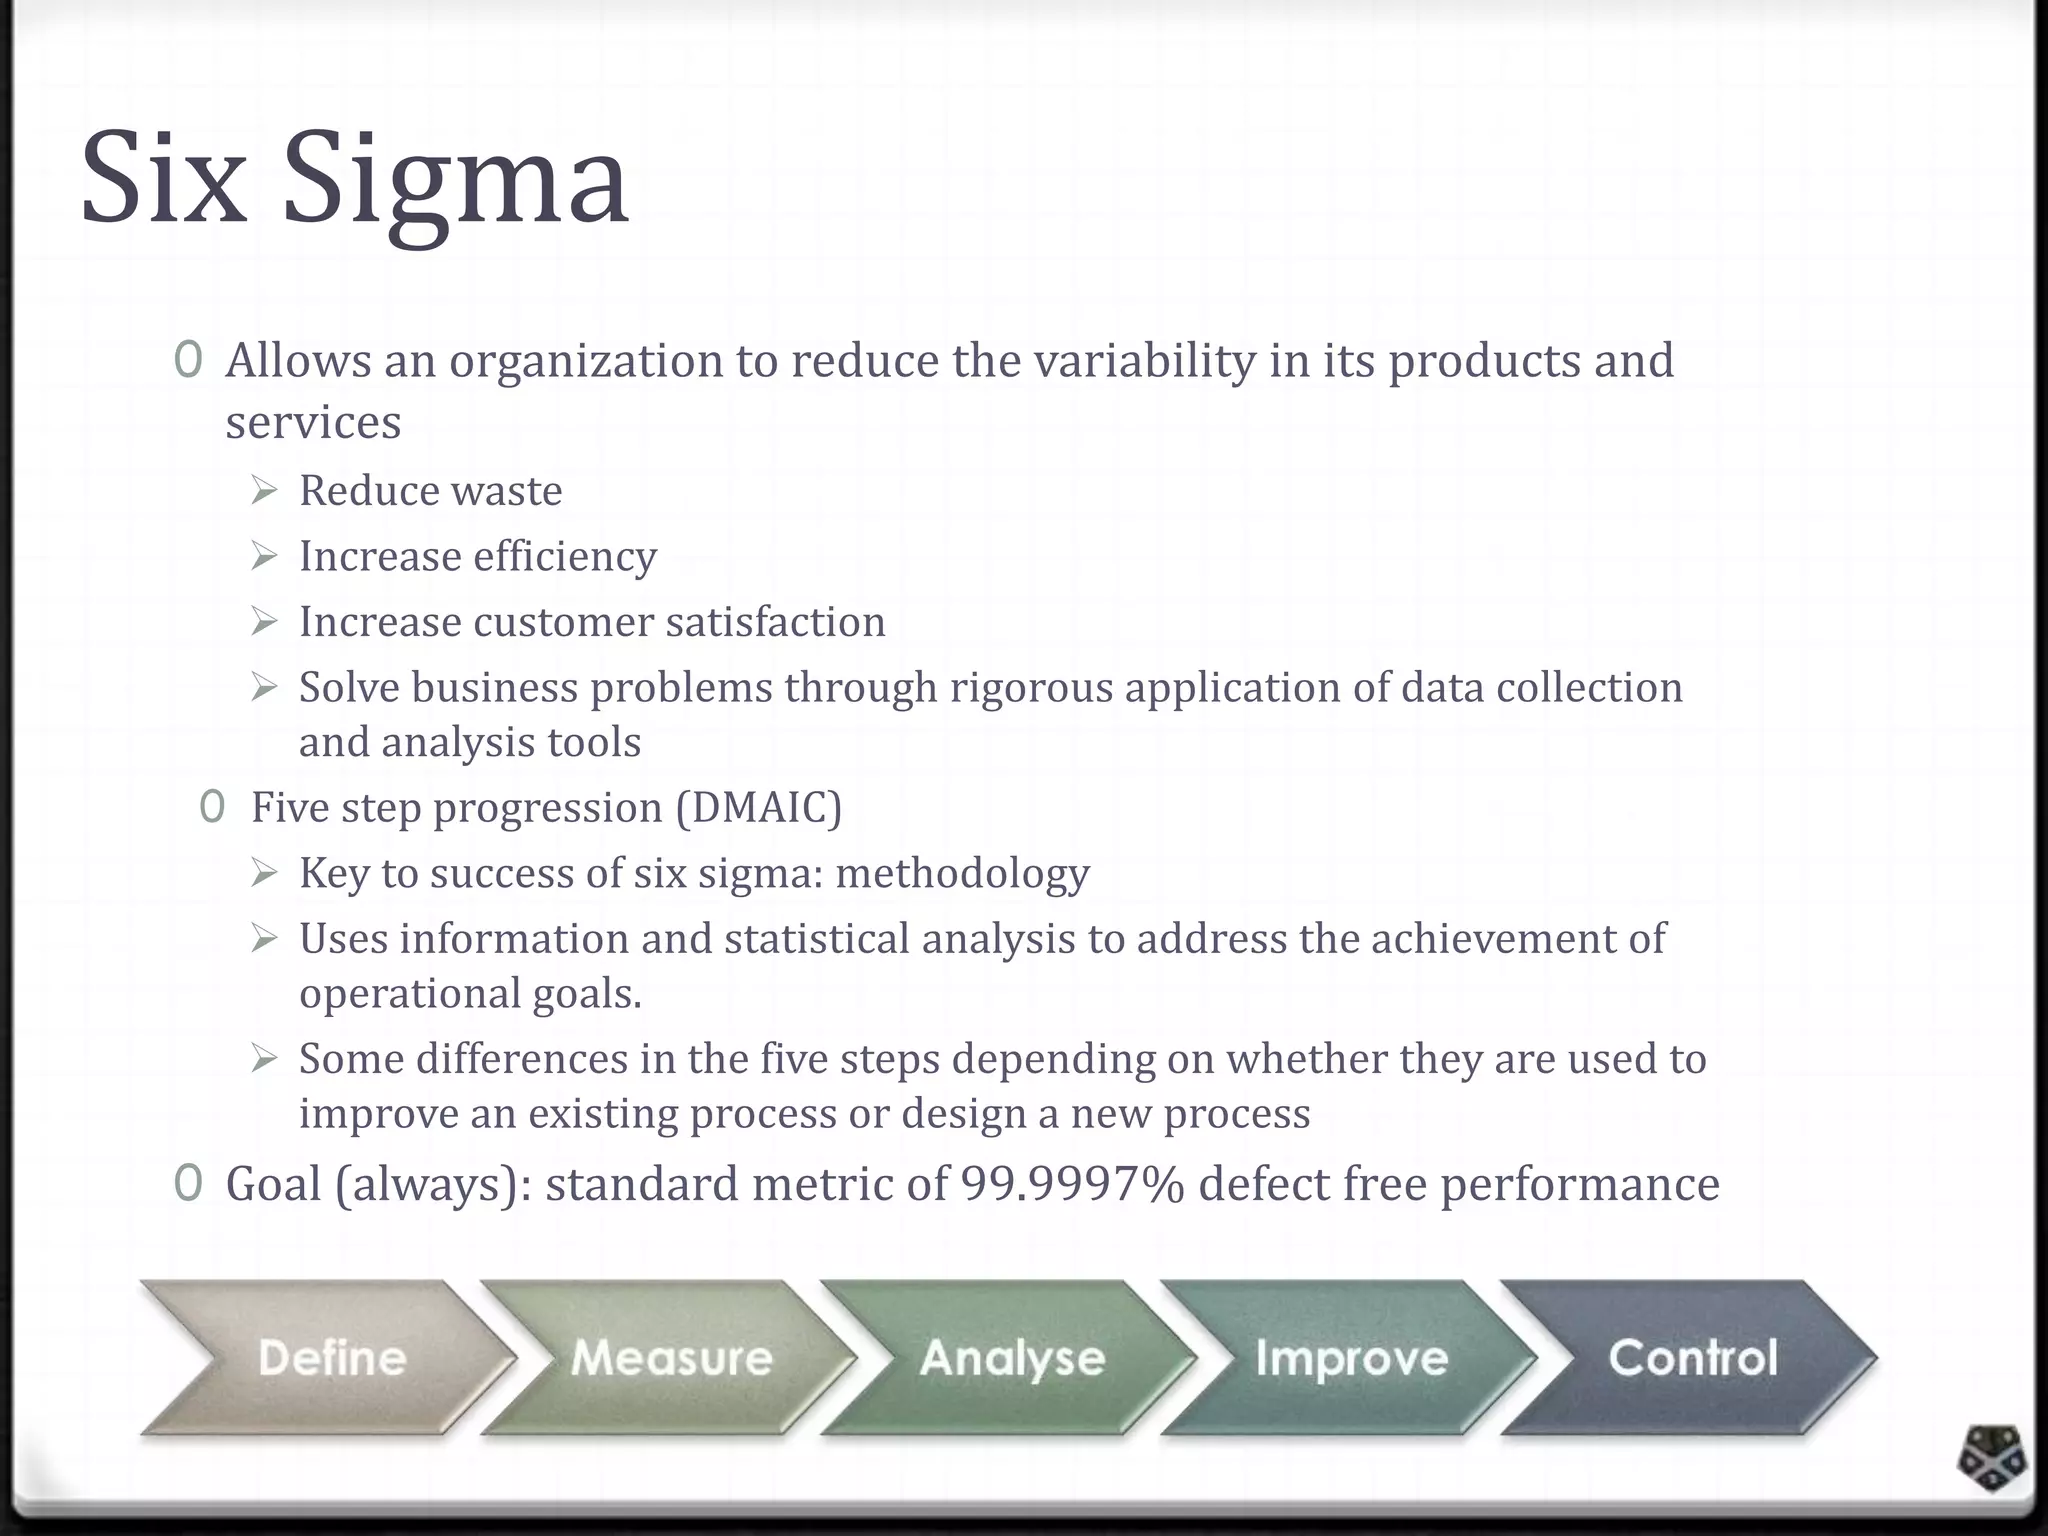
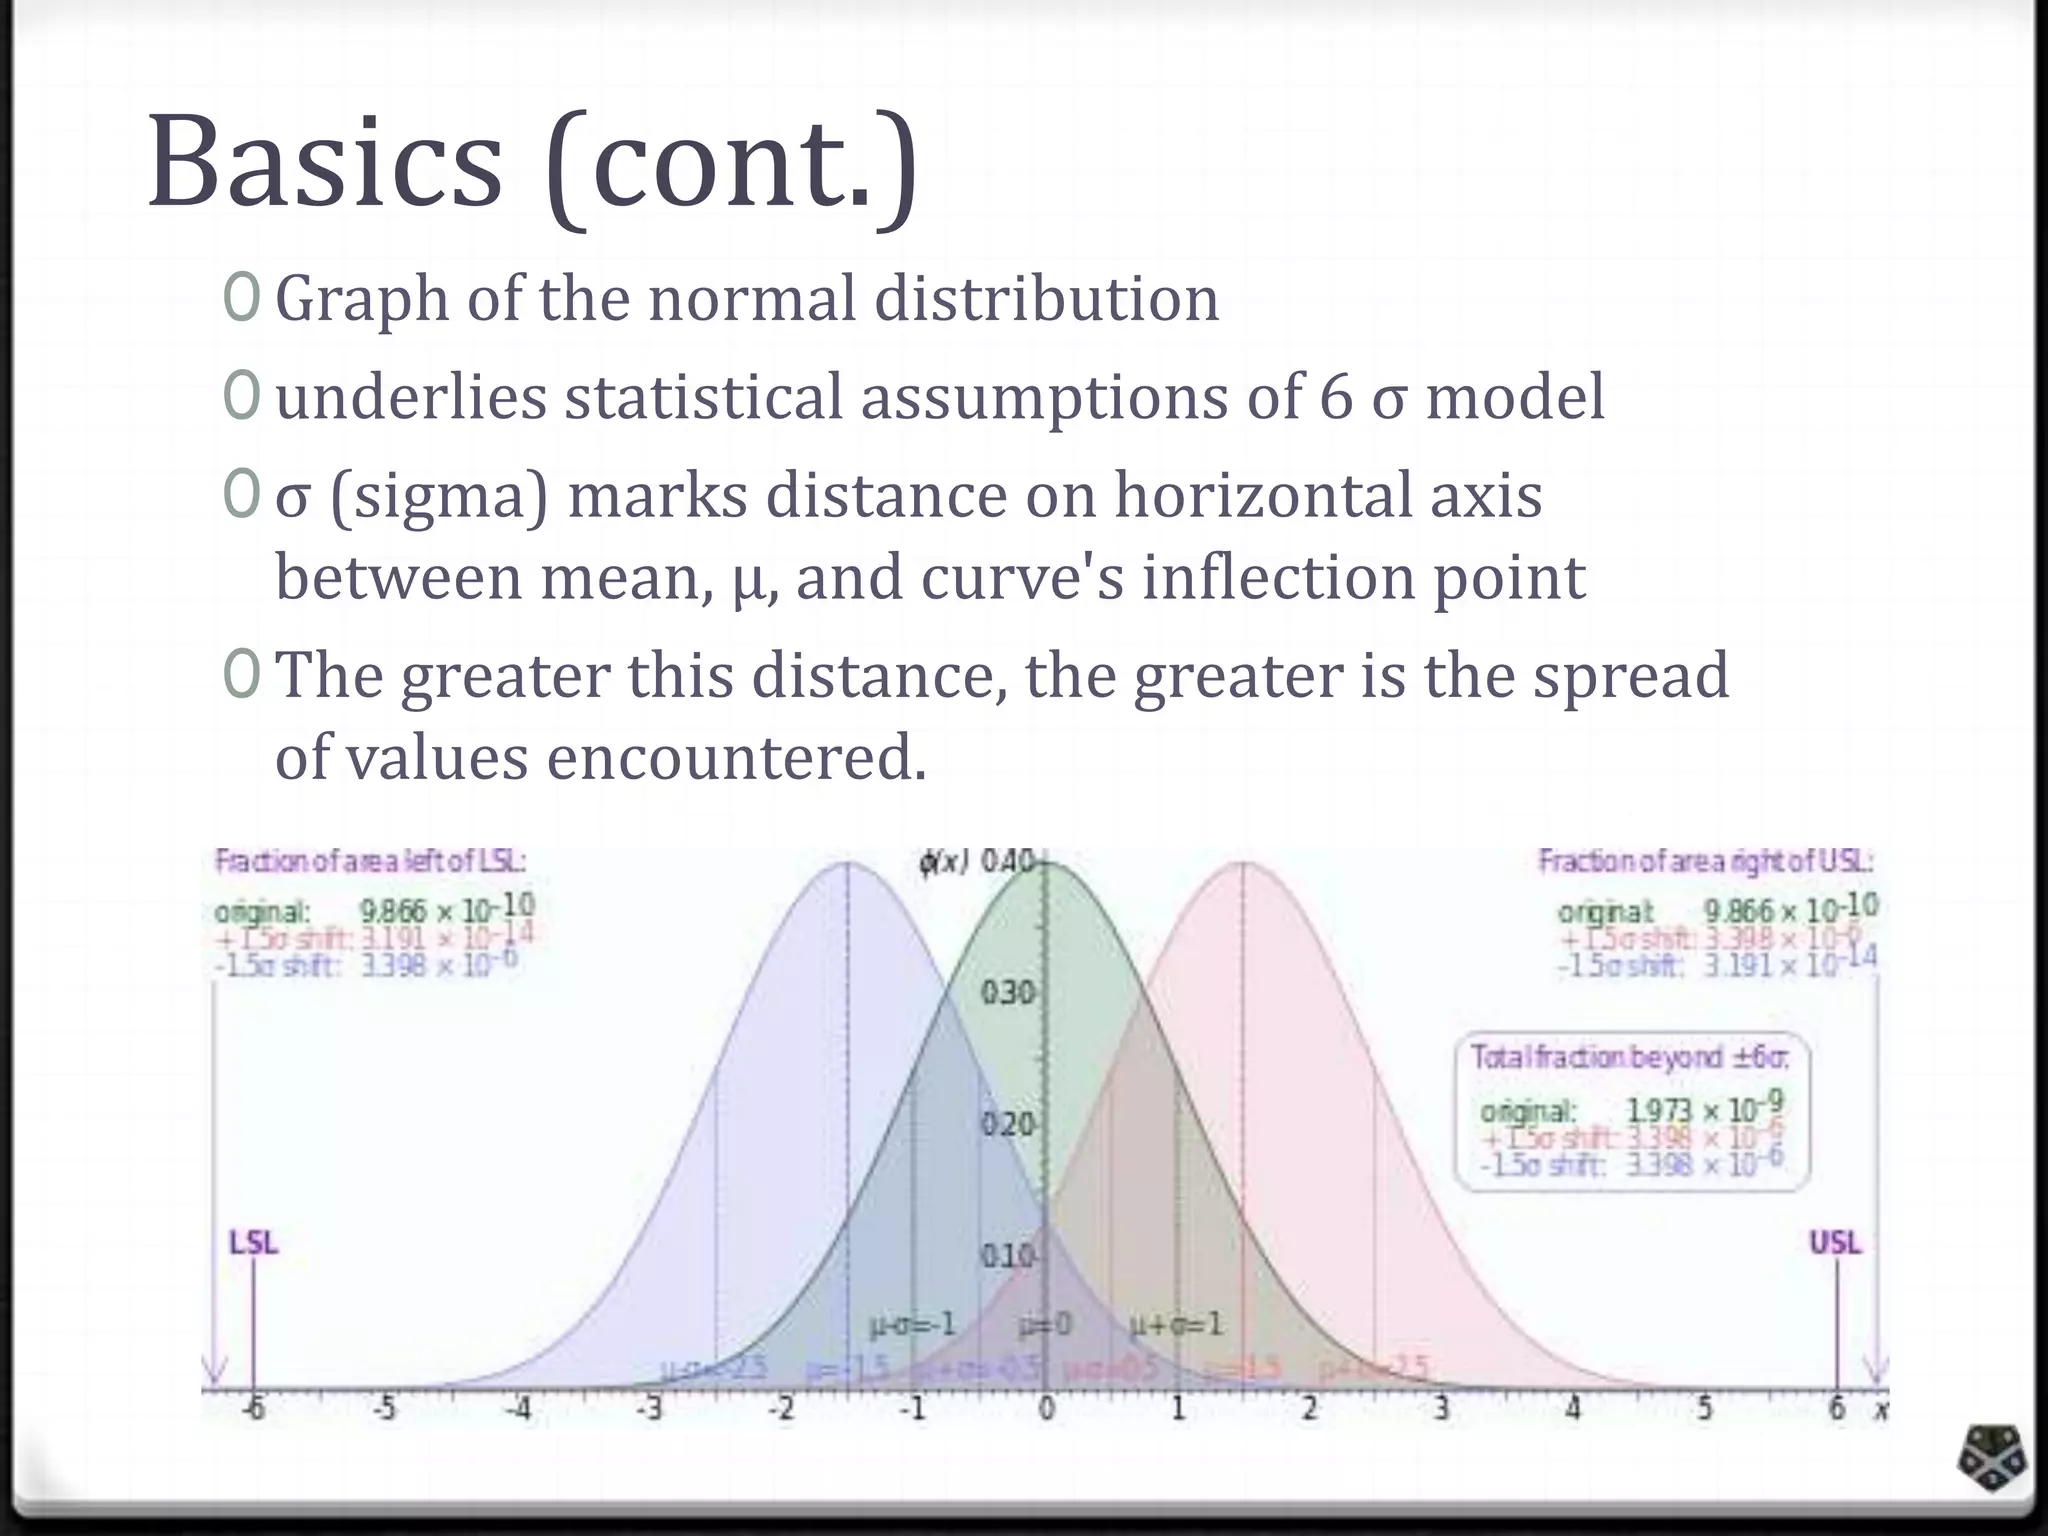
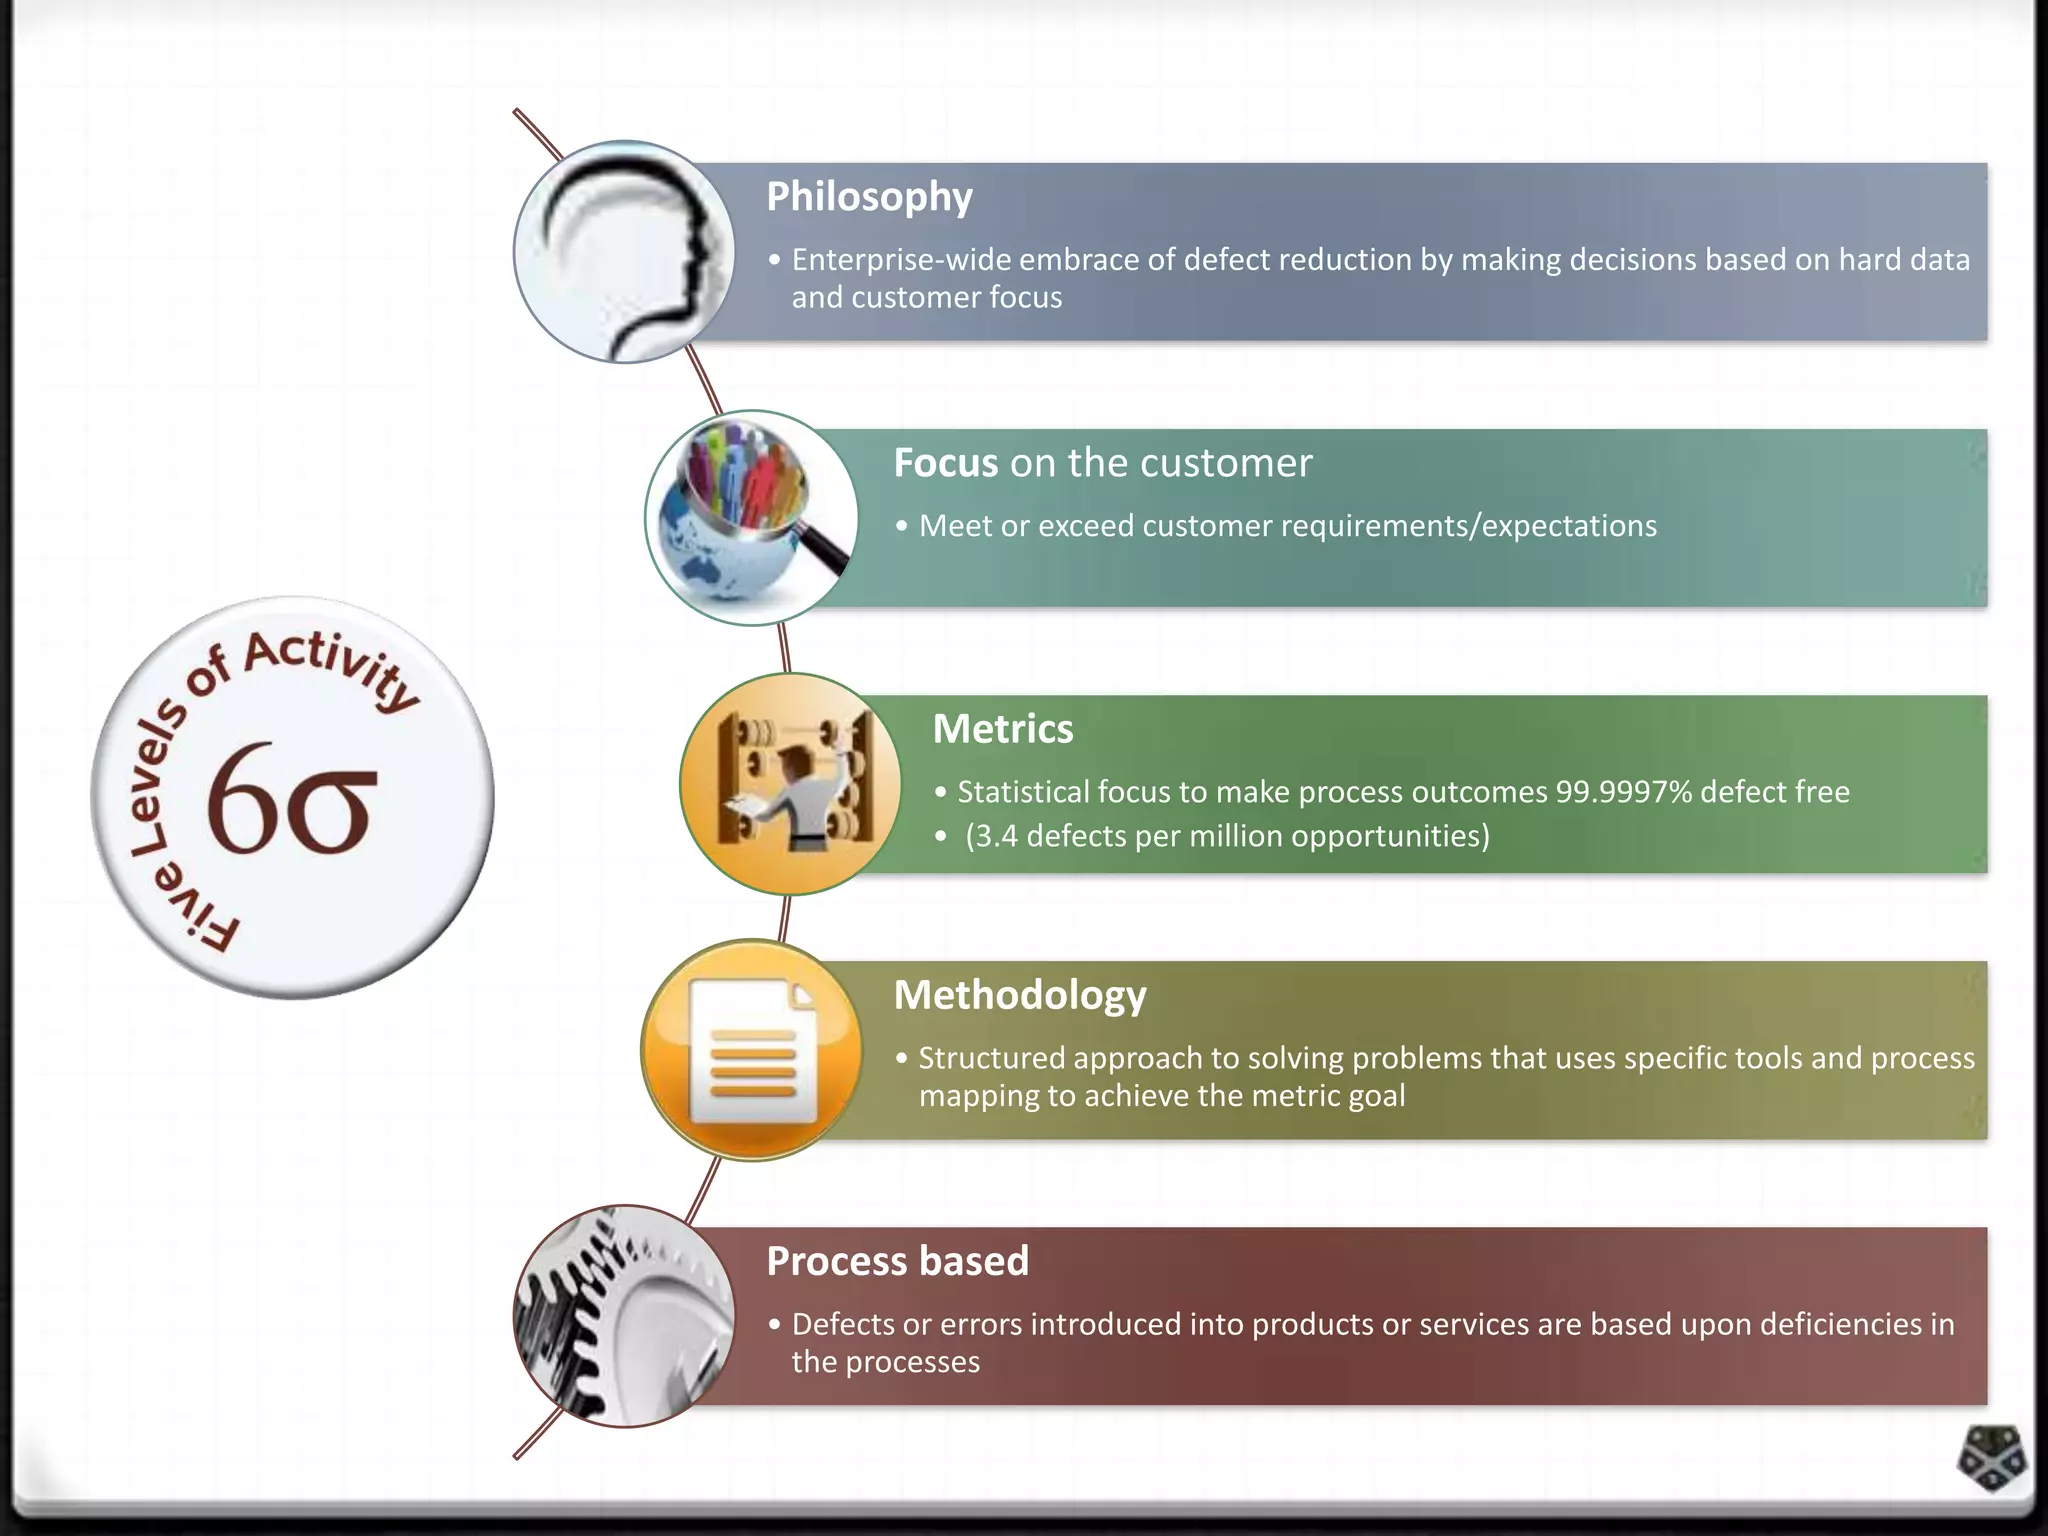
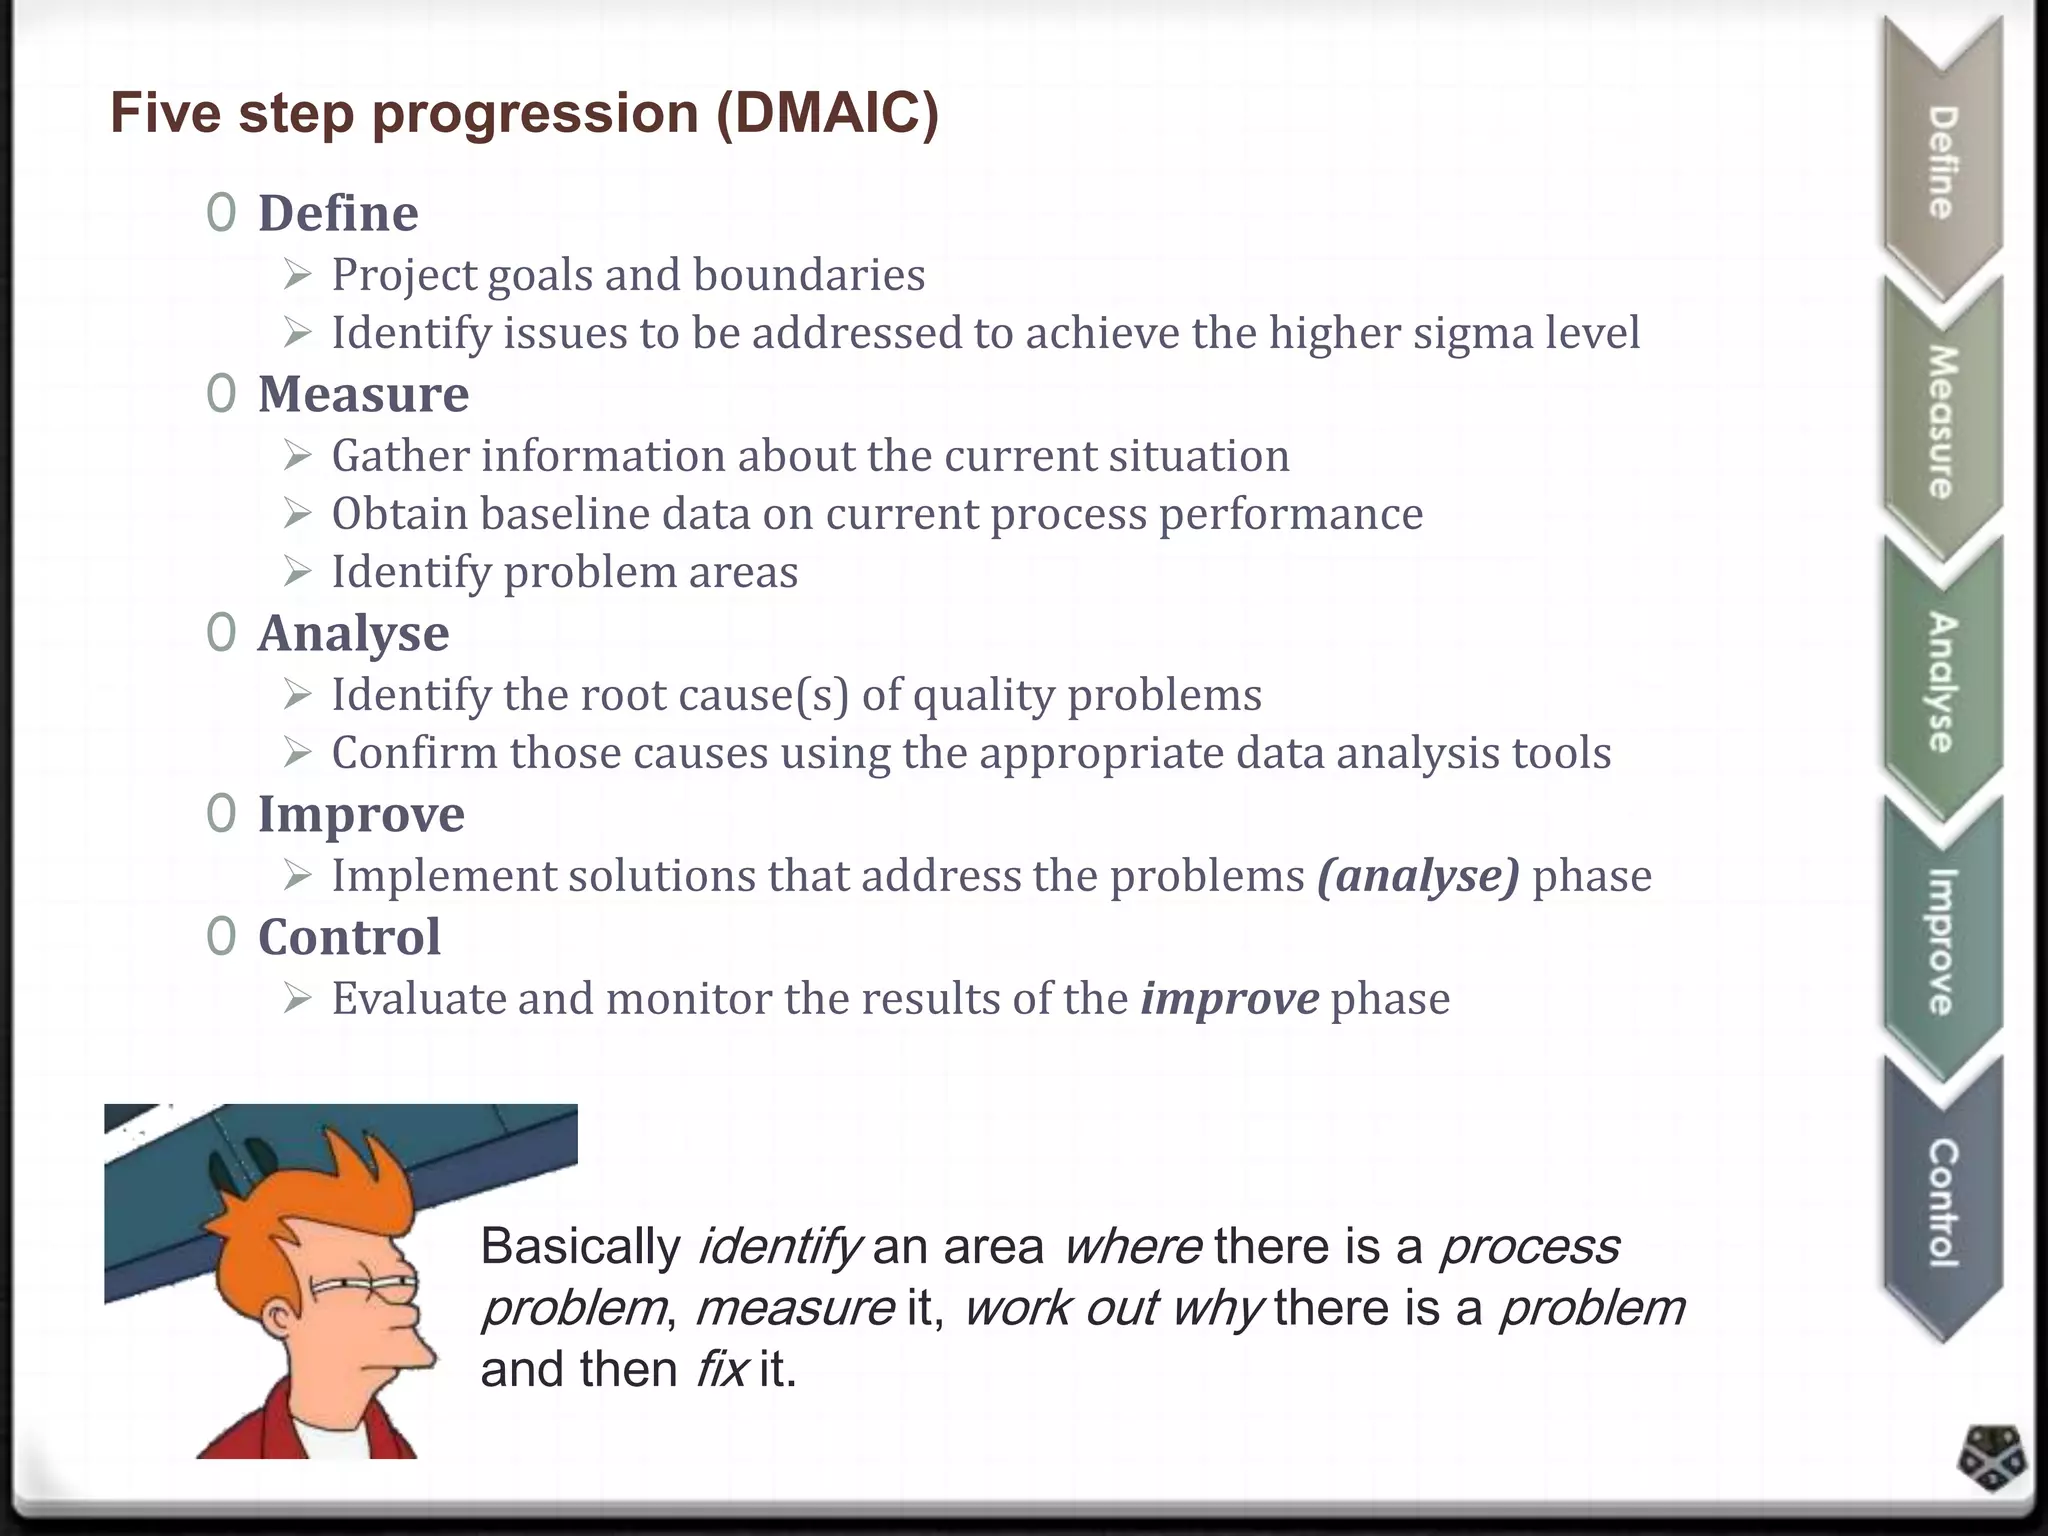
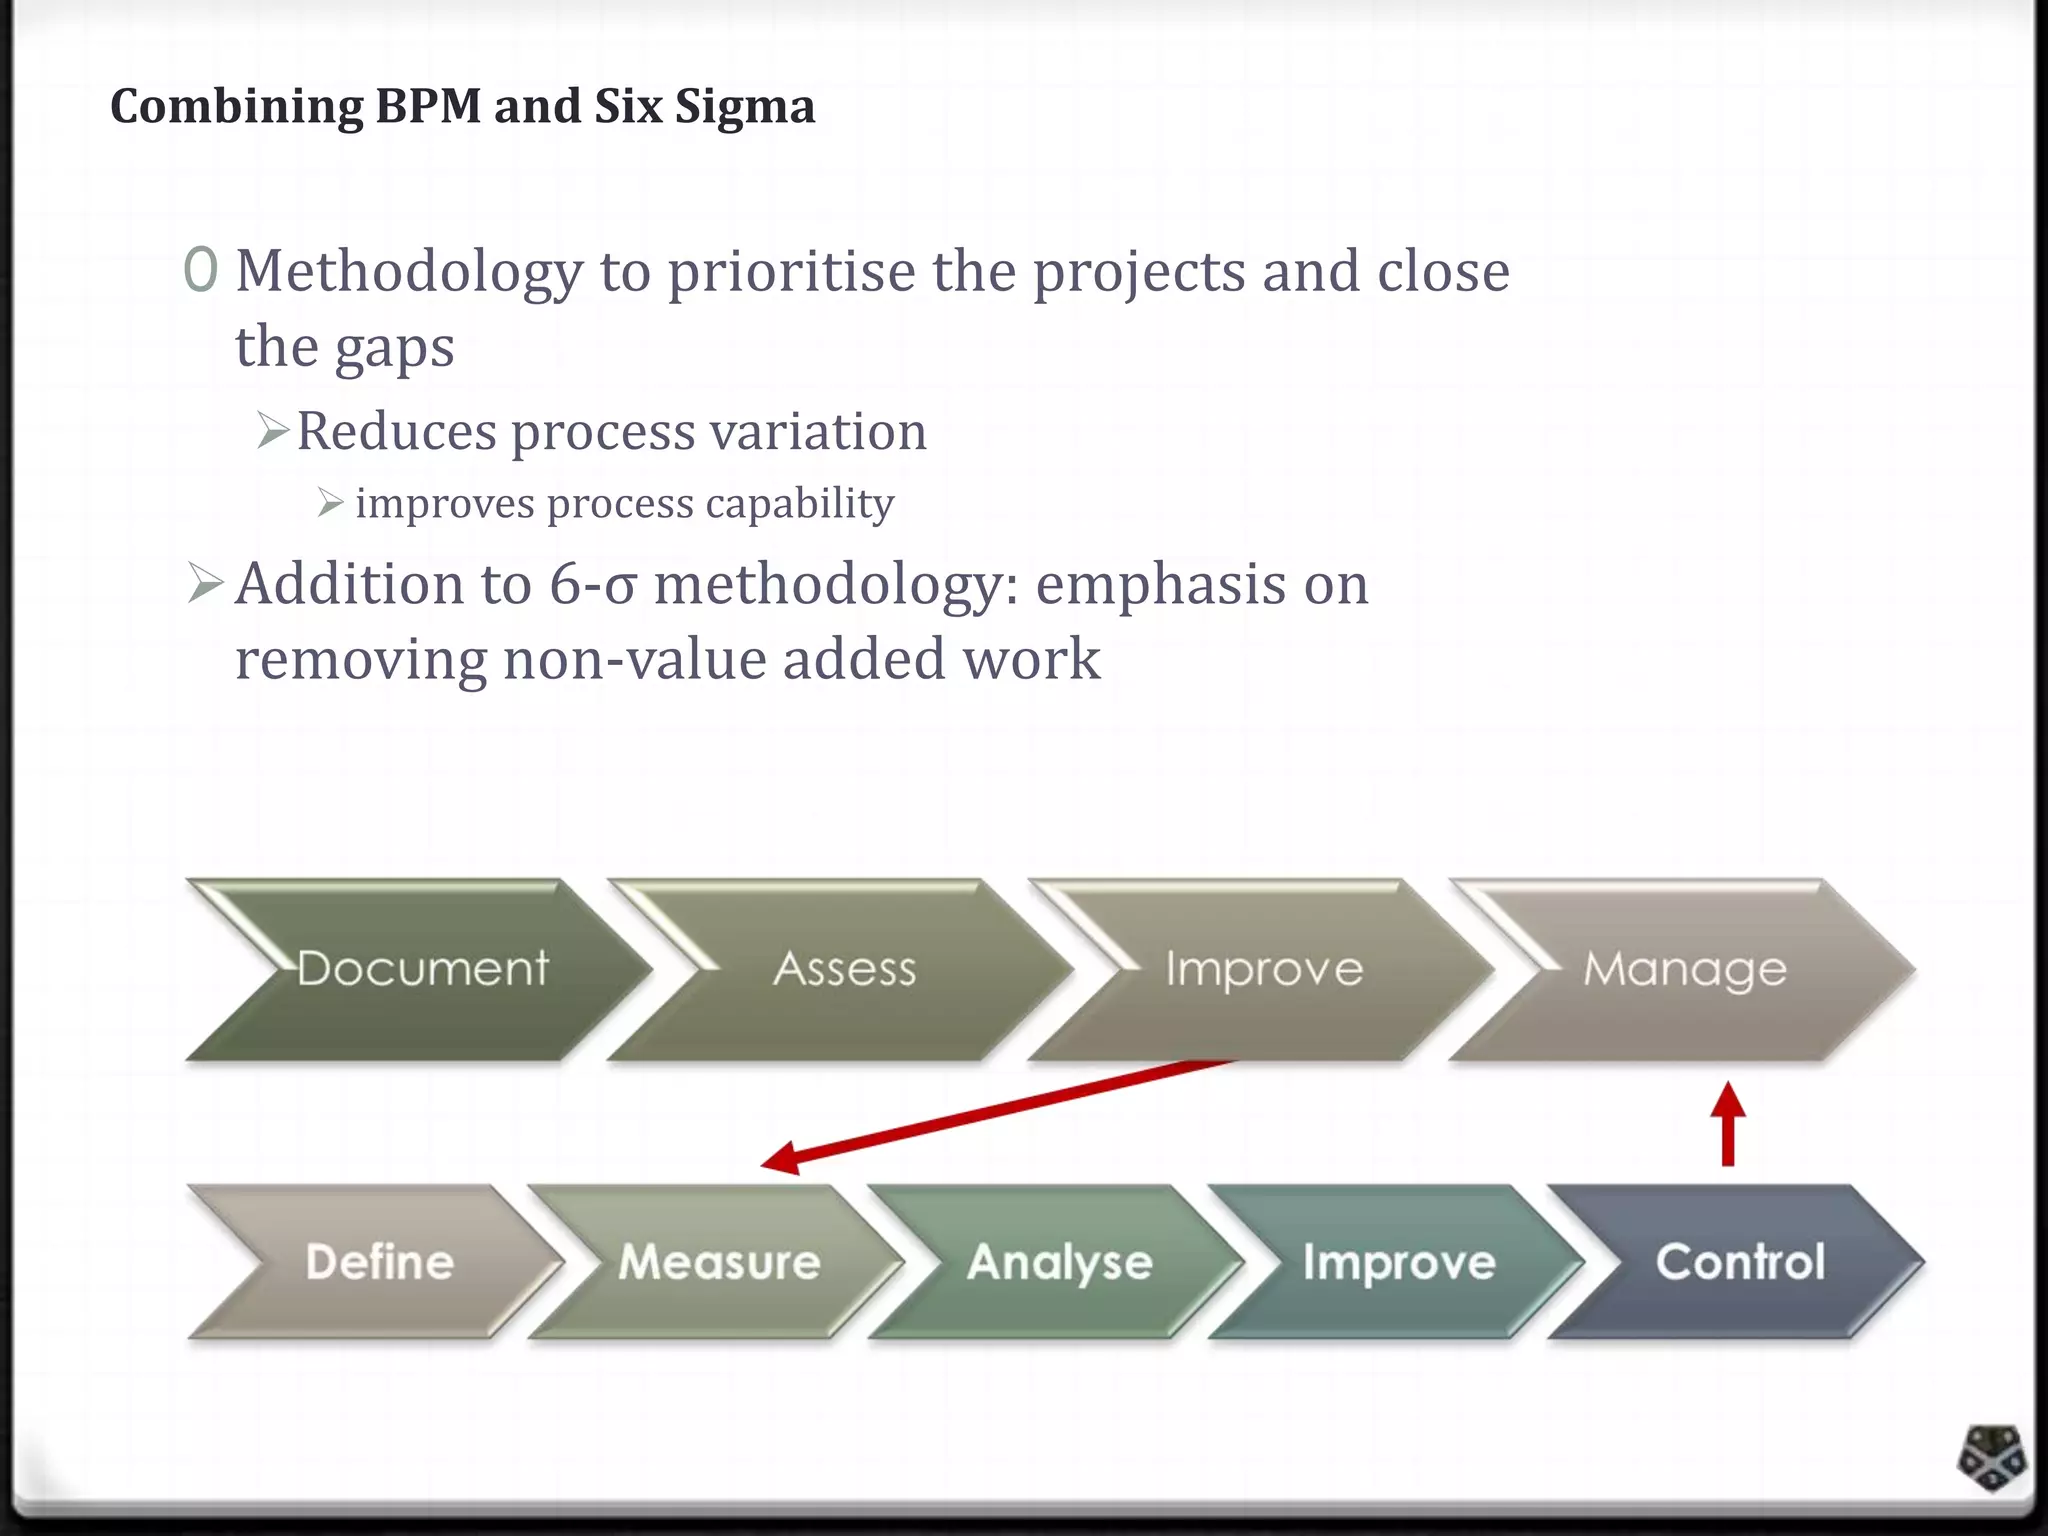
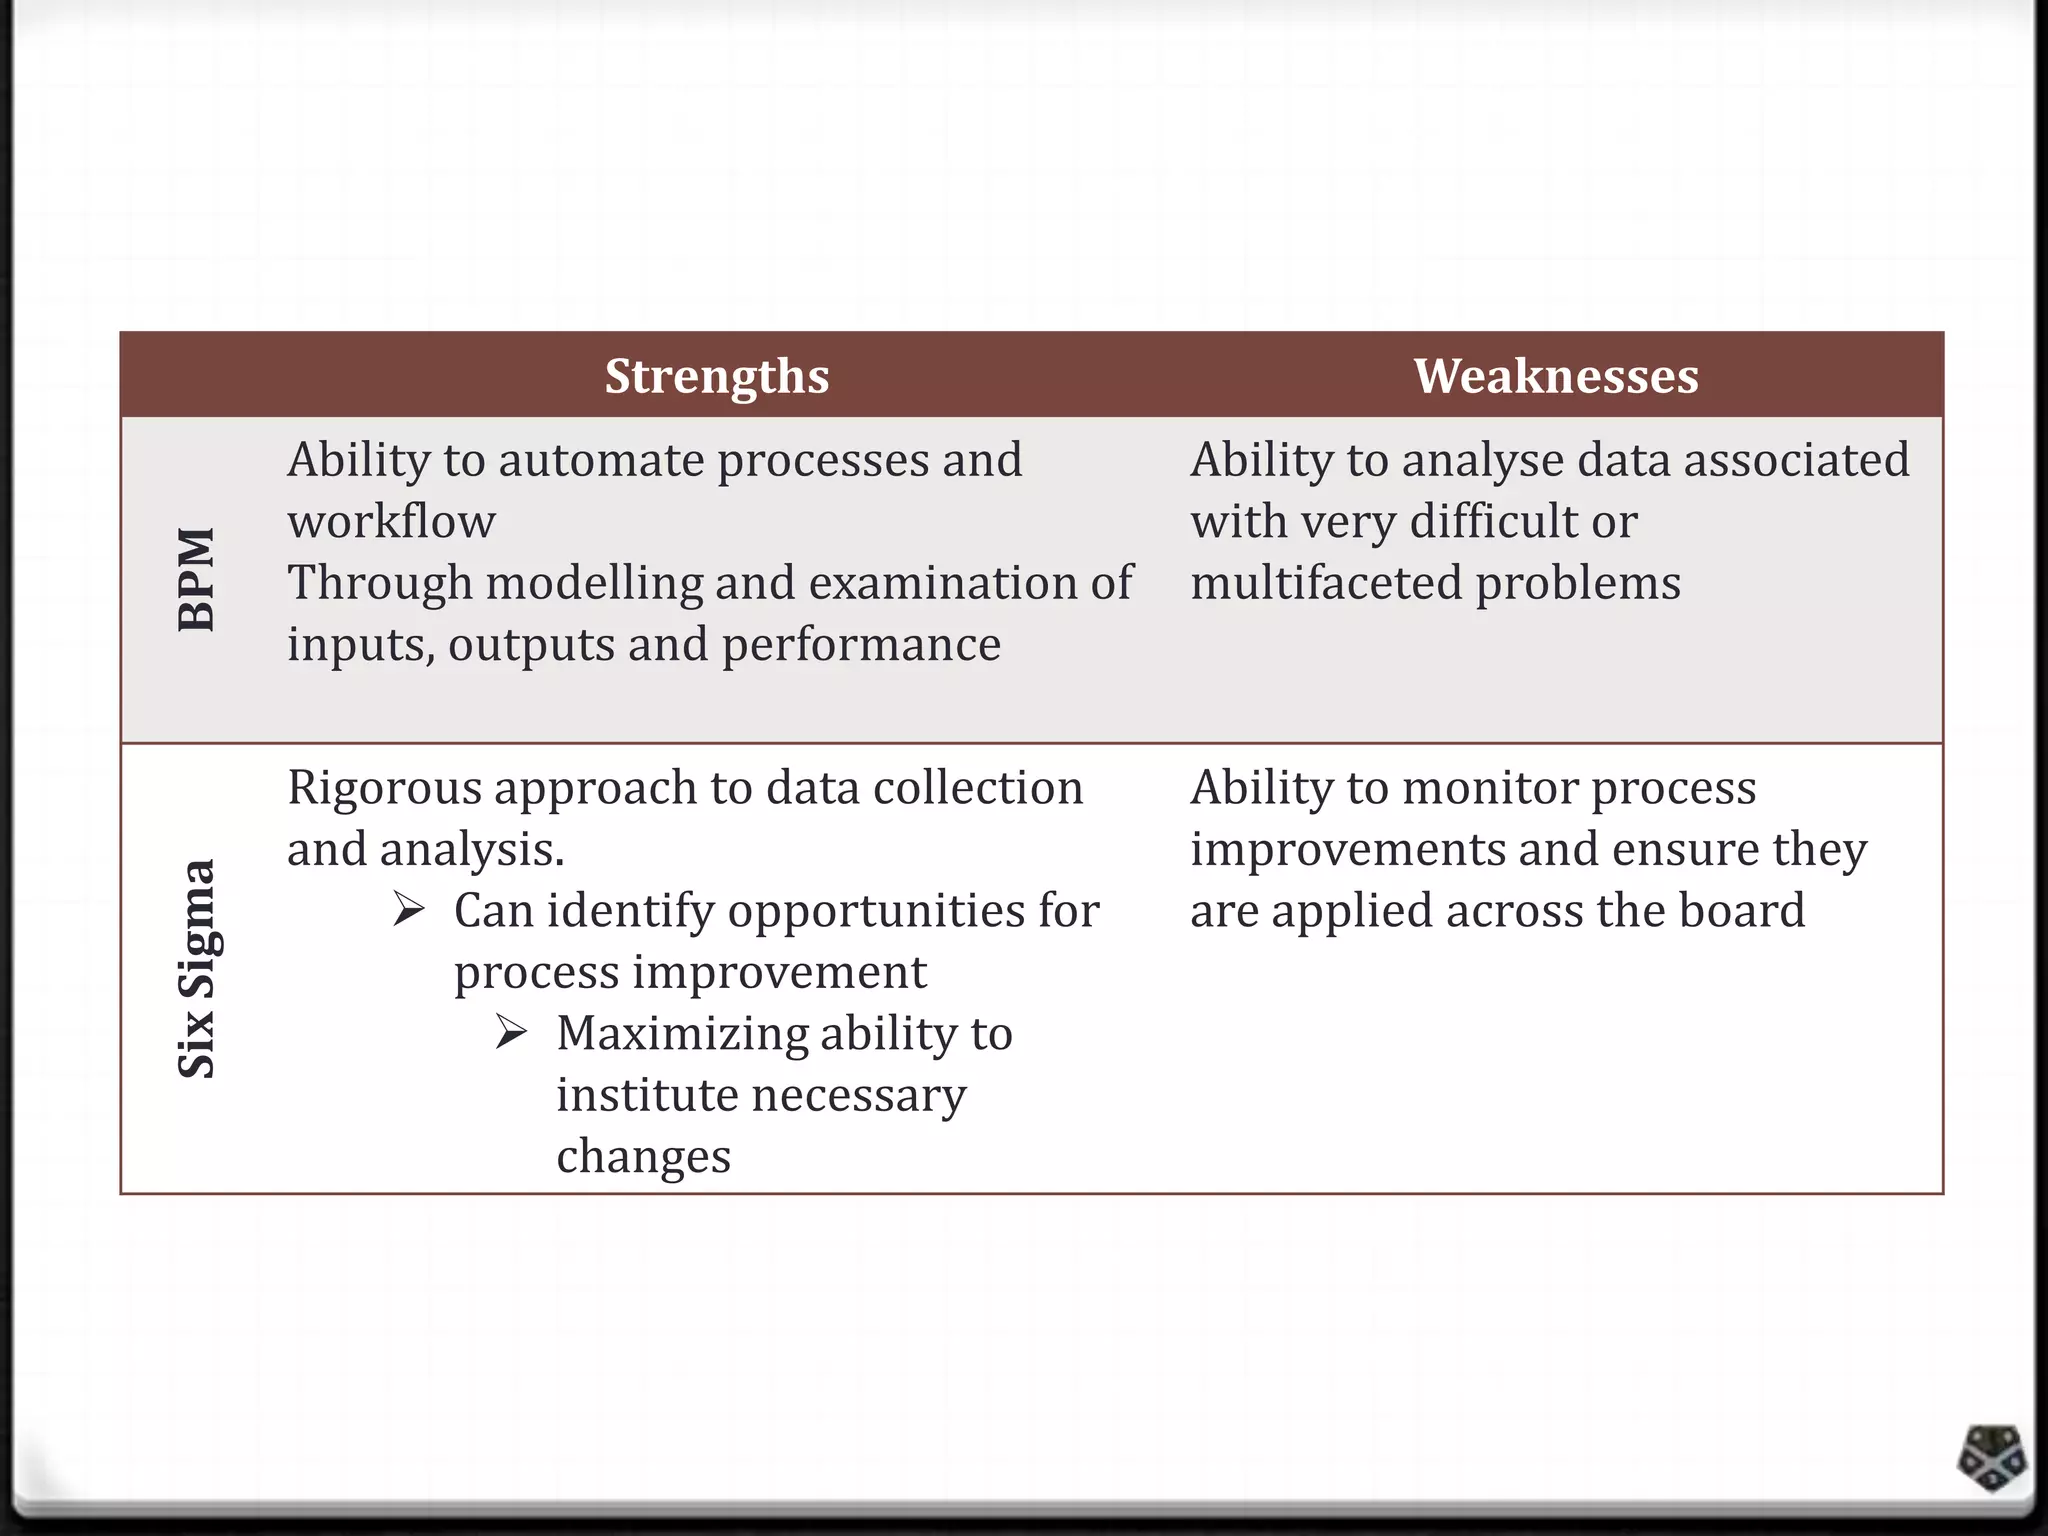
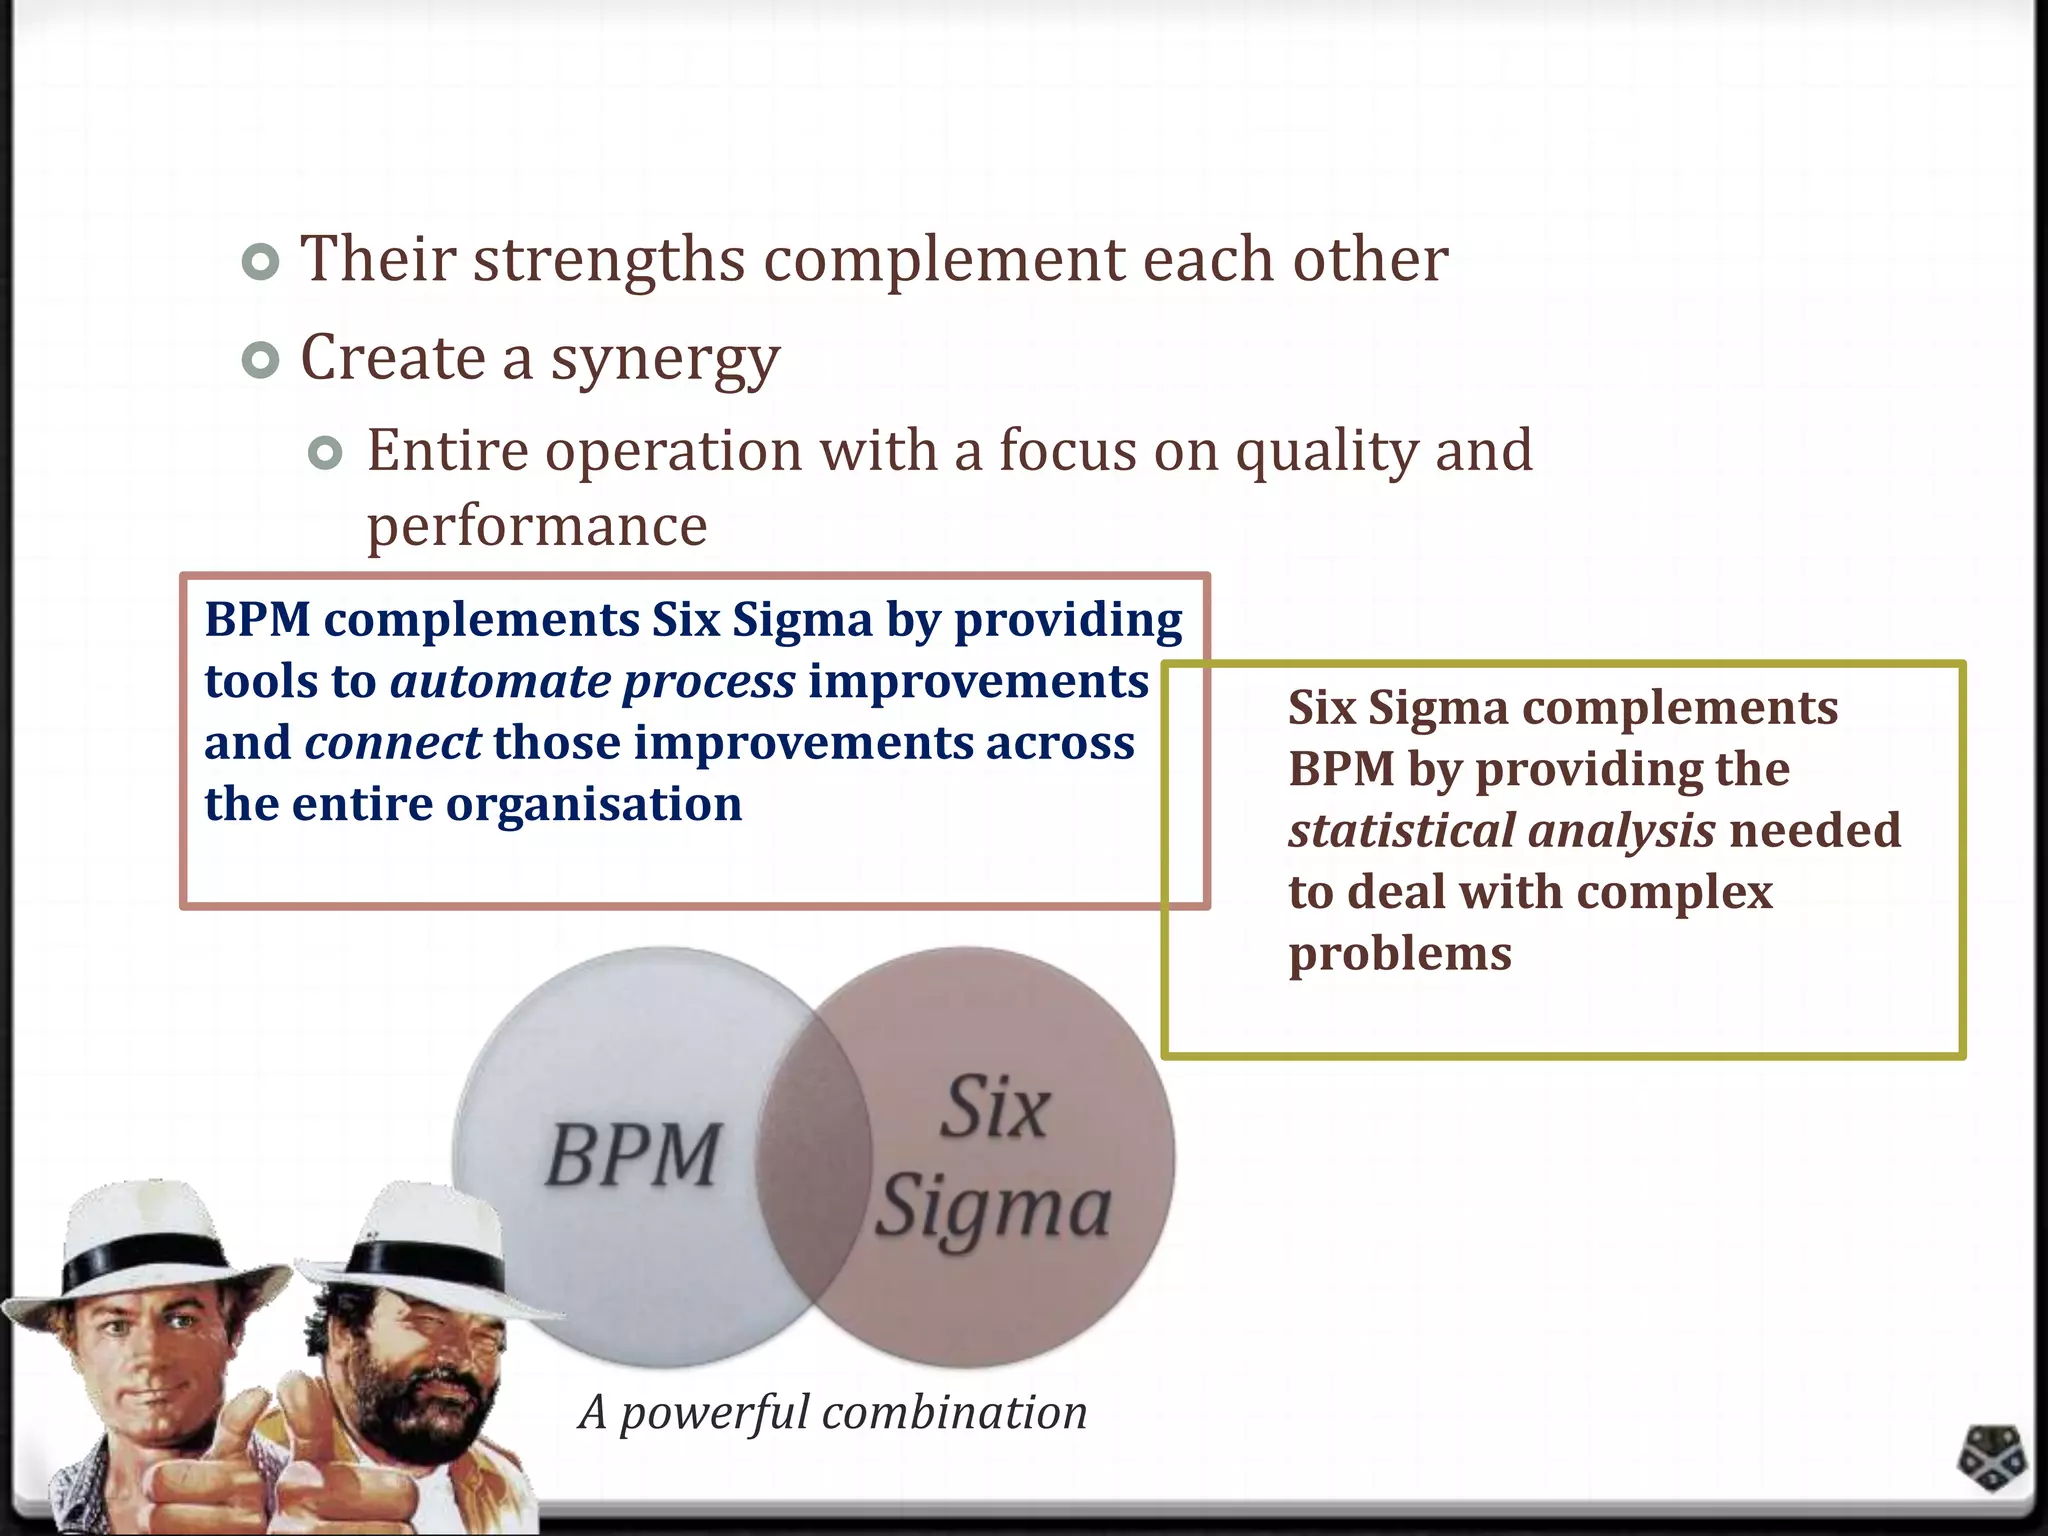
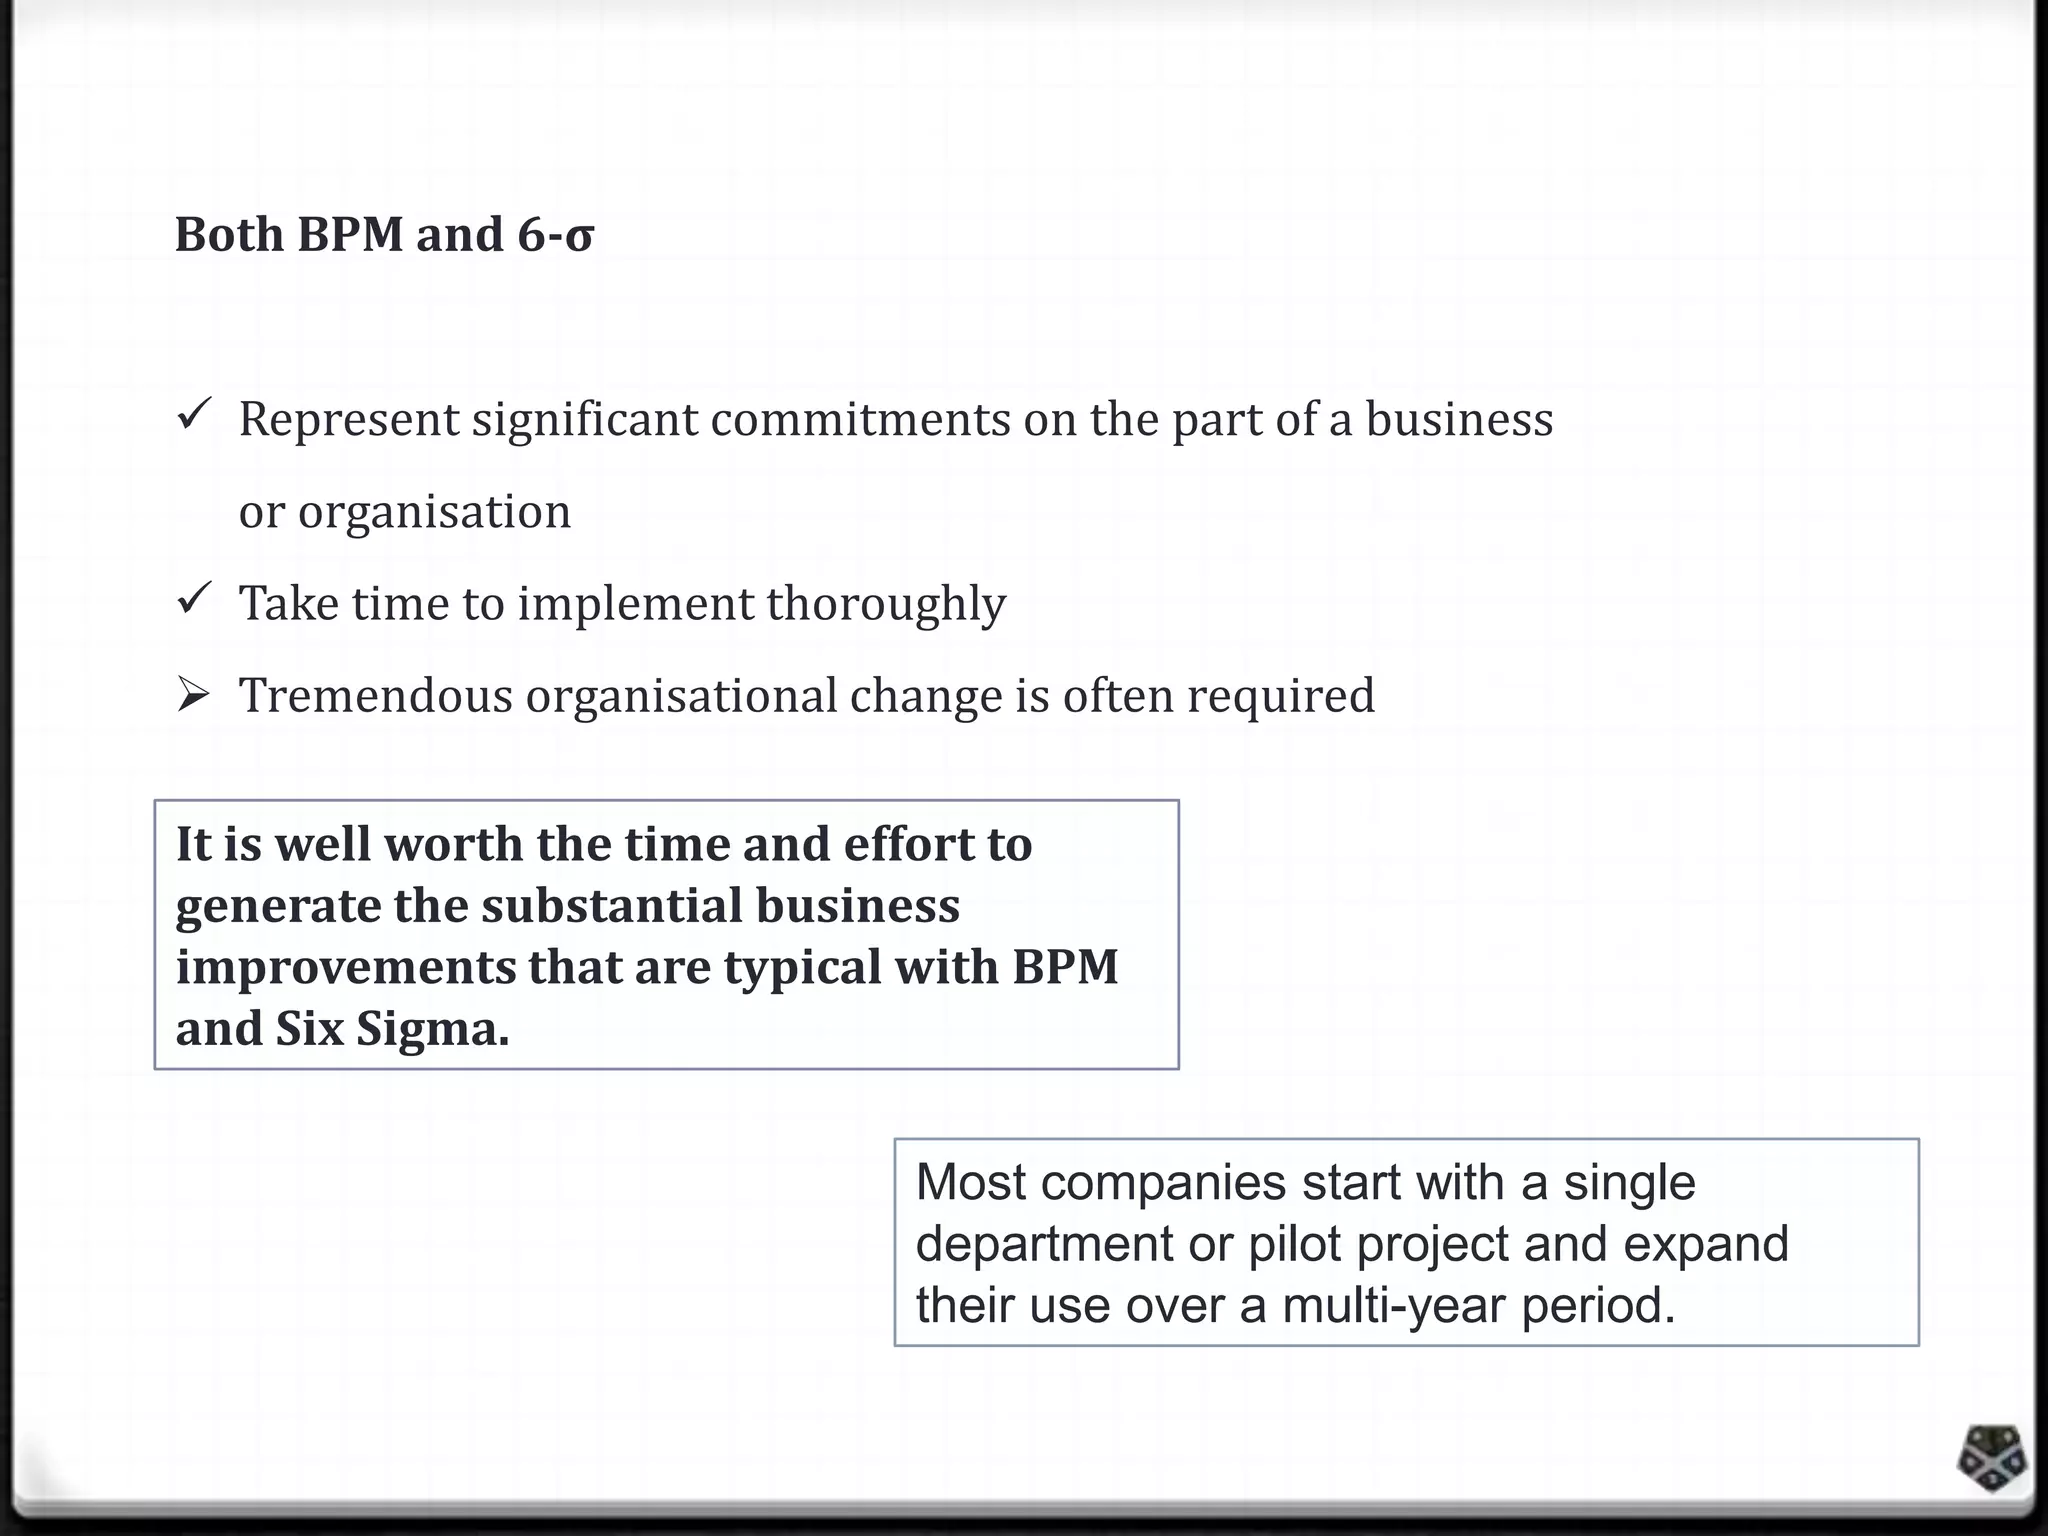
Basics
0 Set of tools and strategies for process

improvement
0 Motorola, 1980’s: improve the quality of
products and services
0 Systematic, rigorous routine
0 Approaches business processes from a highly
analytical point of view
0 Incorporates five levels of activity
Six Sigma
0 Allows an organization to reduce the variability in its products and
services
 Reduce waste
 Increase efficiency
 Increase customer satisfaction
 Solve business problems through rigorous application of data collection
and analysis tools
0 Five step progression (DMAIC)
 Key to success of six sigma: methodology
 Uses information and statistical analysis to address the achievement of
operational goals.
 Some differences in the five steps depending on whether they are used to
improve an existing process or design a new process

0 Goal (always): standard metric of 99.9997% defect free performance
Basics (cont.)
0 Graph of the normal distribution
0 underlies statistical assumptions of 6 σ model
0 σ (sigma) marks distance on horizontal axis

between mean, µ, and curve's inflection point
0 The greater this distance, the greater is the spread
of values encountered.
Philosophy
• Enterprise-wide embrace of defect reduction by making decisions based on hard data
and customer focus

Focus on the customer
• Meet or exceed customer requirements/expectations

Metrics
• Statistical focus to make process outcomes 99.9997% defect free
• (3.4 defects per million opportunities)

Methodology
• Structured approach to solving problems that uses specific tools and process
mapping to achieve the metric goal

Process based
• Defects or errors introduced into products or services are based upon deficiencies in
the processes
Five step progression (DMAIC)
0 Define

 Project goals and boundaries
 Identify issues to be addressed to achieve the higher sigma level

0 Measure

 Gather information about the current situation
 Obtain baseline data on current process performance
 Identify problem areas

0 Analyse

 Identify the root cause(s) of quality problems
 Confirm those causes using the appropriate data analysis tools

0 Improve

 Implement solutions that address the problems (analyse) phase

0 Control

 Evaluate and monitor the results of the improve phase

Basically identify an area where there is a process
problem, measure it, work out why there is a problem
and then fix it.
Combining BPM and Six Sigma

0 Methodology to prioritise the projects and close

the gaps

Reduces process variation
 improves process capability

 Addition to 6-σ methodology: emphasis on

removing non-value added work
Six Sigma

BPM

Strengths

Weaknesses

Ability to automate processes and
workflow
Through modelling and examination of
inputs, outputs and performance

Ability to analyse data associated
with very difficult or
multifaceted problems

Rigorous approach to data collection
and analysis.
 Can identify opportunities for
process improvement
 Maximizing ability to
institute necessary
changes

Ability to monitor process
improvements and ensure they
are applied across the board
 Their strengths complement each other
 Create a synergy


Entire operation with a focus on quality and
performance

BPM complements Six Sigma by providing
tools to automate process improvements
and connect those improvements across
the entire organisation

A powerful combination

Six Sigma complements
BPM by providing the
statistical analysis needed
to deal with complex
problems
Both BPM and 6-σ
 Represent significant commitments on the part of a business
or organisation

 Take time to implement thoroughly
 Tremendous organisational change is often required
It is well worth the time and effort to
generate the substantial business
improvements that are typical with BPM
and Six Sigma.
Most companies start with a single
department or pilot project and expand
their use over a multi-year period.

Combining BPM and 6-Sigma - Rudimentary Introduction

  • 2.
    Basics 0 Set oftools and strategies for process improvement 0 Motorola, 1980’s: improve the quality of products and services 0 Systematic, rigorous routine 0 Approaches business processes from a highly analytical point of view 0 Incorporates five levels of activity
  • 3.
    Six Sigma 0 Allowsan organization to reduce the variability in its products and services  Reduce waste  Increase efficiency  Increase customer satisfaction  Solve business problems through rigorous application of data collection and analysis tools 0 Five step progression (DMAIC)  Key to success of six sigma: methodology  Uses information and statistical analysis to address the achievement of operational goals.  Some differences in the five steps depending on whether they are used to improve an existing process or design a new process 0 Goal (always): standard metric of 99.9997% defect free performance
  • 4.
    Basics (cont.) 0 Graphof the normal distribution 0 underlies statistical assumptions of 6 σ model 0 σ (sigma) marks distance on horizontal axis between mean, µ, and curve's inflection point 0 The greater this distance, the greater is the spread of values encountered.
  • 5.
    Philosophy • Enterprise-wide embraceof defect reduction by making decisions based on hard data and customer focus Focus on the customer • Meet or exceed customer requirements/expectations Metrics • Statistical focus to make process outcomes 99.9997% defect free • (3.4 defects per million opportunities) Methodology • Structured approach to solving problems that uses specific tools and process mapping to achieve the metric goal Process based • Defects or errors introduced into products or services are based upon deficiencies in the processes
  • 6.
    Five step progression(DMAIC) 0 Define  Project goals and boundaries  Identify issues to be addressed to achieve the higher sigma level 0 Measure  Gather information about the current situation  Obtain baseline data on current process performance  Identify problem areas 0 Analyse  Identify the root cause(s) of quality problems  Confirm those causes using the appropriate data analysis tools 0 Improve  Implement solutions that address the problems (analyse) phase 0 Control  Evaluate and monitor the results of the improve phase Basically identify an area where there is a process problem, measure it, work out why there is a problem and then fix it.
  • 7.
    Combining BPM andSix Sigma 0 Methodology to prioritise the projects and close the gaps Reduces process variation  improves process capability  Addition to 6-σ methodology: emphasis on removing non-value added work
  • 8.
    Six Sigma BPM Strengths Weaknesses Ability toautomate processes and workflow Through modelling and examination of inputs, outputs and performance Ability to analyse data associated with very difficult or multifaceted problems Rigorous approach to data collection and analysis.  Can identify opportunities for process improvement  Maximizing ability to institute necessary changes Ability to monitor process improvements and ensure they are applied across the board
  • 9.
     Their strengthscomplement each other  Create a synergy  Entire operation with a focus on quality and performance BPM complements Six Sigma by providing tools to automate process improvements and connect those improvements across the entire organisation A powerful combination Six Sigma complements BPM by providing the statistical analysis needed to deal with complex problems
  • 10.
    Both BPM and6-σ  Represent significant commitments on the part of a business or organisation  Take time to implement thoroughly  Tremendous organisational change is often required It is well worth the time and effort to generate the substantial business improvements that are typical with BPM and Six Sigma. Most companies start with a single department or pilot project and expand their use over a multi-year period.

Editor's Notes

  • #3 Term comes from the notion that if one has six standard deviations between the process mean and the nearest specification limit, practically no items will fail to meet specifications.This is based on the calculation method employed in process capability studies.Capability studies measure the number of standard deviations between the process mean and the nearest specification limit in sigma units. As process standard deviation goes up, or the mean of the process moves away from the centre of the tolerance, fewer standard deviations will fit between the mean and the nearest specification limit, decreasing the sigma number and increasing the likelihood of items outside specification.
  • #5 For the green curve shown above, µ = 0 and σ = 1. The upper and lower specification limits (USL and LSL, respectively) are at a distance of 6σ from the mean. Because of the properties of the normal distribution, values lying that far away from the mean are extremely unlikely. Even if the mean were to move right or left by 1.5σ at some point in the future (1.5 sigma shift, coloured red and blue), there is still a good safety cushion. This is why Six Sigma aims to have processes where the mean is at least 6σ away from the nearest specification limit.