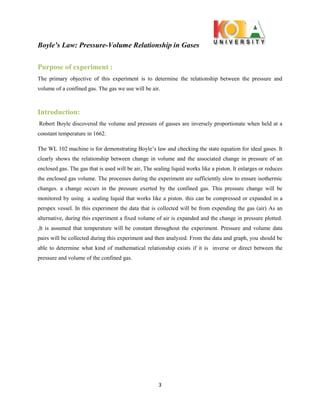
boyle's law thermodynamics lab Boyle’s law, also called Mariotte’s law, a relation concerning the compression and expansion of a gas at constant temperature. This empirical relation, formulated by the physicist Robert Boyle in 1662, states that the pressure (p) of a given quantity of gas varies inversely with its volume (v) at constant temperature; i.e., in equation form, pv = k, a constant. The relationship was also discovered by the French physicist Edme Mariotte (1676). ake a large piston or sealed syringe and stand it on end, then place an increasing number of objects on top. As the pressure grows, the volume of the air inside will decrease—these quantities are inversely proportional. However, the standard international unit for pressure is the Pascal. The English scientist Robert Boyle performed a series of experiments involving pressure and, in 1662, arrived at a general law—that the volume of a gas varies inversely with pressure.
Force is used to driving the liquid through the evaporator tubes thus producing high tube velocities. A high efficiency circulating pump, designed for large volume and sufficient head, is used to supply the force. Forced circulation evaporator is suitable in the pharmaceutical area for evaporation of thermolabile substance.
Evaporation is a phase change process. Evaporation cause cooling. This slides will explain you all types of Evaporators. All types of Evaporators will explain in this slide.Difference from Drying, Distillation, Crystallization. Three principal elements are of concern in evaporator design:
heat transfer, vapor-liquid separation, and efficient energy consumption. Critical operational and product characteristics of the solution to be evaporated have a major effect on the selection of the evaporator type most suited for the application.
Heat sensitivity
Fouling.
Objectives
Applications and factors influencing evaporation
Differences between evaporation and other heat process
Principles, construction ,working, uses, merits and demerits of :
-Steam jacketed kettle
-Horizontal tube evaporator
-Climbing film evaporator
-Forced circulation evaporator
-Multiple effect evaporator
-Economy of multiple effect evaporator
This presentation contains the Fluid flow chapter of Pharmaceutical engineering. This chapter include the definition of flow of fluid, Reynolds number, Bernollis therom, Manometers, Fluid flow measuring equipment's and applications.
This is the instruction sheet for my MYP year 4 chemistry unit on thermal energy. It's a Vernier lab, which means it requires proprietary probes from the Vernier company. I have adapted the company's original document to highlight key steps for my students.
BC Chemistry 162 Laboratory Manual Experiment 6 Vapor Press.docxrosemaryralphs52525
BC Chemistry 162 Laboratory Manual
Experiment 6: Vapor Pressure of Liquids
- 1 -
Experiment 6: Vapor Pressure of Liquids
Background
Liquids contain molecules that have different kinetic energies (due to different velocities). Some of the
faster liquid molecules have enough kinetic energy to vaporize. At the same time, some of the slower
vapor molecules condense into liquid. In an open container, the rate of vaporization will be greater than
the rate of condensation—hence, the liquid will eventually evaporate. In a sealed flask, however, there
will be a point in which equilibrium is reached between the rate of vaporization and the rate of
condensation. To the eye, it seems that the liquid doesn’t change at equilibrium. But at the microscopic
level a vapor molecule enters the liquid phase for every liquid molecule that enters the gas phase.
The total pressure in the sealed flask is due to the vaporized liquid plus air molecules present in the flask:
Ptotal = Pvapor + Pair (1)
In this experiment, you will investigate the relationship between
the vapor pressure of a liquid and its temperature. Pressure and
temperature data will be collected using a gas pressure sensor and
a temperature probe (Figure 1). Vapor pressures will be
determined by subtracting atmospheric pressure from the total
pressure.
The flask will be placed in water baths of different temperatures to
determine the effect of temperature on vapor pressure. You will
measure the vapor pressure of methanol and ethanol and
determine the enthalpy (heat) of vaporization for each liquid.
Objectives
In this experiment, you will
Investigate the relationship between the vapor pressure of a liquid and its temperature.
Compare the vapor pressure of two different liquids at the same temperature.
Use pressure‐temperature data and the Clausius‐Clapeyron equation to determine the heat of
vaporization for each liquid.
Caution!
The alcohols used in this experiment are flammable and poisonous. Avoid inhaling their vapors. Avoid
contacting them with your skin or clothing. Be sure there are no open flames in the lab during this
experiment. Notify your teacher immediately if an accident occurs.
Procedure
1. Wear goggles! You will work in pairs for this lab, but you may share water baths with your table.
2. Prepare four water baths: 20 to 25°C (use room temperature water), 30 to 35°C, 40 to 45°C, and 50 to
55°C. You should also have some hot water on a hot plate on reserve.
3. Obtain a temperature probe and gas pressure sensor. The sensor comes with a
rubber‐stopper assembly (Figure 2). The stopper has three holes, one of which
is closed. Make sure your tubing and valve are not inserted in the closed hole.
Insert the rubber‐stopper assembly into a 125 mL Erlenmeyer flask.
Important: Twist the stopper into the neck of the flask to ensure a tight
fit.
Figure 1
Figure 2
BC Ch.
Bellevue College Chemistry 162 1 Empirical Gas La.docxtaitcandie
Bellevue College | Chemistry 162
1
Empirical Gas Laws (Parts 1 and 2)
Pressure-volume and pressure-temperature relationships in gases
Some of the earliest experiments in chemistry and physics involved the study of gases. The invention
of the barometer and improved thermometers in the 17th century permitted the measurement of
macroscopic properties such as temperature, pressure, and volume. Scientific laws were developed to
describe the relationships between these properties. These laws allowed the prediction of how gases
behave under certain conditions, but an explanation or model of how gases operate on a microscopic
level was yet to be discovered.
After Dalton’s atomic theory was proposed in the early 1800’s (that matter was composed of atoms) a
framework for visualizing the motion of these particles followed. The kinetic molecular theory,
developed by Maxwell and Boltzmann in the mid 19th century, describes gas molecules in constant
random motion. Molecules collide resulting in changes in their velocities. These collisions exert
pressure against the container walls. The frequency of collisions and the speed distribution of these
molecules depend on the temperature and volume of the container. Hence, the pressure of a gas is
affected by changes in temperature and volume.
You may already think that the relationships between pressure, volume, temperature, and number of
gas molecules are intuitive, based on your ability to visualize molecular motion and a basic
understanding of the kinetic theory. The simple experiments that follow will allow you the
opportunity to confirm these relationships empirically, in a qualitative and quantitative manner. In
essence, you will play the role of a 17th century scientist (with some 21st century tools!) and discover
the laws for yourself—laws and constants that are still in use today.
In this experiment, you will:
Determine the relationship between the volume of a gas and its pressure (Part 1).
Determine the relationship between the temperature of a gas and its pressure (Part 2).
Figure 1.
The Kinetic Theory considers
gas molecules as particles that
collide in random motion.
Bellevue College | Chemistry 162
2
Note: If you are doing Part 3 to determine the value of
the Universal Gas Constant, R in the same period as Parts 1
and 2, you should get Part 3 started first.
Part 1: Pressure-Volume Relationship of Gases
In Part 1 you will use a gas pressure sensor and a gas syringe to measure the pressure of an air sample
at several different volumes to determine the relationship between the pressure and volume of air at
constant temperature.
Figure 2
Procedure
1. a. Plug the gas pressure sensor into channel 1 of the computer interface.
b. With the 20 mL syringe disconnected from the gas pressure sensor, move the piston of the
syringe until the front edge of the inside black ring (indic.
Experimental Determination of Compressibility Factors of Gasesiosrjce
The compressibility factor Z also known as the compression factor is the ratio of the molar volume of a
gas to the molar volume of an ideal gas at the same temperature and pressure. It is a useful thermodynamic
property accounting for real gas behavior. In general, deviation from ideal behavior becomes more significant
at lower temperatures and higher pressures. For gas mixtures, a gas composition must be specified while
calculating the compressibility factor.
an experiment on a co2 air conditioning system with copper heat exchangersINFOGAIN PUBLICATION
This paper presented an experiment on a CO2 air conditioning system with copper heat exchangers. In this study, the compressor and cooler were tested with hydraulic method to determine the deformed and torn temperatures. The results show that conventional compressor is not suitable for using high pressure, due to the COP of cycle is very low (0.5 only). With CO2 compressor, the cycle can be achieved COP of 3.07 at the evaporative temperature of 10C. This value equals with COP of commercial air conditioning system presently.
Aim:
The aim of this experiment is to determine the conversion of our reactants by using conductivity meter in the reactor which the reaction takes place which is a CSTR reactor.
Introduction:
In our experiment a reaction takes place between two reactants in a CSTR reactor, first reactant is the strong base (NaOH) and second reactant is the weak Acid which is (CH3CO2CH2CH3) to produce (CH3COONa) and (CH3CH2OH) and water.
But since one of reactant is weak (CH3CO2CH2CH3) this means our reactants won't fully react and convert into our product which means we don't have a 100% conversion like we have between two strong reactants.
So, in order to find conversion, we have to divide the concentration of the reactants reacted by the concentration of the reactant in our reactor as the term of conversion suggests.
In order to find concentration, we use conductivity meter which measures the amount of free ions in our reactor.
This way can find conductivity to find concentration which gives us the key to find conversion.
4
Tools:
o CSTR reactor:
Our CSTR reactor is continuous and we add the reactants together continuously. Before the reactants run out, we read the (λ) ،And we read the (T) . Our reactor has a capacity of one liter ، and has a thermometer ، and has a vent valve.
5
o Conductivity meter:
Is a tool to measure the amount of free ions in a liquid or solution which uses a small amount of electricity to use how much ions will carry the charge.
6
o service unit:
Our service unit for this experience holds the both of the tanks of both reactants, and the pumps which is needed for each tank to the inlet of the reactor.
7
o Control unit:
For this experiment the control unit provides power and electricity to our reactor But not the conductivity meter because it works on its own.
o Tank:
The tank provide store service to our reactant before being added to our reactor, which is located in unit service.
8
o Pumps:
The pumps are our helpful tool which add our reactants to the reactor, which is located in unit service but is controlled in and turned on and off in control unit.
9
Procedure:
1.Temperature sensor Ts.4/on T=18: reaction Dane isothermally.
2. stirrer A A1 on
3. Flow rate: on both reactants should inter in The reactor at The same Flow rate Conversion is not Function of Flow rate in This experiment
4. vent valve: It is opened when the reactants. reach The level needs to be closed.
5. The level adjust into another tank over Flow draining it.
6. when continuously adjusting level occurred Conductivity is read when It becomes constant in The conductivity meter.
Aim of the experiment
“The aim of this experiment is to determine the amount of heat loss from hot water by
parallel flow current in the pipes of the heat exchanger.”
Double Pipe Heat Exchanger. 3
Chemical Engineering Department.
Stage III
Introduction to double pipe heat exchangers
A double pipe heat exchanger, also known as a hairpin heat exchanger, is a type of heat
exchanger used to transfer heat between two fluids. It consists of two concentric pipes,
one inside the other, forming a “U” or “hairpin” shape. One fluid flows through the inner
pipe, while the other flows through the annular space between the inner and outer pipes.
This design allows for efficient heat transfer between the two fluids, making it suitable for
various applications, such as cooling or heating processes in industrial systems.
Types of flows in double pipe heat exchangers
In a double pipe heat exchanger, there are two primary flow arrangements, each with its
variations, however, we are going to be focusing on two simple arrangements only, as
they would suffice to comprehend the basic ideas behind double pipe heat exchangers.
One flow arrangement is called “parallel flow” and the other is called “counter flow”.
The latter will be explained in our next experiment.
Parallel flow or uni-flow: in this type of flow, both the hot and cold fluids flow in the
same direction, entering one end of the inner pipe and exiting the other end. This
arrangement is simple but generally less efficient for heat transfer because the
temperature difference between the two fluids decreases along the length of the
exchanger.
Figure 1: simple parallel flow diagram.
By “Research Gate”
Double Pipe Heat Exchanger. 4
Chemical Engineering Department.
Stage III
However, when there’s a significant temperature difference between the two fluids at the
inlet, parallel flow heat exchangers can be more efficient for heat transfer. Both
arrangements have advantages and disadvantages and are used depending on the
system requirements.
Theoretical calculation for heat transfer in double pipe heat
exchangers
Heat Transfer: Heat transfer is the process of the exchange of thermal energy between
two objects or systems that are at different temperatures, and the heat energy always
flows from the high temperature object or system to the low ones because the entropy of
an isolated system can never decrease.
There are several ways to calculate the amount of heat added or lost by an object or a
system. However, in this experiment a relatively simple equation can be used to
determine the amount of heat lost from the hot water, which is equal to the amount of
heat added to the cold water.
When pressure is held constant throughout the process, the amount of heat transfer will
be equal to the change in enthalpy of the system and therefore can be calculated using
constant pressure enthalpy change equation.
Q=ΔH=mCpΔT
Where:
Q=ΔH is the amount of heat transferred to or from the system (J).
m: mass of the system (Kg)
Cp: cons
Aim:
The aim of this experiment is to determine the conversion of our reactants by using conductivity meter in the reactor which the reaction takes place which is a batch reactor
Introduction:
In our experiment a reaction takes place between two reactants in a batch reactor, first reactant is the strong base (NaOH) and second reactant is the weak Acid which is (CH3COOH) to produce (CH3COONA) and water.
But since one of reactant is weak ( CH3COOH ) this means our reactants won’t fully react and convert into our product which means we don’t have a 100% conversion like we have between two strong reactants.
So, in order to find conversion we have to divide the concentration of the reactants reacted by the concentration of the reactant in our reactor as the term of conversion suggests.
In order to find concentration, we use conductivity meter which measures the amount of free ions in our reactor.
This way can find conductivity to find concentration which gives us the key to find conversion.
4
Tools:
Batch reactor
The reactor is not continuous we add the reactants and wait for the reaction to accrue, our reactor has 1L capacity
The batch reactor has other parts to its like thermometer which is plugged and can be dead from service unit
Conductivity meter
Is a tool to measure the amount of free ions in a liquid or solution which uses a small amount of electricity to use how much ions will carry the charge
5
Service unit
Our service unit for this experience holds the both of the tanks of both reactants, and the pumps which is needed for each tank to the inlet of the reactor
6
Control unit
For this experiment the control unit provides power and electricity to our reactor
But not the conductivity meter because it works on its own
Tank
The tank provide store service to our reactant before being added to our reactor, which is located in unit service.
7
Pumps
The pumps are our helpful tool which add our reactants to the reactor, which is located in unit service but is controlled in and turned on and off in control unit.
8
Procedure:
Before experiment: We make sure our units are ready
1 service unit
-the tanks for each reactant are filled with half a liter of its reactant so it gives us the concentration of 0.05M and 1 Liter of solution in the reactor
-The tubes must be connected well from tank to pump and to the reactor correctly and there isn’t any leak.
2 control unit
-the wire of the reactor must be plugged into its main power source on the control box as well as its temperature sensor to its right power source
-making sure both the temperature of the room is stable because heat will affect the reactor and cause inaccuracies
-making sure the conductivity meter is connected to our reactor.
During the experiment
-Switch on the control unit main power switch
-which on the conductivity meter
-switch on the pump of the base reactant and wait till the pump sends all the reactant into the reactor then we stop the first pump
-we switch on the second pump which is t
reactor design lab continuous stirred tank reactorDimaJawhar
Aim:
The aim of this experiment is to determine the conversion of our reactants by using conductivity meter in the reactor which the reaction takes place which is a CSTR reactor.
Introduction:
In our experiment a reaction takes place between two reactants in a CSTR reactor, first reactant is the strong base (NaOH) and second reactant is the weak Acid which is (CH3CO2CH2CH3) to produce (CH3COONa) and (CH3CH2OH) and water.
But since one of reactant is weak (CH3CO2CH2CH3) this means our reactants won't fully react and convert into our product which means we don't have a 100% conversion like we have between two strong reactants.
So, in order to find conversion, we have to divide the concentration of the reactants reacted by the concentration of the reactant in our reactor as the term of conversion suggests.
In order to find concentration, we use conductivity meter which measures the amount of free ions in our reactor.
This way can find conductivity to find concentration which gives us the key to find conversion.
4
Tools:
o CSTR reactor:
Our CSTR reactor is continuous and we add the reactants together continuously. Before the reactants run out, we read the (λ) ،And we read the (T) . Our reactor has a capacity of one liter ، and has a thermometer ، and has a vent valve.
5
o Conductivity meter:
Is a tool to measure the amount of free ions in a liquid or solution which uses a small amount of electricity to use how much ions will carry the charge.
6
o service unit:
Our service unit for this experience holds the both of the tanks of both reactants, and the pumps which is needed for each tank to the inlet of the reactor.
7
o Control unit:
For this experiment the control unit provides power and electricity to our reactor But not the conductivity meter because it works on its own.
o Tank:
The tank provide store service to our reactant before being added to our reactor, which is located in unit service.
8
o Pumps:
The pumps are our helpful tool which add our reactants to the reactor, which is located in unit service but is controlled in and turned on and off in control unit.
9
Procedure:
1.Temperature sensor Ts.4/on T=18: reaction Dane isothermally.
2. stirrer A A1 on
3. Flow rate: on both reactants should inter in The reactor at The same Flow rate Conversion is not Function of Flow rate in This experiment
4. vent valve: It is opened when the reactants. reach The level needs to be closed.
5. The level adjust into another tank over Flow draining it.
6. when continuously adjusting level occurred Conductivity is read when It becomes constant in The conductivity meter.
10
Calculation:
11
Discussion:
Sntia louay
Discussion:
What is a continuous stirred tank reactor?
(CSTR) is a type of chemical reactor that is widely used in industrial processes to produce chemicals, pharmaceuticals, and other products.
Is concentration constant in a CSTR?
The essential idea involved in the operation of a CSTR is that, after the passage of sufficient time, the concentrations of the
Abstract A natural gas processing plant separates impurities, nonmethane hydrocarbons, and fluids to produce high-quality pipeline-quality dry natural gas, extracted from underground. Natural gas processing produces valuable byproducts like natural gas liquids (NGLs). The process involves four key steps: oil and condensate removal, water removal, separation of NGLs, and sulfur and carbon dioxide removal. The primary procedures include planning, extraction, separation, removal, and storage. Natural gas sweetening removes CO2 and H2S from natural gas. It involves an amine scrubbing procedure, ensuring H2S and CO2 concentrations are below tariff limits. offers reliable solutions for natural gas sweetening applications. Water is present in natural gas, either in liquid or vapor form. Safe gas processing requires reducing and controlling its water content. .
Natural Gas Processing
4 | P a g e
Introduction
A natural gas processing plant is a facility designed to provide clean raw natural gas by separating impurities, various nonmethane hydrocarbons and fluids to get high quality natural gas, what is known as pipeline-quality dry natural gas. (Speight, J. G.,2019)
Natural gas (or fossil gas) is hiding beneath the surface and extracted both from under the ocean and land. As shown in Figure 1. (Energy Insight, 2023)
Figure 1: Schematic geology of natural gas resources. (Energy Insight, 2023)
natural gas It typically includes heavier hydrocarbons like ethane, propane, normal butane, isobutane, etc. in addition to a significant amount of methane. Additionally, it frequently has a significant proportion of nonhydrocarbons in its raw form, including carbon dioxide, hydrogen sulfide, and nitrogen. Such substances as helium, carbonyl sulfide, and other forms of mercaptan are present in tiny quantities. In generally, it is also saturated with water. Some examples of the analysis of different types of gas are provided in Table 1.
Table 1: Typical Raw Gas Composition. (Mohammed Hamzah Msaed,2021)
Natural Gas Processing
5 | P a g e
Methodology
Natural gas processing yields associated hydrocarbons, sometimes referred to as "natural gas liquids" (NGLs), which can be extremely valuable byproducts. Natural gasoline, propane, butane, isobutane, and ethane are examples of NGLs. These (NGLs) can be purchased individually and are used for a number of purposes, such as improving oil recovery in oil wells, supplying raw materials to petrochemical or oil refineries, and serving as energy sources.
Although the actual process of processing natural gas to pipeline dry gas quality standards might be highly complicated, there are typically four key steps involved in order to eliminate the different impurities: (U.S. Department of Transportation, 2017)
• Oil and Condensate Removal
• Water Removal
• Separation of Natural Gas Liquids
• Sulfur and Carbon Dioxide Removal
While there are several procedures involved in the processing of natural gas, separation, dehydration, removal of ca
chemical industries: water treatment flocculation tankDimaJawhar
Introduction:
If river or lake water is not treated or sterilized beforehand, it is barely clean enough
for human consumption. To make groundwater suitable for drinking, it frequently
requires some sort of treatment. Preserving the community's health is the main goal of
water treatment. Naturally, chemicals and dangerous microbes must not be present in
potable water. The water should have almost little turbidity, be a transparent hue, and
have no flavor or odor that is undesirable. Water used for household purposes shouldn't
be caustic or leave unsightly stains and buildup on plumbing fittings.
Figure 1: water treatment process flow diagram.
Regarding Figure 1 For the purpose of cleaning sewage, water, and industrial wastes,
one crucial step is the development of suspended floes, which may be effectively
separated from the solution by settling or filtering. We refer to this process as
coagulation or flocculation. up to 1920, sanitation engineers had little knowledge of the
nature of the process and often confused it with mixing, which refers to the act of
releasing coagulating chemicals in a liquid to aid in the solution's creation. Since then,
it has been discovered that flocculation is a physical process that needs time and mild
disturbance. However, there hasn't been much advancement in the scientific
understanding of the underlying principles and their application to design.
water treatment: flocculation process
Page | 4
Coagulation and flocculation
flocculation involves adding a chemical coagulant to water, for the particles
to create bigger, easier-to-separate clumps.
suspended particles cannot be eliminated. Smaller and lighter particles settle out more
slowly in some cases not at all, whereas larger and heavier particles settle out more
quickly. For this reason, coagulation—a chemical process—usually occurs before it
reaches the sedimentation stage. To combine the non-settling particles into bigger,
heavier masses of solids known as floc, chemicals (coagulants) are introduced to the
water. The (coagulants) are added to the water to make the non-settling particles
together into bigger, heavier masses of solids called floc. Aluminum sulfate (alum) is a
commonly used coagulant for water purification and deep sanitizing Other chemicals,
such as ferric sulfate or sodium aluminate are also be used.
Figure 2: A coagulant is used to minimize electric charges on the particles, to make it
easier to form the particles into clumps. However, it is not enough to settle the particles
out of solution.
water treatment: flocculation process
Page | 5
Oil emulsions will float to the top while suspended particles will sink to the bottom.
The removal of these contaminants during filtration will depend on how they precipitate
out of solution.
Any flocculated particles in the treated water can now be filtered out in the scenario
depicted above in Figure 2. These flocculated particles have now settled to the bottom
of the sedimentation chamber.
These particles ne
Aim:
To determine the heat loss in a double pipe heat exchanger counter-current flow
experiment.
Theory:
A double-pipe heat transfer exchanger consists of one or more pipes placed
concentrically inside another pipe of a larger diameter with appropriate fittings to direct
the flow from one section to the next. One fluid flows through the inner pipe (tube side)
in this experiment (hot water), and the other flows through the annular space (annulus)
(cold water).
The double-pipe heat exchanger is one of the basic kinds of exchangers with a very
flexible configuration. There are two types of counterflow or parallel flow for this type
that are the basis of design and calculation for determining pipe size, length, and
number of bends.
Double pipe heat exchanger counter current: heat is exchanged between two flowing
fluids at a different temperature that flows counter current in the heat exchanger double
pipe.
The efficiency is greater in counter-current than in parallel flow because the two fluids
(water) flow separately in counter-current flow when the high different temperatures
meet heat exchange rapidly due to the difference of temperatures, the hot water
becomes warm then cold as heat exchanges, and the cold water becomes warm the heat
exchange occurs till it reaches steady state. As it is explained in Figure 1.
Heat loss can be found by the equation below:
Q=ΔH=mCpΔT
Where: Q=ΔH is the amount of heat transferred to or from the system (J).
m: mass of the system (Kg)
Cp: constant pressure specific heat capacity of the system (J/g°C)
ΔT: difference in temperature of the system °C.
Experiment: Double pipe heat exchanger
4
Figure 1: concurrent and countercurrent respectively.
Procedure:
Double pipe heat exchanger: as shown in the figure-2:
1. Power switch: No.1
2. Temperature scale to select a temperature to heat the water in the tank [No.2] in
the figure.
3. Water tank a heating coil is used to heat the water [no.3].
4. Power pump to set a flow rate, the water is pumped through the double pipe heat
exchanger. [No.4]
5. A flow rate measurement is found in no.5
6. [No.6-7-8-9-10] The temperature measurements measure temperature
throughout the process.
7. Then the temperature and flow rate are collected in the temperature screen.
Experiment: Double pipe heat exchanger
5
Figure 2: double pipe heat exchanger.
Experiment: Double pipe heat exchanger
6
observation:
1. Turn on the device with the power switch.
2. The flow rate is set as 157 ml/s.
3. Heat water up to [40-50 Celsius] in this experiment: [44.4 Celsius] by the
heating coil in the water tank, set the desired temperature by the temperature
scale in the water tank.
4. Then water is pumped to the pipes by the power pump.
5. Adjust the valves so that the hot water and cold water flow countercurrent.
6. The hot water flows in the inner pipe in the double pipe through the pipe from
the pump to the heat exchanger
7. the cold water flows in the outer pipe counter current from the tank to the pipes
the valv
Abstract:
Introduction: The several ways that thermal energy is transferred from one place to another are referred to as the principle of heat transfer.
This process is known as radiation heat transfer.
The transfer of energy by thermal radiation, or electromagnetic waves, is known as radiant heat transfer.
A convection current is created when heated air rises and is replaced by colder air, transferring heat from the inner pane to the outside pane(s).
Heat is carried via the window frame in triple-glazing units; convection is minor in double-glazing units up to 20 mm, especially when argon gas is used, which is denser than air.
Heat transfer through buildings rooms and roofs: Even while convection often involves more variables than conduction, we are nevertheless able to characterize it and do some simple, accurate calculations to determine its effects.
Figure 7 illustrates each of the three heat transmission techniques in this portion of the attic.
This natural convection heating system, when correctly built, may be quite effective in heating a home evenly.
Environmental Heat Transfer
4
Introduction:
The several ways that thermal energy is transferred from one place to another are referred to as the principle of heat transfer. There are three main ways that heat travels through building assemblies: radiation, convection, and conduction. One or more of these mechanisms may be involved in a specific thermal energy transfer. Phase transitions also release or absorb heat through three processes: conduction, radiation, and convection. Examples of this include heat transfer from walls to rooms, from fluids to each other, between pipes, and from outside heat to dwellings. The types of heat transport are described in Figure 1. a (concept group LLC, 2023)
Figure 1: types of transferring heat. (energy saver, 2023)
Temperature and heat are not the same thing. Temperature is a measurement of the intensity of kinetic energy, which is what heat is. Consider two water containers, one holding 10 gallons and the other one holding 1 gallon, to demonstrate this. Both containers hold 50°F water. The bigger container retains ten times more heat than the smaller one, even if they are of the same temperature. Because it has a greater capacity, the larger container can hold more heat. (Clayton DeKorne, 2023)
Building heat transfer calculations are performed for different applications such as: (Kusuda T., 1977)
• heat transmission via the outer envelope, the basement walls, the slab-on-grade floor (to a semi-infinite zone),
• transmission, absorption, and reflection of short wavelengths (or solar heat) for openings.
• thermal storage in the external masses of structures.
Environmental Heat Transfer
5
• air leakage via outside envelopes as well as the interior partition walls, ceilings, and floors.
Interior environmental analyses-:
• radiant heat transfer between heat sinks or sources and interior surfaces,
• the transfer of heat convectively between interior surfaces an
chemical industries cement industry rotary Kiln.2023.pdfDimaJawhar
Abstract:
The assignment describes the cement industry's processes. Cement is a fundamental
building and civil engineering material.
the stages of getting Portland cement is Crushing and grinding the raw materials,
combining the components in precise proportions, burning the prepared mix in a kiln,
grinding the burnt result, known as "clinker," a percentage of gypsum (to limit the
period of set of the cement).
Under high temperatures, a rotary kiln is a physically huge process unit used in cement
manufacturing where limestone is degraded into calcium oxide, which forms the base
of cement clinker particles.
Also, the Location of the control parameters and variables is discussed.
Industry of Cement: Rotary Kiln
4
Introduction:
the cement industry is directly tied to the economy of the construction, In 1995, the
European Union produced 172 million tonnes of cement, accounting for nearly 12% of
global output. (European Commission, 2001)
After mining, grinding, and homogenization of raw materials, the first phase in cement
production is the calcination of calcium carbonate, followed by high-temperature
burning of the resultant calcium oxide with silica, alumina, and ferrous oxide to
generate clinker. To make cement, the clinker is crushed or milled with gypsum and
other ingredients. (European Commission,2001)
It is worth noting that cement is one of the most essential building materials in the
world. It is mostly utilized in the production of concrete. Concrete is made up of inert
mineral aggregates like sand, gravel, broken stones, and cement. Cement consumption
and manufacturing are inextricably linked to the construction industry, and
consequently to overall economic activity. Cement is one of the most developed
products in the world, owing to its importance as a construction material and the
geographical availability of the key raw materials, namely limestone. The extensive
development is also attributed to the low cost and high density of cement. Because of
the comparatively high prices, ground transportation is reduced. Export commerce
(excluding plants grown across borders) is often restricted in comparison to global
output. (N. Martin, m. D. Levine, et al,1995)
Referred to Figure 1 process flow diagram of the cement industry is explained There
are four stages in the manufacture of Portland cement:
• crushing and grinding the raw materials
• blending the materials in the correct proportions
• burning the prepared mix in a kiln
• grinding the burned product, known as “clinker,”
• percent of gypsum (to control the time of set of the cement).
The three manufacturing techniques are known as the wet, dry, and semidry processes,
and are so named because the raw materials are ground wet and fed to the kiln as a
Industry of Cement: Rotary Kiln
5
slurry, ground dry and supplied as a dry powder, or ground dry and subsequently
moistened to form nodules that are fed to the kiln. (Thomas o. Mason 2023)
Figure 1: The cement-making process, from raw material
Chemical Reaction EngineeringCatalysts in Chemical Reactor Designs DimaJawhar
Chemical reaction engineering is a subset of chemical engineering, and it is often simply called reaction engineering. Its content can be roughly divided into reaction kinetics and reactor design and analysis.
Reaction kinetics is mainly concerned with the mechanism and the rate of chemical reactions.
The three classical generic chemical reactors are the batch reactor, the continuous stirred-tank reactor (CSTR), and the plug flow tubular reactor (PFR). Each of these reactor types has its own unique characteristics, advantages, and disadvantages.
Bed reactor is used to contact fluids with solids. It is one of the most widely used industrial reactors and may or may not be catalytic. The bed is usually a column with the actual dimensions influenced by temperature and pressure drop in addition to the reaction kinetics.
Catalytic reactions and reactors have widespread applications in producing chemicals in bulk, petroleum, petrochemicals, pharmaceuticals, specialty chemicals, etc.
These rigorous design efforts, firmly based on sound mathematical principles, triggered the development of several profitable catalytic processes.
types of catalyst
Fixed bed reactors.
Trickle-bed reactors.
Moving bed reactors.
Rotating bed reactors.
Fluidized bed reactors.
Slurry reactors.
Using catalysts leads to faster, more energy-efficient chemical reactions. Catalysts also have a key property called selectivity, by which they can direct a reaction to increase the amount of desired product and reduce the amount of unwanted byproducts.
Aim of the experiment
“The aim of this experiment is to determine the amount of heat loss from hot water by
parallel flow current in the pipes of the heat exchanger.”
Double Pipe Heat Exchanger. 3
Chemical Engineering Department.
Stage III
Introduction to double pipe heat exchangers
A double pipe heat exchanger, also known as a hairpin heat exchanger, is a type of heat
exchanger used to transfer heat between two fluids. It consists of two concentric pipes,
one inside the other, forming a “U” or “hairpin” shape. One fluid flows through the inner
pipe, while the other flows through the annular space between the inner and outer pipes.
This design allows for efficient heat transfer between the two fluids, making it suitable for
various applications, such as cooling or heating processes in industrial systems.
Types of flows in double pipe heat exchangers
In a double pipe heat exchanger, there are two primary flow arrangements, each with its
variations, however, we’re are going to be focusing on two simple arrangements only, as
they would suffice to comprehend the basic ideas behind double pipe heat exchangers.
One flow arrangement is called “parallel flow” and the other is called “counter flow”.
The latter will be explained in our next experiment.
Parallel flow or uni-flow: in this type of flow, both the hot and cold fluids flow in the
same direction, entering one end of the inner pipe and exiting the other end. This
arrangement is simple but generally less efficient for heat transfer because the
temperature difference between the two fluids decreases along the length of the
exchanger.
Figure 1: simple parallel flow diagram.
By “Research Gate”
Double Pipe Heat Exchanger. 4
Chemical Engineering Department.
Stage III
However, when there’s a significant temperature difference between the two fluids at the
inlet, parallel flow heat exchangers can be more efficient for heat transfer. Both
arrangements have advantages and disadvantages and are used depending on the
system requirements.
Theoretical calculation for heat transfer in double pipe heat
exchangers
Heat Transfer: Heat transfer is the process of the exchange of thermal energy between
two objects or systems that are at different temperatures, and the heat energy always
flows from the high temperature object or system to the low ones because the entropy of
an isolated system can never decrease.
There are several ways to calculate the amount of heat added or lost by an object or a
system. However, in this experiment a relatively simple equation can be used to
determine the amount of heat lost from the hot water, which is equal to the amount of
heat added to the cold water.
When pressure is held constant throughout the process, the amount of heat transfer will
be equal to the change in enthalpy of the system and therefore can be calculated using
constant pressure enthalpy change equation.
Q=ΔH=mCpΔT
Where:
Q=ΔH is the amount of heat transferred to or from the system (J).
m: mass of the system (Kg)
Cp:
Bernoulli equation fluid mechanics lab experiments lab report:
Aim:
The main purpose of this experiment is to investigate Bernoulli’s law.
Theory:
Bernoulli’s principle states that the total mechanical energy of the moving fluid comprising the gravitational potential energy of elevation, the energy associated with the fluid pressure, and the kinetic energy of the fluid motion, remains constant.
The HM 150.07 experimental unit is used to demonstrate Bernoulli’s principle. includes a pipe section with a transparent Venturi nozzle and a movable Pitot tube for measuring the total pressure. The Pitot tube is located within the Venturi nozzle and is displaced axially. The position of the Pitot tube can be observed through the Venturi nozzle’s transparent front panel.
The Venturi nozzle is equipped with pressure measuring points to determine the static pressures. The pressures are displayed on the six-tube manometers. The total pressure is measured by the Pitot tube and displayed on another single-tube manometer. Bernoulli’s law is expressed as:
Where: •P= static pressure of the fluid at the cross-section • 𝜌= density of flowing fluid
•g= acceleration due to gravity •v= mean velocity of fluid flow at the cross-section
•h= elevation head of the center of the cross-section with respect to a datum.
Figure-1: Venturi meter: It is a device based on Bernoulli’s theorem and is used for measuring the flow rate of liquid flow through the pipes.
Bernoulli equation
4
Procedure:
Equipment: HM-150
Figure-1: 1 diagram, 2 tube manometers (static pressures), 3 water supply, 4 valve, 5 Venturi nozzle, 6 water outlet, 7 valve for water outlet, 8 Pitot tube, 9 single tube manometer (total pressure)
Specification:
1. familiarization with Bernoulli’s principle
2. Venturi nozzle with a transparent front panel and measuring points for measuring the static pressures
3. axially movable Pitot tube for determining the total pressure at various points within the Venturi nozzle
4. 6 tube manometers for displaying the static pressures
5. single tube manometer for displaying the total pressure
6. flow rate determined by HM 150 base module
7. water supply using HM 150 base module or via laboratory supply
sulfur content petroleum and gas lab report experement
Aim:
This test method covers the determination of total sulfur in petroleum and petroleum products
that are liquid at ambient conditions. These materials can include diesel fuel, jet fuel,
kerosene, other distillate oil, naphtha, residual oil, lubricating base oil, hydraulic oil, crude
oil, unleaded gasoline, gasoline ethanol blends, and similar petroleum products.
Introduction
This test method provides rapid and precise measurement of total sulfur in petroleum and
petroleum products with a minimum of sample preparation. A typical analysis time is 1 min
to 5 min.
In this experiment the model (RX-360SH) determines total sulfur in petroleum products, such as
gas oil, fuel oil, crude oil and naphtha, using energy dispersive X-ray fluorescence (EDXRF)
method, which is an accurate, non-destructive, economical and yet quick method prescribed
per sample.
The quality of petroleum products is determined by the amount of sulfur present. It is
necessary to know sulfur concentration for processing purposes. There are also regulations
promulgated in federal, state, and local agencies that restrict the amount of sulfur present in
some fuels.
This method provides the determining whether the sulfur content of petroleum or a petroleum
product meets specification or regulatory limits.
Figure-1: RX-360SH.
4
Procedure : Total sulfur analyzer for petroleum products by energy dispersive
X-ray fluorescence method :
1. RX-360SH
2. A prepared sample cup and it’s supplies
3. Sample volume: 3-5ml
4. Measuring range: 0-6.00wt%
Required equipment’s is shown in figure-2 as the numbers follow the tools :
1. two-way-open cylinder (1). 2. plastic-sheet’s (2). 3. Plastic ring. 4. Lid
5. two-way-open cylinder. 6. Removing the sample ring. 7. stand.
temperature measurement thermodynamics lab experement lab report
Aim:
Measuring the temperature by different methods and draw the calibration curve with the
thermometer
Introduction
Recording temperature is one of the basic tasks in process and manufacturing automation.
The WL 202 experimentation set-up covers the full range of temperature measurement
methods. As well as non-electrical measuring methods, such as gas- and liquid-filled
thermometers and bimetallic thermometers, all typical electronic measuring methods are
covered in the experiments. The electronically measured temperatures are displayed directly
on programmable digital displays. A temperature-proportionate output voltage signal
(0...10V) is accessible from lab jacks, enabling temperature characteristics to be recorded
with, for example, a plotter. A digital mustimeter with precision resistors is used to calibrate
the electrical measuring devices. Various heat sources or storage units (immersion heater,
vacuum flask and laboratory heater) permit relevant temperature ranges to be achieved for the
sensors being tested. A plastic casing houses the sensors, cables, temperature measuring
strips and immersion heater. The well-structured instructional material sets out the
fundamentals and provides a step-by-step guide through the experiments.
1. power-regulated socket.
2. vacuum flask.
3. immersion heater.
4. laboratory heater for water and sand.
Measuring temperature experiment by WL-202
4
5. multimeter.
6. temperature sensors.
7. temperature measuring strips.
8. mercury thermometer.
9. bimetal thermometer.
10. gas pressure thermometer.
11. psychrometer to determine air humidity.
12. digital display of temperature sensors.
1. Immersion
lifting force fluid mechanics lab report Aim of this Experiment:
Finding lifting force for a solid object when thrown into fluid (H2O).
Introduction
The lift force, lifting force or simply lift is a mechanical force generated by solid objects as they move through a fluid. In general, the lift is an upward-acting force on an aircraft wing or airfoil. There are several ways to explain how an airfoil generates lift.
Lift is generated when an object turns a fluid away from its direction of flow. When the object and fluid move relative to each other, the object turns the fluid flow in a direction perpendicular to that flow, and the force required to do this creates an equal and opposite force that is lift. The object may be moving through a stationary fluid, or the fluid may be flowing past a stationary object— these two are effectively identical as, in principle, it is only the frame of reference of the viewer which differs.
In the case of an aircraft wing, pressure regions turn the passing flow of air downward towards the ground. These pressure regions exert an equal and opposite force on the wing, called lift, that supports the aircraft in the air.
a floating object from sinking. When the object is immersed in water (or any other liquid), its weight pulls it downwards. Buoyancy opposes that weight and has a magnitude directly proportional to the volume of fluid that would otherwise occupy the space taken by the object – in other words, to the volume of the displaced liquid.
The theory of lifting force can be expressed:
FA=P*g*Vdisplaced
FGwater=FG-FA
Where:
(fa=lifting force ,p=density of fluid, V=volume displacement, & g=gravity)
Equipment and tools :
1. Stand
2. Beaker 350ml.
3. Beaker 100ml.
4. Over flow beaker
5. Sample experiment: ( brass (CU) , ployoxymethelene, aluminum )
6. Spring balance.
7. Graduated cylinder.
Figure-1 : tools and equipments for lifting force experement.
Procedure :
1. Weight each sample experiment ( brass (CU) , polyoxymethylene, aluminum ) by the spring balance, The mass is hung on the end of a spring and the deflection of the spring due to the downwards gravitational force on the mass is measured against a scale. Fg measuring unite N before putting it into water:
• Take an iron stand and suspend a spring balance to it.
• Study the spring balance, its scale and its least count.
• Record your observations.
2. Find the weight of the samples in air:
• Take the samples ( brass (CU) , polyoxymethylene, aluminum ), tie thread to it and suspend on the hook of the spring balance.
• Record the weight of the samples in air. Let this weight be FGAir
3. Find the weight of the samples immersed in tap water and record the apparent loss in (mL) :
Take an overflow can, fill it with water such that its water level touches the spout of the overflow can.
Keep an overflow can under the spring balance such that the sample gets fully immersed in the water of the overflow can.
Keep a beaker whose volume (mL) is recorded, at the mouth of
thermodynamics dew point lab report Generally, hygrometers, or cooled mirrors, have been the conventional air measurement tools used for precise dew point measurement. The device is considered to be a humidity transfer standard. The process entails cooling a mirror until water vapor begins to condense on the surface. The temperature of the mirror is measured. This projects the dew point of the air. This process is generally used in laboratory practices.
A dew-point hygrometer was invented in 1751. For this instrument, cold water was added to water in a vessel until dew formed on the vessel, and the temperature of the vessel, the dew point, provided a direct index of humidity.
In this experiment acetone is used even though the sample is not necessary to be acetone nor the amount of volume matters that becomes vapor so that the temperature (dew point) is measured until the metal mirror starts to condense.
.
Relative Humidity Relative humidity (RH) is the ratio between saturated humidity over absolute humidity at a given temperature. Relative humidity depends on temperature and the pressure of the system of interest. It requires less water vapor to attain high relative humidity at low temperatures; more water vapor is required to attain high relative humidity in warm or hot air. Relative humidity is normally expressed as a percentage ; a higher percentage means that the air water mixture is more humid ; a lower percentage means that the air-water mixture is less humid.
Relative Humidity (%RH) =𝑭𝑺𝐅𝐀∗%𝟏𝟎𝟎
Absolute humidity is the total mass of water vapor present in a given volume of air. It does not take temperature into consideration. Absolute humidity in the atmosphere ranges from near zero to roughly 30 grams per cubic meter when the air is saturated at 30 °C (86 °F).
Finding Dew point by hygrometer
4
Absolute humidity is the mass of the water vapor divided by the volume of the air and water vapor The absolute humidity changes as air temperature or pressure changes.
The saturation humidity (Hs or FA) is the maximum quantity of water vapor that air can contain at a given temperature, without phase separation. The relative humidity (φ or RH) is the ratio (as percentage) of the partial pressure of water vapor in air, to the vapor pressure of liquid water at the same temperature.
phase change occurs at dew point temperature when the temperature of a gas is the temperature at which the water vapor or low-boiling hydrocarbon derivatives contained in the gas is transformed into the liquid state.
The boiling point of a liquid varies according to the applied pressure; the normal boiling point is the temperature at which the vapor pressure is equal to the standard sea-level atmospheric pressure (760 mm [29.92 inches] of mercury). At sea level, water boils at 100° C (212° F).
Finding Dew point by hygrometer
5
Physical bases of the Measurement Procedure:
At room temperature ether is close to its boiling point. Rapid evaporation is already taking place
Calibrating the bourdon gauge. which is used to measure gauge Pressure. The deadweight piston gauge (Bell and Howell) is used is to measure pressure in terms of fundamental units - force and area. A piston is inserted into a close fitting cylinder. Weights are placed on one end of the piston and are supported by fluid pressure applied to the other end. For absolute pressure measurements the assembly is placed inside an evacuated bell jar. Pressure measurements take into account a number of parameters affecting the instrument and its environment.
The pressure is applied via weights which are placed on a weight support. The latter has a piston which acts on hydraulic oil in a pipe system, so that a manometer which is also connected to the system should indicate certain pressures. The device contains a Bourdon spring manometer with a transparent dial. The display mechanism and the various adjustment opportunities are therefore clearly identifiable. Hydraulic oil is used to transfer pressure. Instructions :
1. Bourdon tube pressure gauge for pressure measurement
2. transparent dial face with a view of the spring mechanism
3. accurately fitting piston and cylinder of the piston manometer without seals
4. hydraulic oil for transfer of the force hydraulic pump with storage tank and bleed mechanism The device for calibrating pressure gauges essentially consists of two units:
1. The pressure gauge unit This is where the manometer to be calibrated is screwed in
2. The load unit The load unit consists of several weights and a cylinder with a piston. An increase in the load results in an increase in pressure. The load unit is connected to the pressure
gauge unit via an oil-filled line, enabling the manometer to display the increase in pressure.
The following sectional drawing shows how the load unit and pressure gauge unit are connected:
Figure-4: Hydraulic connections.
both units are connected by means of a pipeline. When the support is loaded with weights, the oil pressure in the system increases. The seal between the piston and the cylinder is metallic, with no other sealing elements. The fit has been very carefully designed to ensure that the piston operates almost entirely without friction, and with minimal oil leakage.
The weights are designed in such a way that pressure increments of 0,5bar are possible. Place the small weight on the weight support first. A guide pin is provided for this purpose. The other weights would lie askew on the plunger and would corrupt the measurements due to different levels of friction.
flash point petroleum and gas lab experiment report, The flash point is the lowest temperature at which there will be enough flammable vapor to induce ignition when an ignition source is applied.Flash points are determined experimentally by heating the liquid in a container (cup) and then introducing a small flame just above the liquid surface. The temperature at which there is a flash/ignition is recorded as the flash point. The closed-cup test PMA 5 contains any vapors
produced and essentially simulates the situation
in which a potential source of ignition is
accidentally introduced into a container. In this
test a test specimen is introduced into a cup and
a close-fitting lid is fitted to the top of the cup.
The cup and test specimen is heated.
Subsequently, apertures are opened in the lid to
allow air into the cup and the ignition source to
be dipped into the vapors to test for a flash.
The closed cup is mostly used in product specifications and regulations due to
its better precision. The following table shows the comparative flash points
measured in open and closed cup apparatus for some common pure liquids.
Welcome to WIPAC Monthly the magazine brought to you by the LinkedIn Group Water Industry Process Automation & Control.
In this month's edition, along with this month's industry news to celebrate the 13 years since the group was created we have articles including
A case study of the used of Advanced Process Control at the Wastewater Treatment works at Lleida in Spain
A look back on an article on smart wastewater networks in order to see how the industry has measured up in the interim around the adoption of Digital Transformation in the Water Industry.
About
Indigenized remote control interface card suitable for MAFI system CCR equipment. Compatible for IDM8000 CCR. Backplane mounted serial and TCP/Ethernet communication module for CCR remote access. IDM 8000 CCR remote control on serial and TCP protocol.
• Remote control: Parallel or serial interface.
• Compatible with MAFI CCR system.
• Compatible with IDM8000 CCR.
• Compatible with Backplane mount serial communication.
• Compatible with commercial and Defence aviation CCR system.
• Remote control system for accessing CCR and allied system over serial or TCP.
• Indigenized local Support/presence in India.
• Easy in configuration using DIP switches.
Technical Specifications
Indigenized remote control interface card suitable for MAFI system CCR equipment. Compatible for IDM8000 CCR. Backplane mounted serial and TCP/Ethernet communication module for CCR remote access. IDM 8000 CCR remote control on serial and TCP protocol.
Key Features
Indigenized remote control interface card suitable for MAFI system CCR equipment. Compatible for IDM8000 CCR. Backplane mounted serial and TCP/Ethernet communication module for CCR remote access. IDM 8000 CCR remote control on serial and TCP protocol.
• Remote control: Parallel or serial interface
• Compatible with MAFI CCR system
• Copatiable with IDM8000 CCR
• Compatible with Backplane mount serial communication.
• Compatible with commercial and Defence aviation CCR system.
• Remote control system for accessing CCR and allied system over serial or TCP.
• Indigenized local Support/presence in India.
Application
• Remote control: Parallel or serial interface.
• Compatible with MAFI CCR system.
• Compatible with IDM8000 CCR.
• Compatible with Backplane mount serial communication.
• Compatible with commercial and Defence aviation CCR system.
• Remote control system for accessing CCR and allied system over serial or TCP.
• Indigenized local Support/presence in India.
• Easy in configuration using DIP switches.
Water scarcity is the lack of fresh water resources to meet the standard water demand. There are two type of water scarcity. One is physical. The other is economic water scarcity.
Courier management system project report.pdfKamal Acharya
It is now-a-days very important for the people to send or receive articles like imported furniture, electronic items, gifts, business goods and the like. People depend vastly on different transport systems which mostly use the manual way of receiving and delivering the articles. There is no way to track the articles till they are received and there is no way to let the customer know what happened in transit, once he booked some articles. In such a situation, we need a system which completely computerizes the cargo activities including time to time tracking of the articles sent. This need is fulfilled by Courier Management System software which is online software for the cargo management people that enables them to receive the goods from a source and send them to a required destination and track their status from time to time.
NO1 Uk best vashikaran specialist in delhi vashikaran baba near me online vas...Amil Baba Dawood bangali
Contact with Dawood Bhai Just call on +92322-6382012 and we'll help you. We'll solve all your problems within 12 to 24 hours and with 101% guarantee and with astrology systematic. If you want to take any personal or professional advice then also you can call us on +92322-6382012 , ONLINE LOVE PROBLEM & Other all types of Daily Life Problem's.Then CALL or WHATSAPP us on +92322-6382012 and Get all these problems solutions here by Amil Baba DAWOOD BANGALI
#vashikaranspecialist #astrologer #palmistry #amliyaat #taweez #manpasandshadi #horoscope #spiritual #lovelife #lovespell #marriagespell#aamilbabainpakistan #amilbabainkarachi #powerfullblackmagicspell #kalajadumantarspecialist #realamilbaba #AmilbabainPakistan #astrologerincanada #astrologerindubai #lovespellsmaster #kalajaduspecialist #lovespellsthatwork #aamilbabainlahore#blackmagicformarriage #aamilbaba #kalajadu #kalailam #taweez #wazifaexpert #jadumantar #vashikaranspecialist #astrologer #palmistry #amliyaat #taweez #manpasandshadi #horoscope #spiritual #lovelife #lovespell #marriagespell#aamilbabainpakistan #amilbabainkarachi #powerfullblackmagicspell #kalajadumantarspecialist #realamilbaba #AmilbabainPakistan #astrologerincanada #astrologerindubai #lovespellsmaster #kalajaduspecialist #lovespellsthatwork #aamilbabainlahore #blackmagicforlove #blackmagicformarriage #aamilbaba #kalajadu #kalailam #taweez #wazifaexpert #jadumantar #vashikaranspecialist #astrologer #palmistry #amliyaat #taweez #manpasandshadi #horoscope #spiritual #lovelife #lovespell #marriagespell#aamilbabainpakistan #amilbabainkarachi #powerfullblackmagicspell #kalajadumantarspecialist #realamilbaba #AmilbabainPakistan #astrologerincanada #astrologerindubai #lovespellsmaster #kalajaduspecialist #lovespellsthatwork #aamilbabainlahore #Amilbabainuk #amilbabainspain #amilbabaindubai #Amilbabainnorway #amilbabainkrachi #amilbabainlahore #amilbabaingujranwalan #amilbabainislamabad
Student information management system project report ii.pdfKamal Acharya
Our project explains about the student management. This project mainly explains the various actions related to student details. This project shows some ease in adding, editing and deleting the student details. It also provides a less time consuming process for viewing, adding, editing and deleting the marks of the students.
Saudi Arabia stands as a titan in the global energy landscape, renowned for its abundant oil and gas resources. It's the largest exporter of petroleum and holds some of the world's most significant reserves. Let's delve into the top 10 oil and gas projects shaping Saudi Arabia's energy future in 2024.
Industrial Training at Shahjalal Fertilizer Company Limited (SFCL)MdTanvirMahtab2
This presentation is about the working procedure of Shahjalal Fertilizer Company Limited (SFCL). A Govt. owned Company of Bangladesh Chemical Industries Corporation under Ministry of Industries.
Hybrid optimization of pumped hydro system and solar- Engr. Abdul-Azeez.pdffxintegritypublishin
Advancements in technology unveil a myriad of electrical and electronic breakthroughs geared towards efficiently harnessing limited resources to meet human energy demands. The optimization of hybrid solar PV panels and pumped hydro energy supply systems plays a pivotal role in utilizing natural resources effectively. This initiative not only benefits humanity but also fosters environmental sustainability. The study investigated the design optimization of these hybrid systems, focusing on understanding solar radiation patterns, identifying geographical influences on solar radiation, formulating a mathematical model for system optimization, and determining the optimal configuration of PV panels and pumped hydro storage. Through a comparative analysis approach and eight weeks of data collection, the study addressed key research questions related to solar radiation patterns and optimal system design. The findings highlighted regions with heightened solar radiation levels, showcasing substantial potential for power generation and emphasizing the system's efficiency. Optimizing system design significantly boosted power generation, promoted renewable energy utilization, and enhanced energy storage capacity. The study underscored the benefits of optimizing hybrid solar PV panels and pumped hydro energy supply systems for sustainable energy usage. Optimizing the design of solar PV panels and pumped hydro energy supply systems as examined across diverse climatic conditions in a developing country, not only enhances power generation but also improves the integration of renewable energy sources and boosts energy storage capacities, particularly beneficial for less economically prosperous regions. Additionally, the study provides valuable insights for advancing energy research in economically viable areas. Recommendations included conducting site-specific assessments, utilizing advanced modeling tools, implementing regular maintenance protocols, and enhancing communication among system components.
Cosmetic shop management system project report.pdfKamal Acharya
Buying new cosmetic products is difficult. It can even be scary for those who have sensitive skin and are prone to skin trouble. The information needed to alleviate this problem is on the back of each product, but it's thought to interpret those ingredient lists unless you have a background in chemistry.
Instead of buying and hoping for the best, we can use data science to help us predict which products may be good fits for us. It includes various function programs to do the above mentioned tasks.
Data file handling has been effectively used in the program.
The automated cosmetic shop management system should deal with the automation of general workflow and administration process of the shop. The main processes of the system focus on customer's request where the system is able to search the most appropriate products and deliver it to the customers. It should help the employees to quickly identify the list of cosmetic product that have reached the minimum quantity and also keep a track of expired date for each cosmetic product. It should help the employees to find the rack number in which the product is placed.It is also Faster and more efficient way.
TECHNICAL TRAINING MANUAL GENERAL FAMILIARIZATION COURSEDuvanRamosGarzon1
AIRCRAFT GENERAL
The Single Aisle is the most advanced family aircraft in service today, with fly-by-wire flight controls.
The A318, A319, A320 and A321 are twin-engine subsonic medium range aircraft.
The family offers a choice of engines
1. Koya university
faculty of engineering
Chemical engineering department
thermodynamics
Boyle’s Law: Pressure-Volume Relationship in Gases
2022-2023
Prepared by : supervised by:
Dima Jawhar Mustafa Mr. Ribwar Krmanj
Mr. Rebwar Abrahim
Experiment date : 19/oct./2022 Submitting date : / /
2. Boyle’s Law: Pressure-Volume Relationship in Gases
2
Table of Contents
Purpose of experiment : ................................................................................................................................3
Introduction:..................................................................................................................................................3
WL 102 description : ....................................................................................................................................4
Theoretical ....................................................................................................................................................6
Observations : Experiment type : Isothermic expansion : ............................................................................8
Materials Required:...................................................................................................................................8
Table of reading and experiment data :...................................................................................................10
Discussion:..................................................................................................................................................11
References :.................................................................................................................................................13
3. Boyle’s Law: Pressure-Volume Relationship in Gases
3
Purpose of experiment :
The primary objective of this experiment is to determine the relationship between the pressure and
volume of a confined gas. The gas we use will be air.
Introduction:
Robert Boyle discovered the volume and pressure of gasses are inversely proportionate when held at a
constant temperature in 1662.
The WL 102 machine is for demonstrating Boyle’s law and checking the state equation for ideal gases. It
clearly shows the relationship between change in volume and the associated change in pressure of an
enclosed gas. The gas that is used will be air, The sealing liquid works like a piston. It enlarges or reduces
the enclosed gas volume. The processes during the experiment are sufficiently slow to ensure isothermic
changes. a change occurs in the pressure exerted by the confined gas. This pressure change will be
monitored by using a sealing liquid that works like a piston. this can be compressed or expanded in a
perspex vessel. In this experiment the data that is collected will be from expending the gas (air) As an
alternative, during this experiment a fixed volume of air is expanded and the change in pressure plotted.
,It is assumed that temperature will be constant throughout the experiment. Pressure and volume data
pairs will be collected during this experiment and then analyzed. From the data and graph, you should be
able to determine what kind of mathematical relationship exists if it is inverse or direct between the
pressure and volume of the confined gas.
4. Boyle’s Law: Pressure-Volume Relationship in Gases
4
WL 102 description :
Unit Design and Function : WL 102 :
Figure-1 :The experiments on the WL 102 are performed in two different vessels. A liquid can be pumped
into a pressure cylinder (1) with the aid of a compressor. In this manner, the volume of air enclosed in the
cylinder is compressed.
The advantages of this technique are, firstly, the gastight sealing liquid which prevents losses through
leakages in air flow and, secondly, heat sink effect which contributes significantly toward isothermal
testing characteristics.
5. Boyle’s Law: Pressure-Volume Relationship in Gases
5
Displays for temperature, pressure and compressed volume (2) indicate the corresponding values
measured in the vessel. The selector switch (4) is used to switch between compression and expansion of
the air inside the pressure vessel. A switch (3) is used to turn on the compressor.
In a second, heatable cylinder (5), a closed, constant volume of air is heated and the resulting change in
pressure observed. The heater is activated with a switch (8).
A heater control (7) permits adjustment of the desired temperature by means of upward and downward
arrow keys and indicates the actual temperature. The parameter to be selected by pressing the upward and
downward arrow keys. Dynamically alteration of parameter to be made by pressing the key for as long as
the key is kept pressed. For manually taking over of entry the „P“ key to be pressed. After 2s the entry
will be automatically adopted.
For cancelling the entry the Exit/F key to be pressed. Change to the manual mode using function key
Exit/F (> 2s). Exit the manual mode using function key Exit/F (> 2s).
The resulting pressure inside the cylinder is indicated by a display (6). The experimental unit is switched
on and off using the main switch (9). On the rear of the unit is a USB port which can be used to connect
the unit to the PC via cable.
Figure-2:parts of WL 102.
6. Boyle’s Law: Pressure-Volume Relationship in Gases
6
Theoretical
In every gas there is a certain pressure. If the volume of an enclosed quantity of gas is reduced by
compression, this pressure increases. If the volume is increased, the pressure drops. Boyle’s law describes
this relationship:
p V const. = T = const.
The product of pressure and volume is constant. The two parameters are inversely proportional to each
other.
This law is, however, only applicable if the amount of gas and the temperature do not change.
During the performance of the experiments, the heat produced by the compression can produce erroneous
results. The experiment must therefore be performed sufficiently slowly that the temperature remains
constant. In this case the term isothermic change of state is used.
The value for the constant (p x V) represents, in formal terms, an energy parameter, the so-called internal
energy.
Strictly, Boyle’s law only applies for ideal gases. If noticeable deviations occur, the term real gas is used,
in the case of large deviations - vapour.
In the case of values for pressure and temperature in the range of normal conditions, e.g., air, hydrogen
and the noble gases behave like ideal gases, chlorine and carbon dioxide like real gases, propane and
butane like vapours.
A further relationship is described by the GayLussac law. This states that if a fixed quantity of gas is
contained in a constant volume, the pressure is proportional to the absolute temperature.
The combination of both laws leads to the general gas equation:
7. Boyle’s Law: Pressure-Volume Relationship in Gases
7
For a fixed quantity of gas, the expression
(p x V) / T always remains constant.
Figure-3: Pressure-Volume Relationship graph.
8. Boyle’s Law: Pressure-Volume Relationship in Gases
8
Observations : Experiment type : Isothermic expansion :
Materials Required:
1. WL 102
2. Sample experiment : Air
In this experiment, to check Boyle’s law a fixed quantity of gas of approx. 3 litre volume is compressed to
approx at a certain volume leave of the perspex vessel by filling the liquid to work as a piston. Then will
be observed as the gas (Air) will be expanded carefully, so that the Pressure and volume data pairs can be
collected during this experiment and then analyzed.
NOTICE
Risk of escape of the sealing liquid.
• Open the air discharge valve slowly.
• Carefully open the air discharge valve (10) on the lid of the pressure cylinder and release the
compressed air until ambient pressure is reached.
• Close the air discharge valve again.
• Open the needle valve (12) and set the required filling speed.
• Move the selector switch (4) to position B.
• Start the data acquisition program and make the corresponding settings.
• Turn on the compressor and expand the gas volume until the 3L mark on the vessel scale (11) is
reached.
• Open the graph of measured values and interpret.
• Carefully open the air discharge valve on the lid of the pressure cylinder and allow air to flow into
pressure cylinder until ambient pressure is reached.
Similar to the compression experiment, this experiment produces a comparable measured result.
9. Boyle’s Law: Pressure-Volume Relationship in Gases
9
Figure-4: graph from the collection data from the experiment.
10. Boyle’s Law: Pressure-Volume Relationship in Gases
10
Table of reading and experiment data :
Pressure (Bar) Volume(Air)- (L)
2.13 1.38
1.80 1.62
1.45 1.98
1.14 2.49
0.99 2.9
Figure-5: To confirm that an inverse relationship exists between pressure and volume, a graph of pressure vs.
reciprocal may also be plotted according to the experiment data.
11. Boyle’s Law: Pressure-Volume Relationship in Gases
11
Discussion:
1. Discuss if there will be any error in the experiment.
Error may happen in the experiment, thus the collection of the data may be different from the
standard information , They might come from: uncalibrated instruments (balances, etc.), impure
reagents, leaks, unaccounted temperature effects, biases in using equipment, mislabelled or
confusing scales, seeing hoped-for small effects, or pressure differences between barometer and
experiment caused by air conditioning.
2. Is there any deference between the compression exp. And expansion exp.?
compression exp.1 :
the exp. Sample (gas/Air) will behave on room pressure ,carefully increasing pressure as the
liquid level in the perspex vessel which acts like a piston will rise with each mL level ,the
pressure is controlled and then observing the volume of the the sample so as the data is collected.
Explanation exp.2 :
the exp. Sample (gas/Air) will already be compromised in the perspex vessel the liquid level will
be at a high level before starting the exp. Carefully the liquid will be decreased, the volume of
the air will be controlled at certain times because of the liquid which acted like a piston in the
first exp. So that the pressure is observed then data will be collected.
3. What experimental factors are assumed to be constant in this experiment and why?
It is assumed that temperature will be constant throughout the experiment. Pressure and volume
data pairs will be collected during this experiment and then analyzed.
4. What does the table of reading and experiment data shows ?
As The volume of the Air increases the pressure decrease.
5. To confirm that an inverse relationship exists between pressure and volume, a graph of pressure
vs. reciprocal of volume may also be plotted.
It is shown in Figure-5.
6. What’s the conclusion of the experiments, what do they achieve?
If the volume of the gas decreases, the pressure of the gas increases. If the volume of the gas
increases, the pressure decreases. These results support Boyle's law.
12. Boyle’s Law: Pressure-Volume Relationship in Gases
12
7. why is boyle's law important?
Boyle's law is significant because it explains how gases behave. It proves beyond a shadow of a
doubt that gas pressure and volume are inversely proportional. When you apply pressure on a gas,
the volume shrinks and the pressure rises.
This expression can be obtained from the pressure-volume relationship suggested by Boyle’s law.
For a fixed amount of gas kept at a constant temperature, PV = k, P1V1 = P2V2
8. Discuss Different Boyle’s law applications in real life.
Spray paint, Soda bottle, Diving into deep water…etc.
13. Boyle’s Law: Pressure-Volume Relationship in Gases
13
References :
1. Wengert, H., 1969. A Different Approach to the Study of Pressure-Volume Relationship of
Gases. Iowa Science Teachers Journal, 6(4), pp.19-22. [accessed : 27/oct/2022]
2. Levitt, L.S., 1954. Extreme Pressures. I. A New Pressure–Volume Relationship. The Journal
of Physical Chemistry, 58(7), pp.573-576. [accessed : 27/oct/2022]
3. Potter, E., 2001. Gender and Boyle's law of gases. Indiana University Press.
4. Learn, W.Y.L., 2009. Gases. [accessed : 27/oct/2022]
5. Harris, D.J., O'Boyle, M., Bates, E. and Buckley, C., 2014. Harris, O'Boyle & Warbrick: Law
of the European convention on human rights. Oxford University Press, USA. [accessed :
27/oct/2022]
6. McGregor, D., Sweeney, W.V. and Mills, P., 2012. A Simple Mercury-Free Laboratory
Apparatus To Study the Relationship between Pressure, Volume, and Temperature in a
Gas. Journal of Chemical Education, 89(4), pp.509-512. [accessed :27/oct/2022]
7. Laugier, A. and Garai, J., 2007. Derivation of the ideal gas law. Journal of Chemical
Education, 84(11), p.1832. . [accessed :27/oct/2022]
8. Kenny, B.J. and Ponichtera, K., 2021. Physiology, Boyle's Law. In StatPearls [Internet].
StatPearls Publishing. [accessed :27/oct/2022]