Download as PDF, PPTX


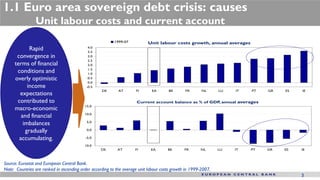

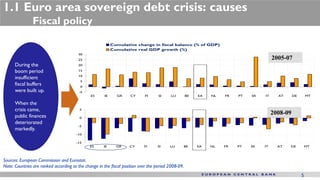


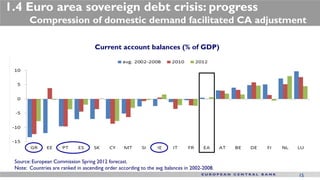


The document discusses the euro area sovereign debt crisis and lessons learned from the Baltic states' experience, highlighting causes such as macroeconomic imbalances and ineffective fiscal policies. It emphasizes the importance of structural reforms, fiscal consolidation, and national ownership of reforms for successful economic adjustment. Lastly, it outlines challenges for Latvia to ensure sustainable convergence and its readiness for euro adoption.


