
Download to read offline
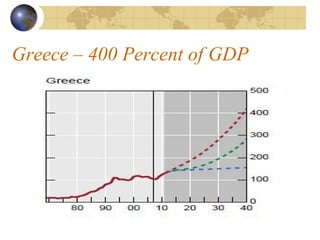
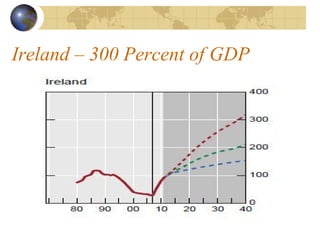
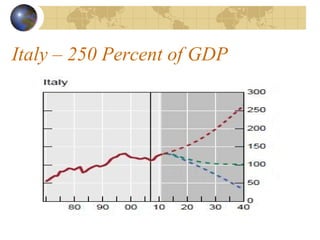
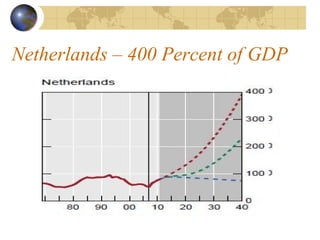
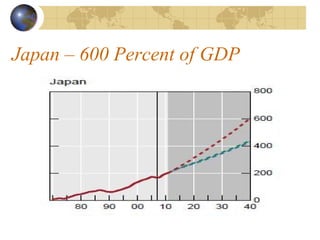
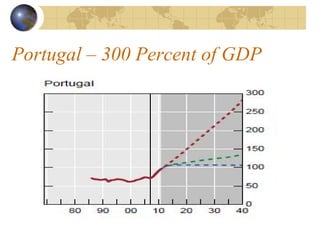
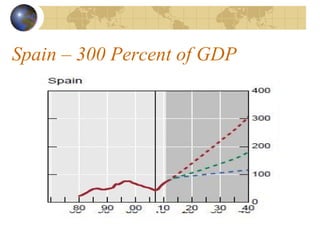
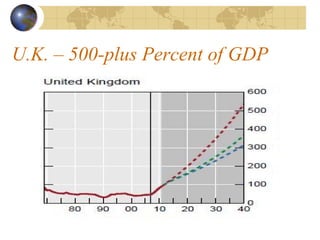
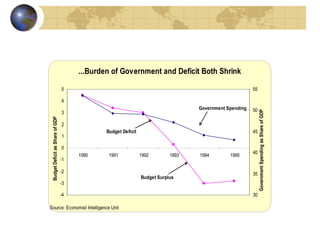
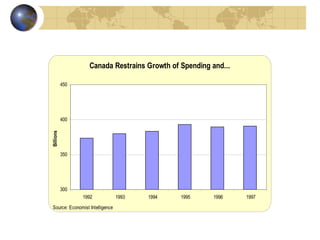
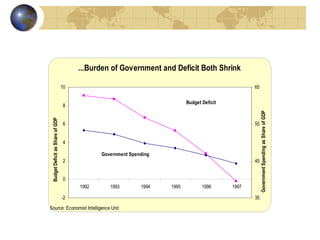
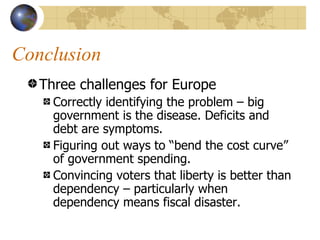
The document argues that Europe's economic challenges stem from excessive taxation and spending by various nations rather than a singular 'European' issue. It criticizes proposals for tax harmonization and fiscal union as likely to worsen the situation, advocating instead for spending restraint to promote economic growth. The author cites historical examples to support the notion that countries can achieve fiscal balance by controlling government expenditure relative to GDP.


![Presentation on update of macroeconomic framework for negotiations 2[1]](https://cdn.slidesharecdn.com/ss_thumbnails/presentationonupdateofmacroeconomicframeworkfornegotiations21-130812212223-phpapp01-thumbnail.jpg?width=640&height=640&fit=bounds)


