Download to read offline
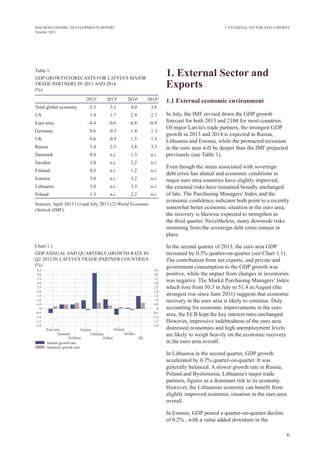


The document provides a macroeconomic developments report for October 2013. It summarizes developments in Latvia's external sector and exports in the second quarter of 2013. Key points include: - Latvia's exports continued to grow but at a slower annual rate due to weakening demand from major trade partners. Exports of base metals declined due to a factory closure. - Imports declined in both volume and value as production and investment activity decreased. Imports of base metals and vehicles fell the most. - Despite challenges, Latvia increased its share of world imports according to WTO data. The report examines economic conditions in Latvia's key trade partners.


