Download to read offline


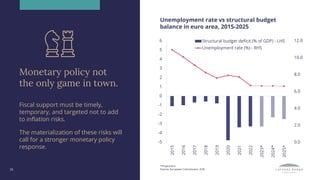


The document discusses the current economic conditions in the euro area, highlighting strong labor markets and persistent core inflation despite falling headline inflation. It emphasizes the need for further monetary policy tightening to manage inflation, cautioning that the financial stability risks remain contained. Additionally, it outlines the expectations for moderate growth rebound and stresses the importance of timely and targeted fiscal support without exacerbating inflationary pressures.


