Download as PDF, PPTX

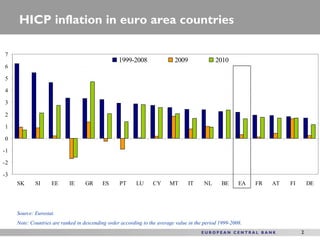
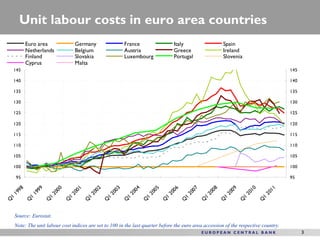
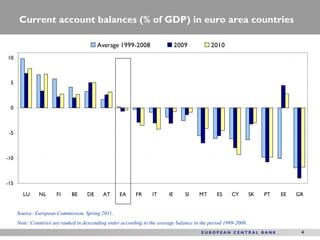
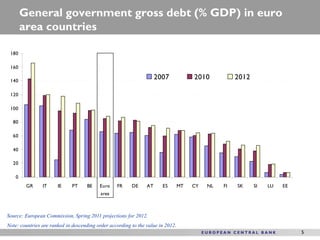
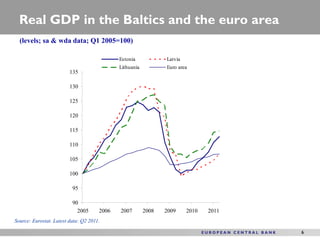
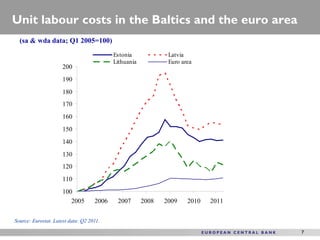
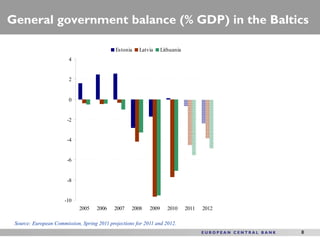
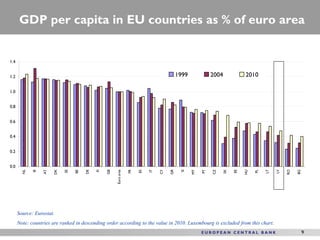
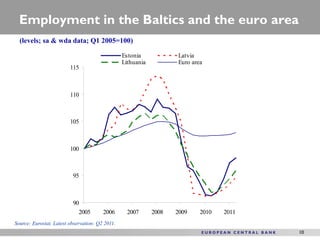

The document presents an analysis of economic adjustments in the Euro area, particularly focusing on inflation, unit labor costs, current account balances, and government debt across different countries from 1999 to 2011. It highlights trends in Baltic states compared to the Euro area, including GDP growth, labor costs, and government balances. Data is sourced from Eurostat and the European Commission and is illustrated through various charts and rankings.


