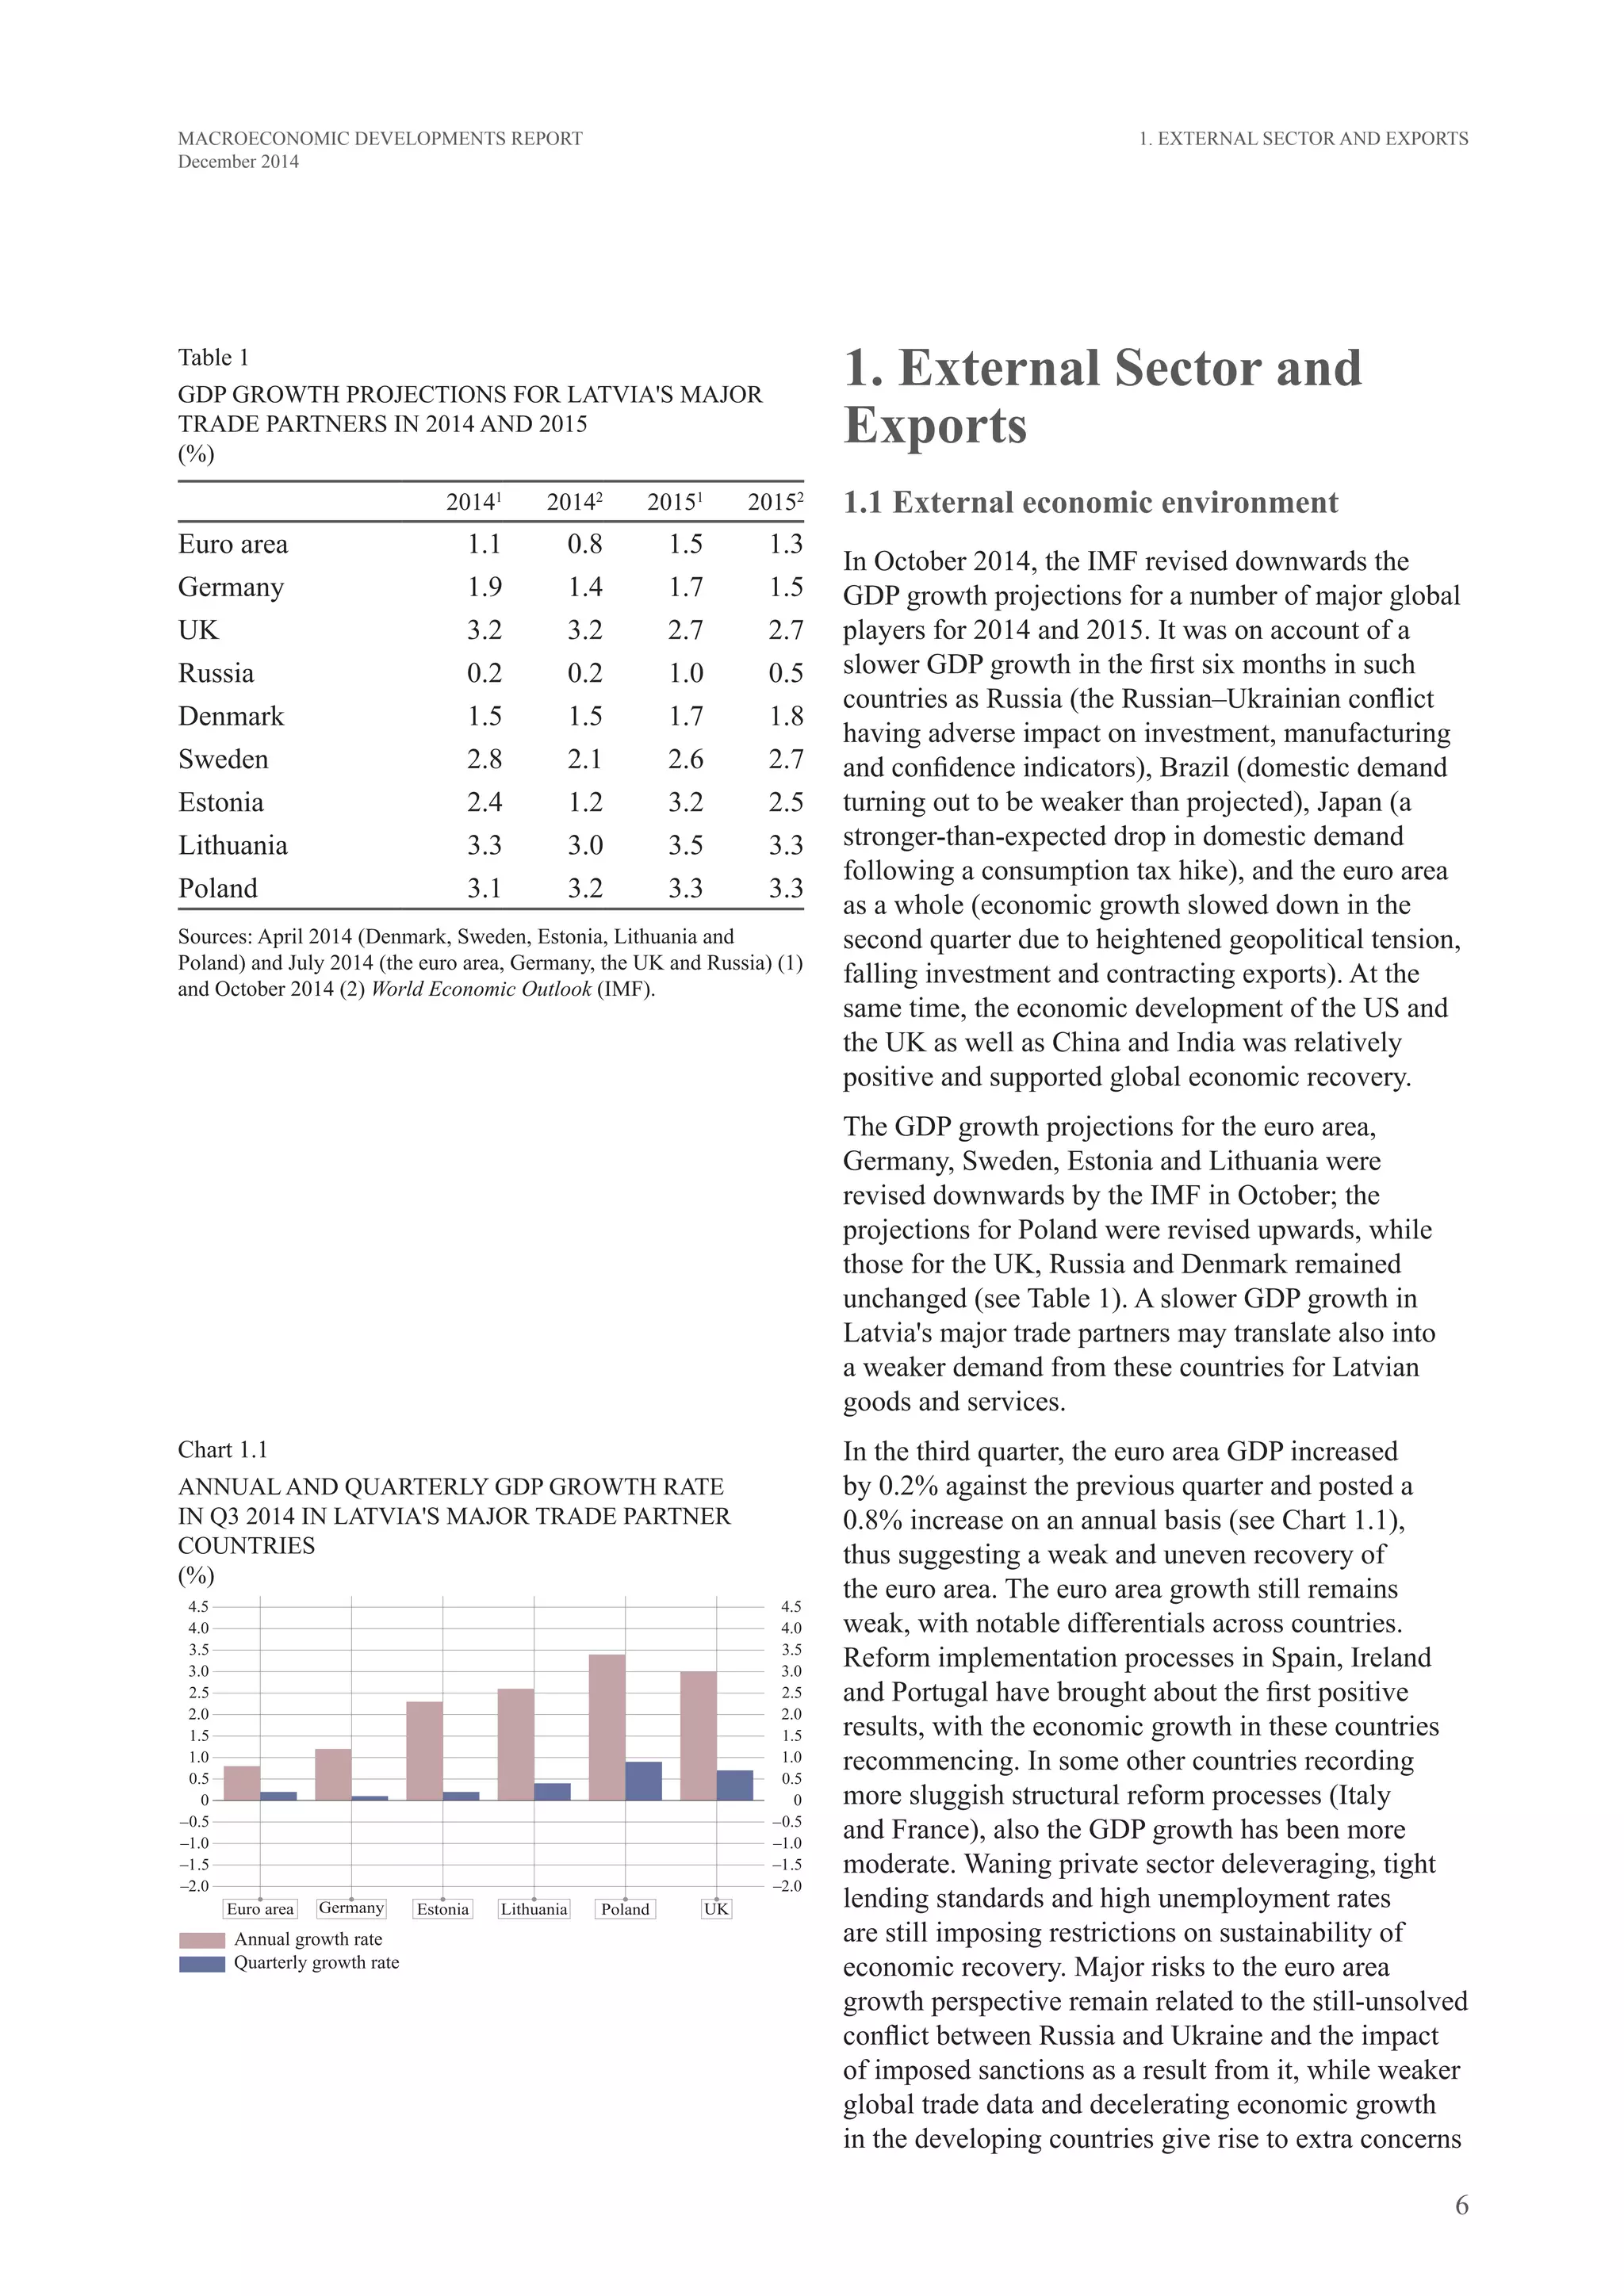
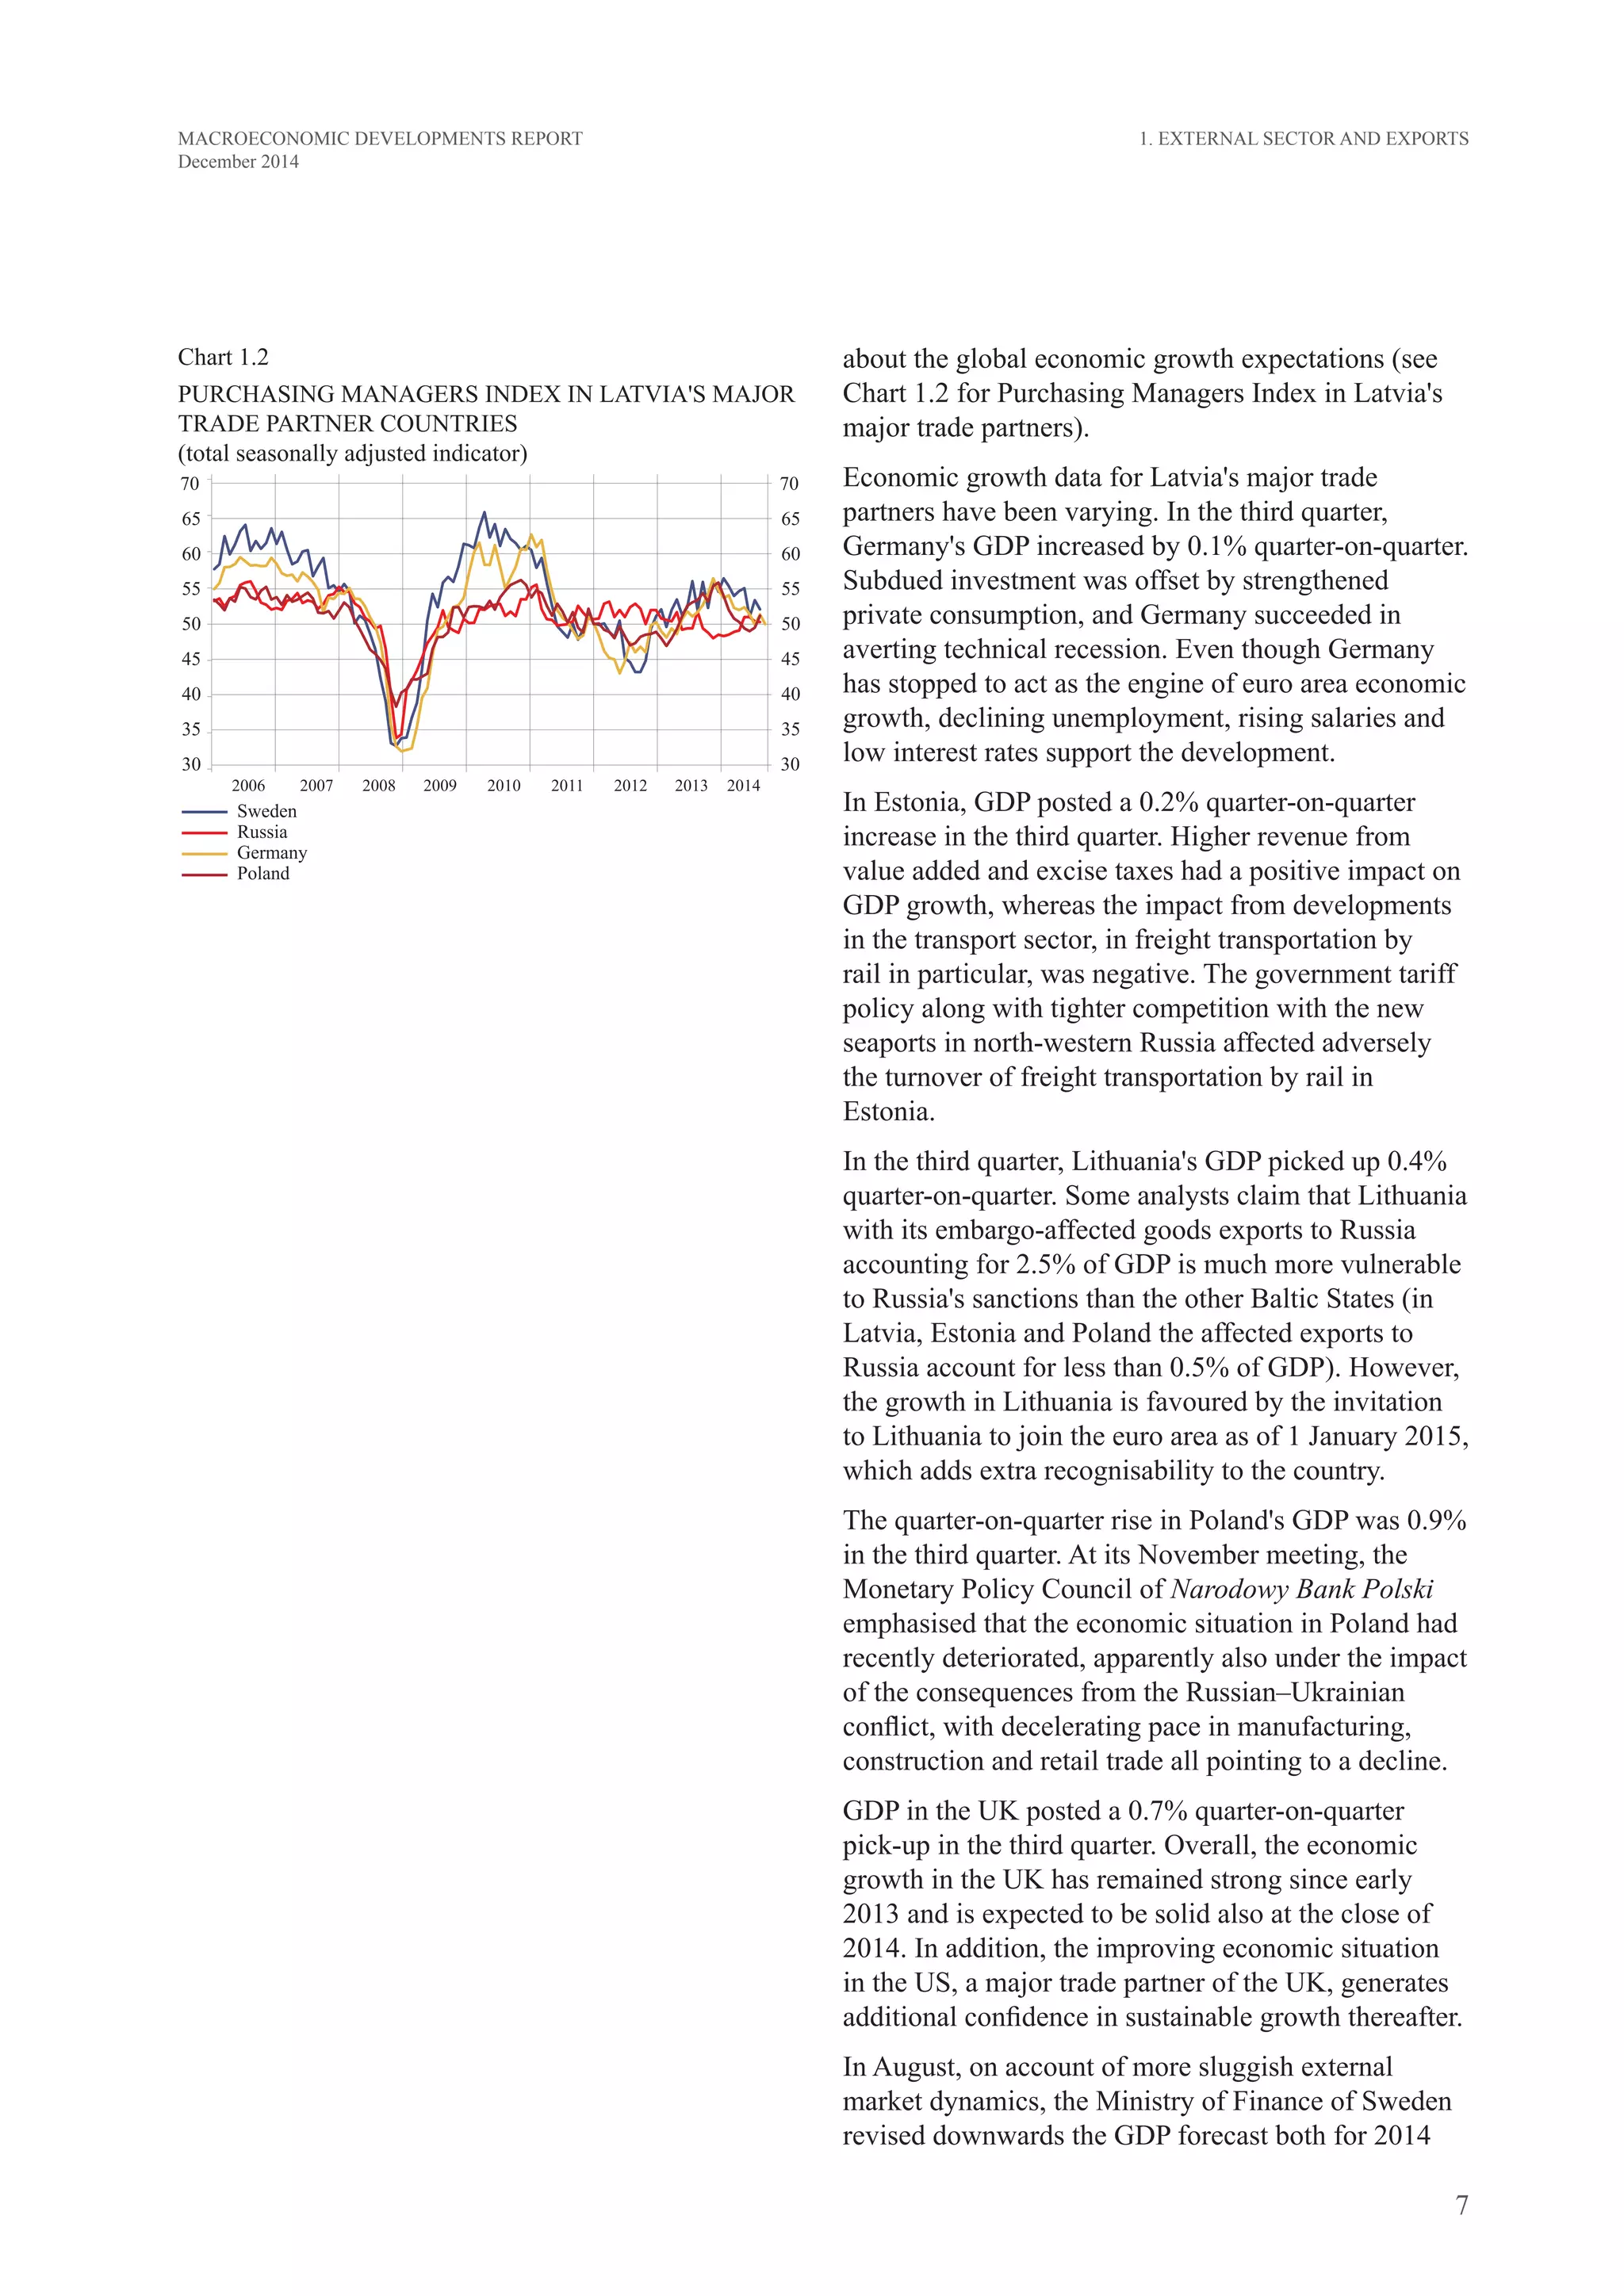
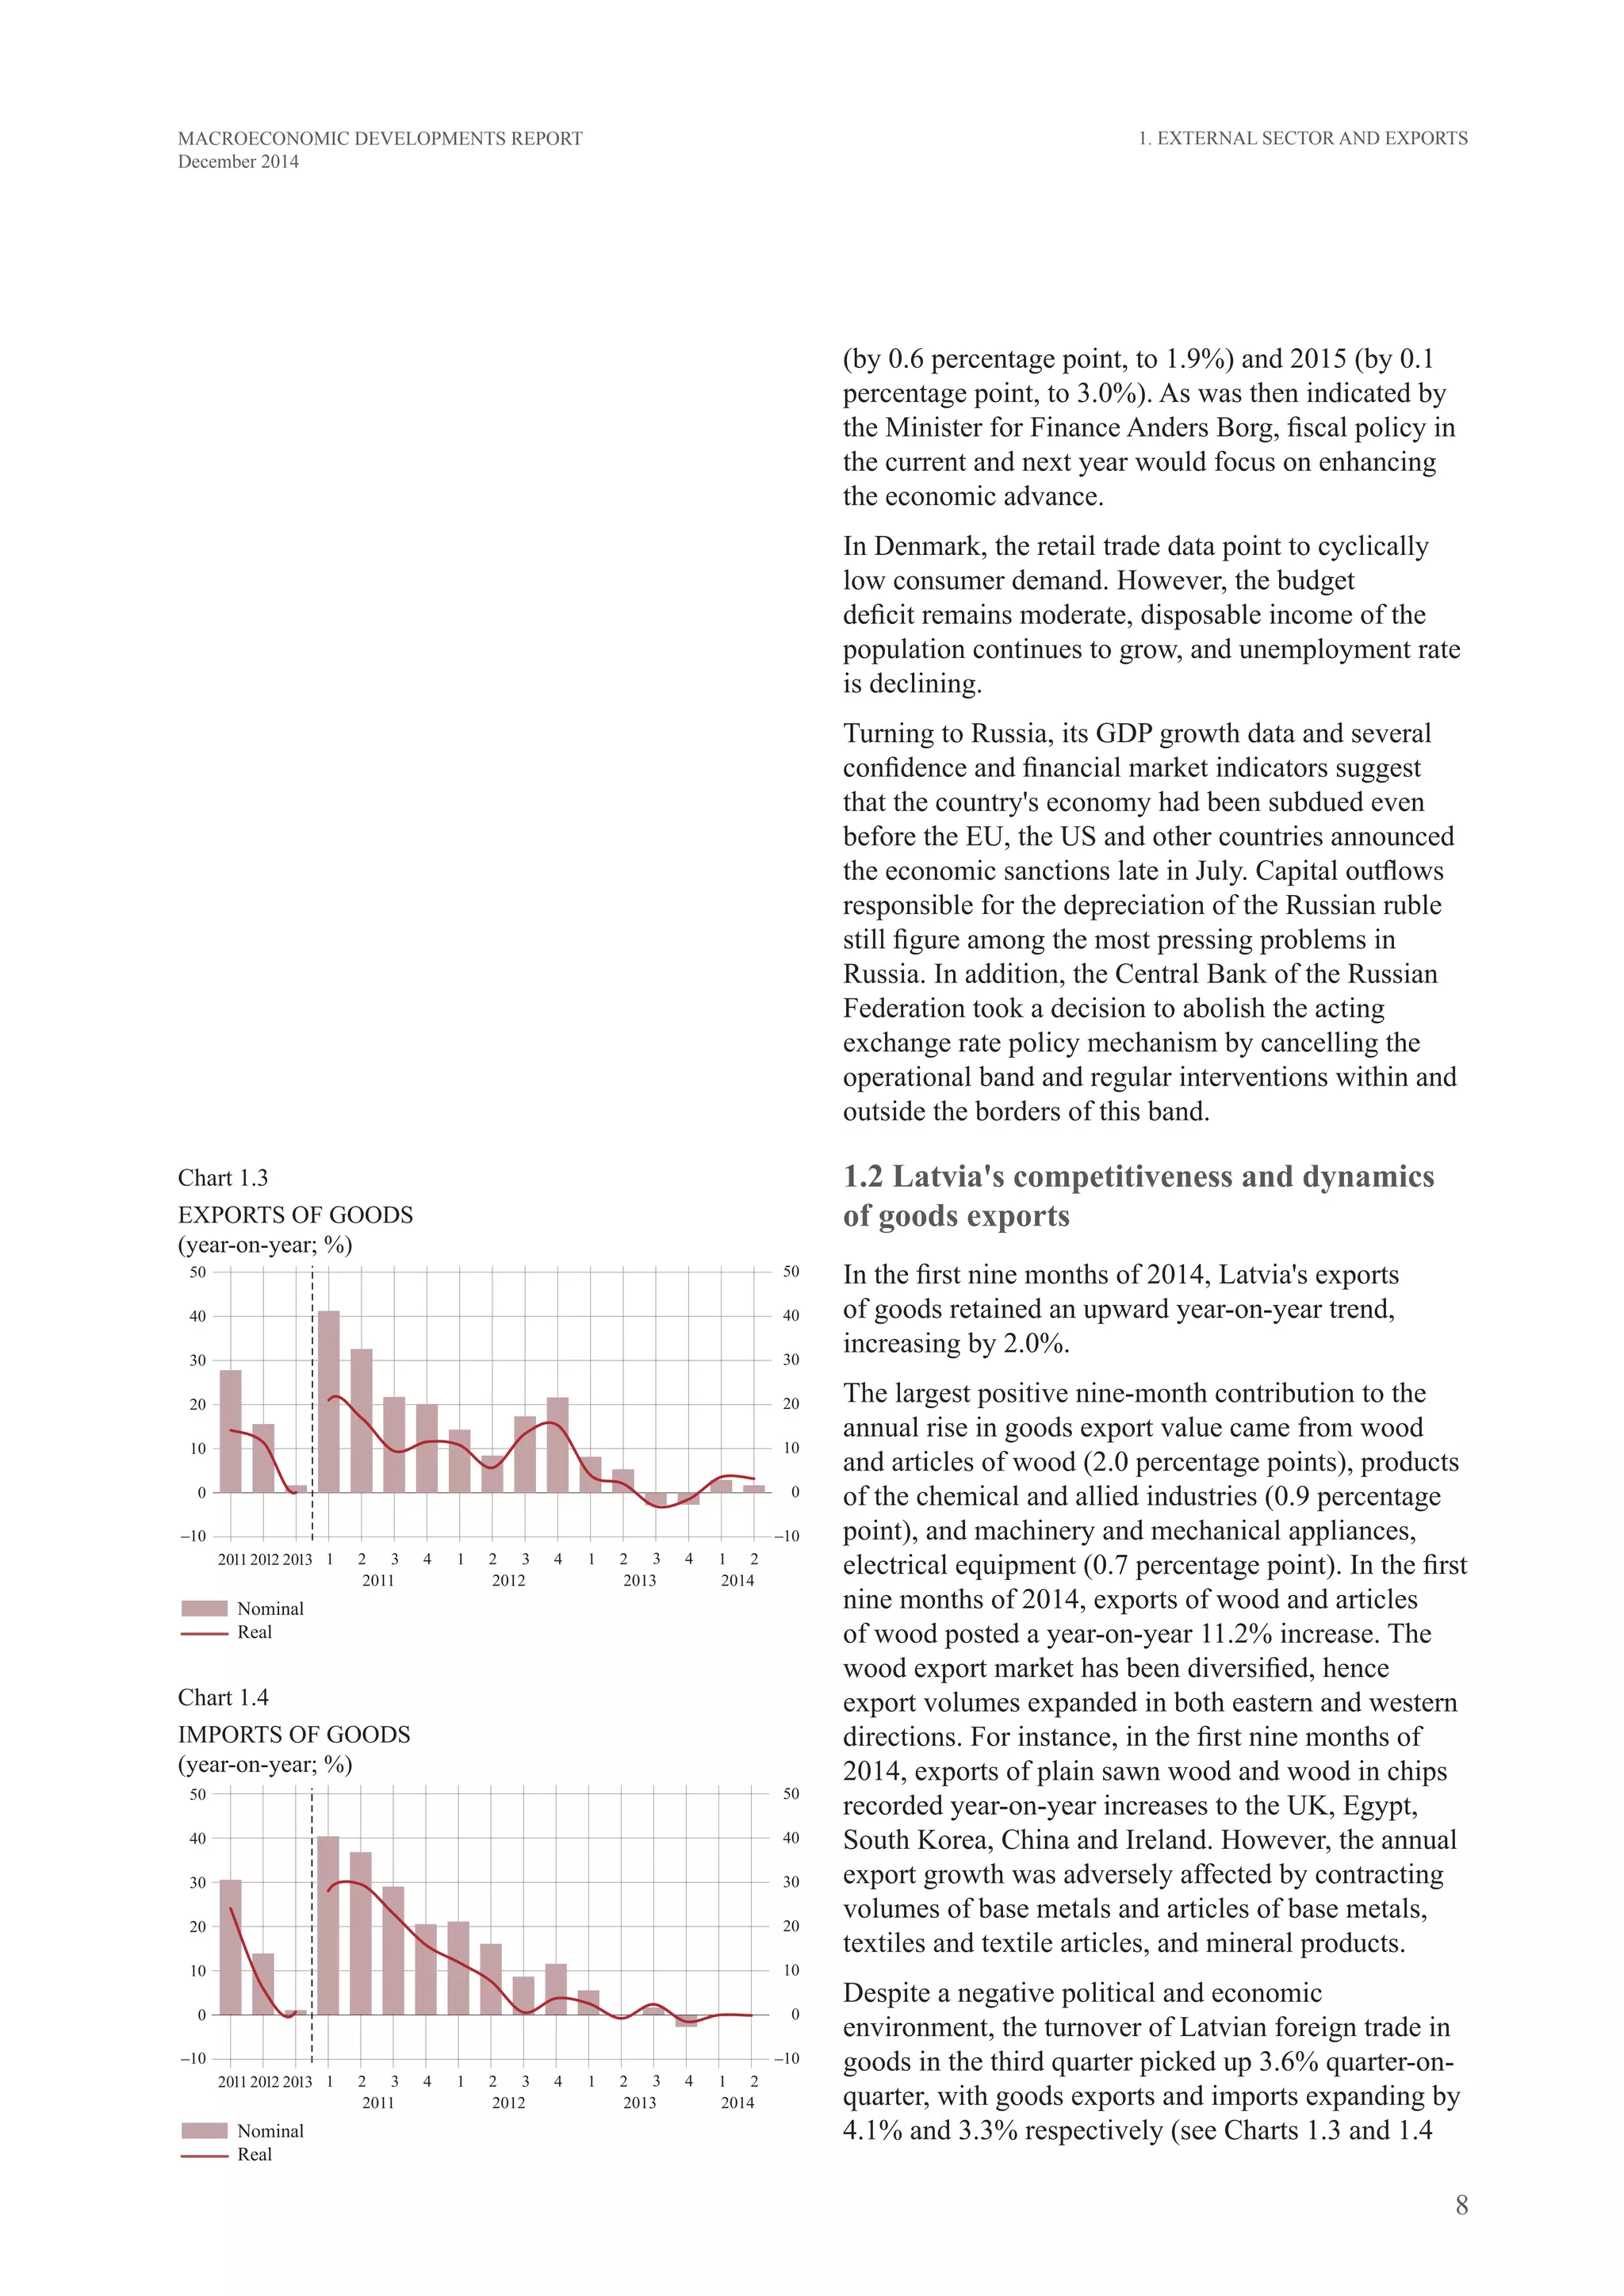
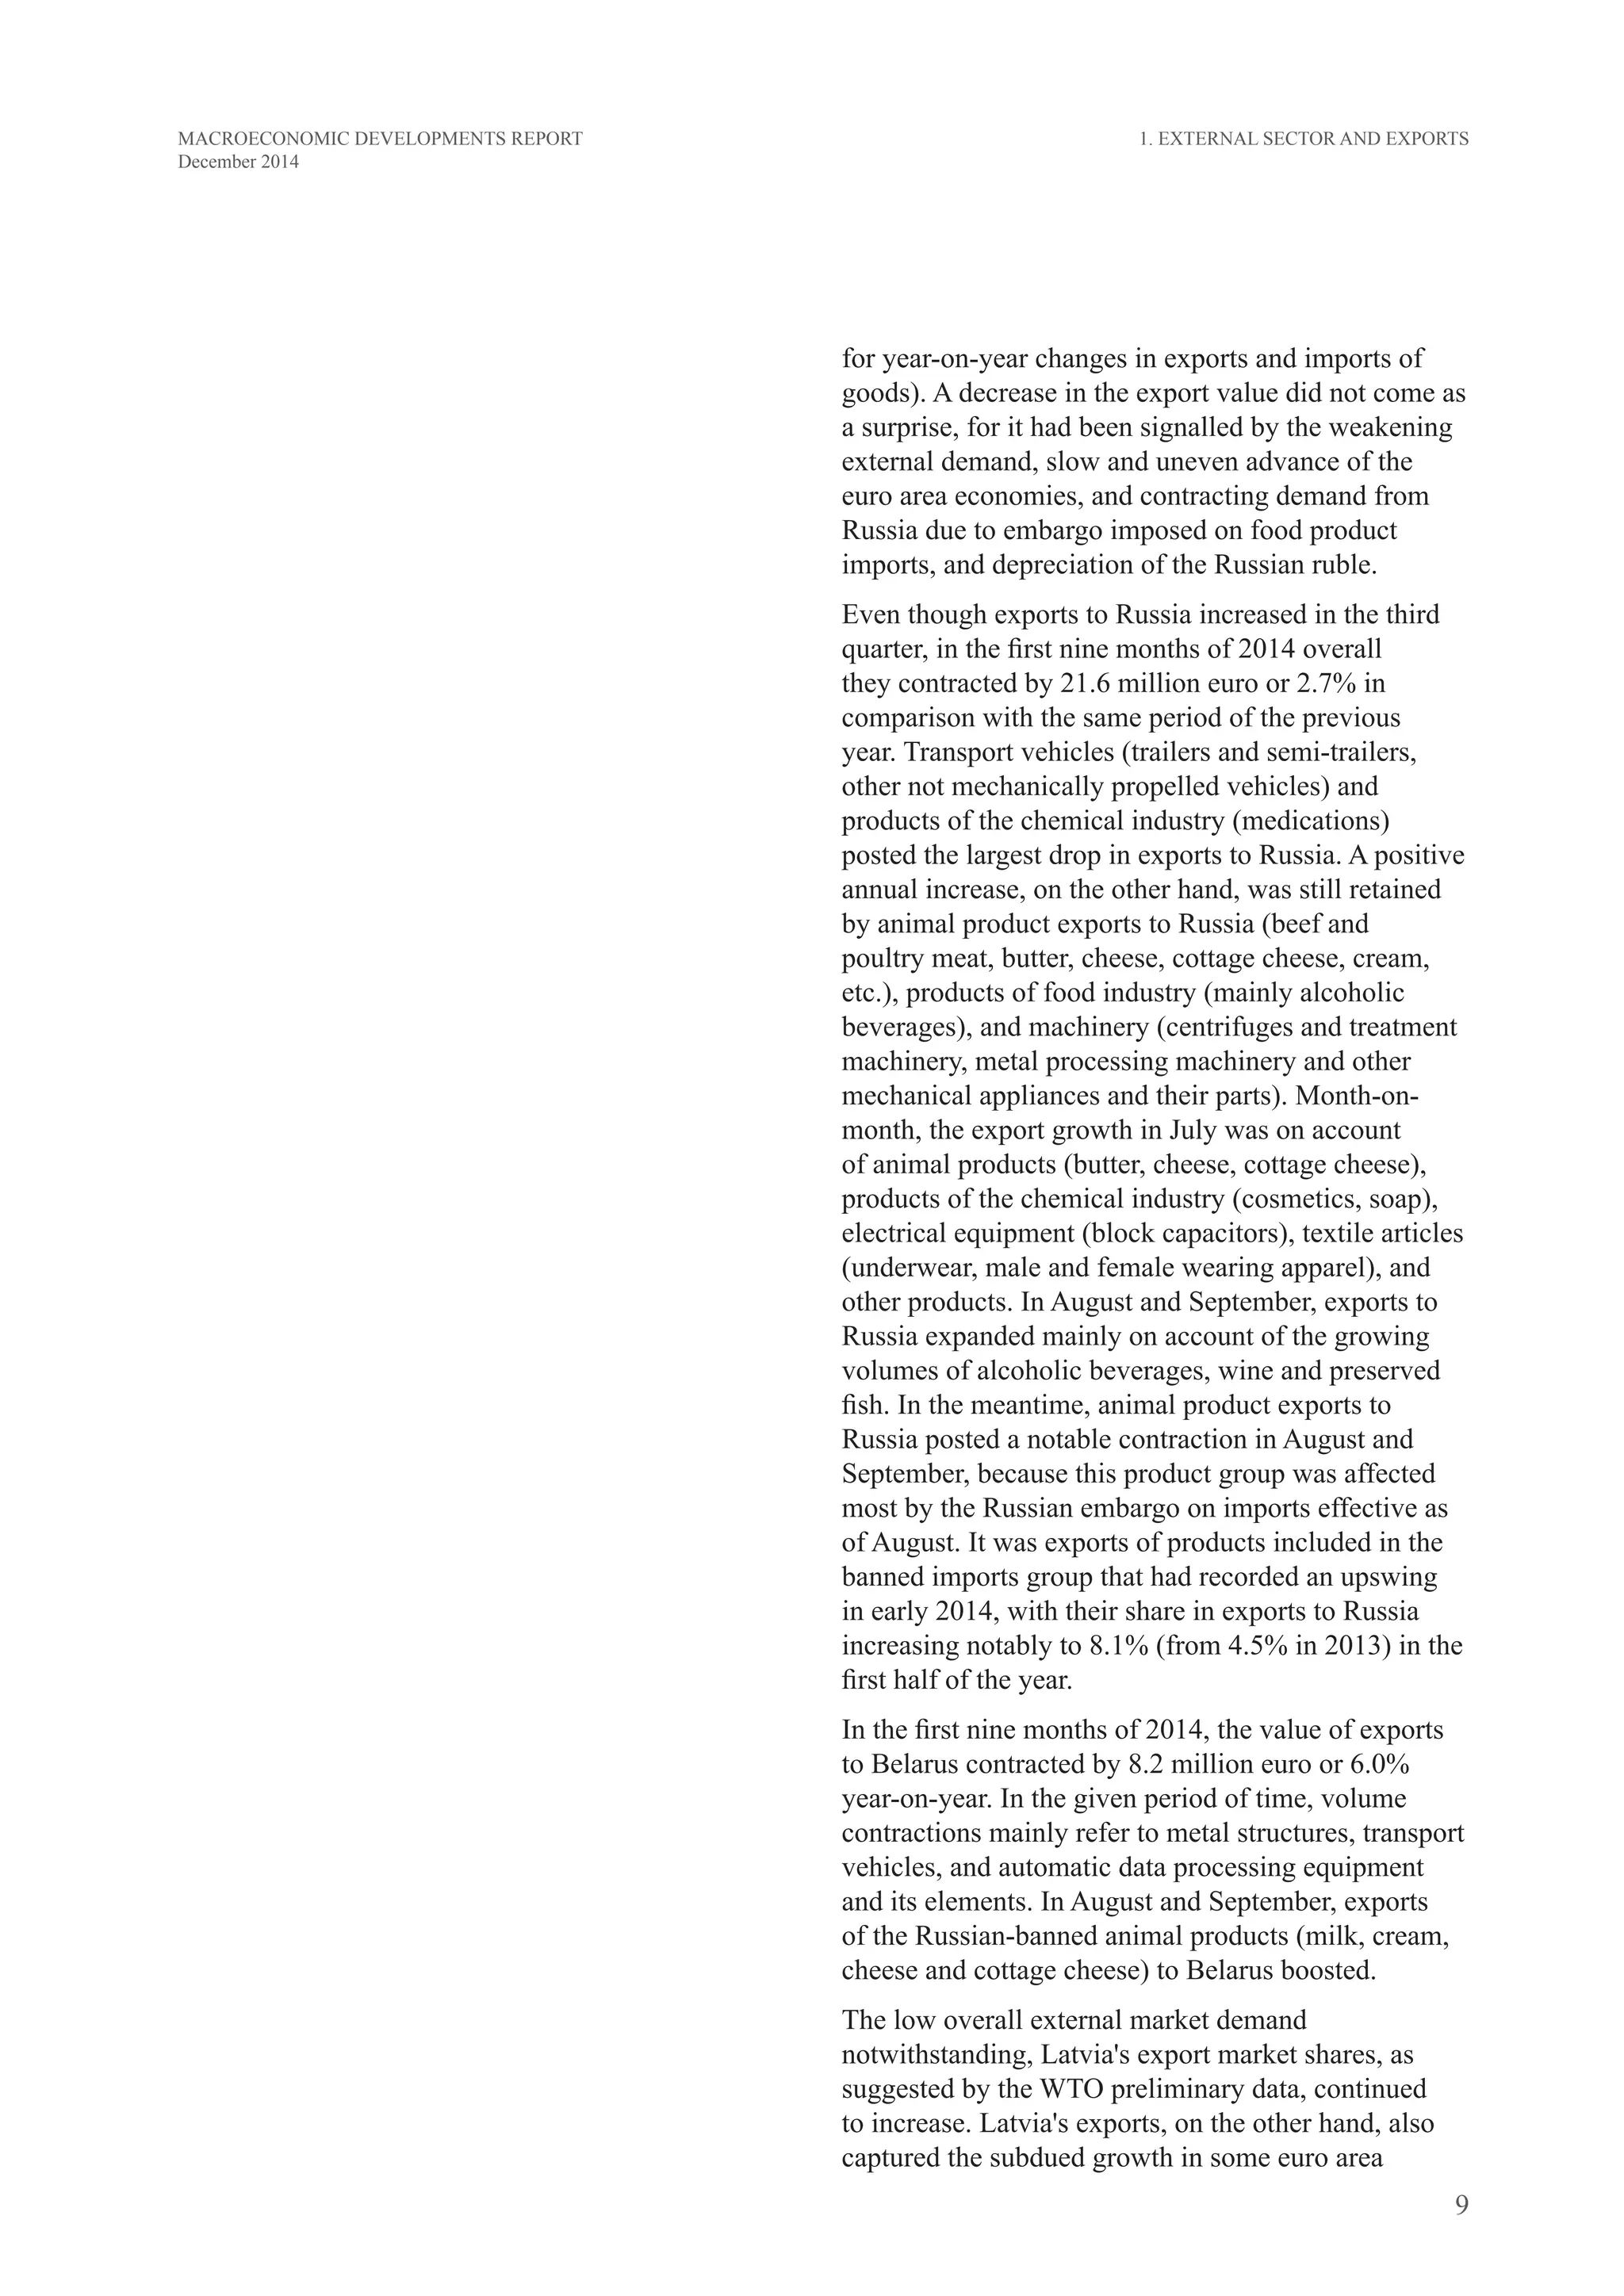
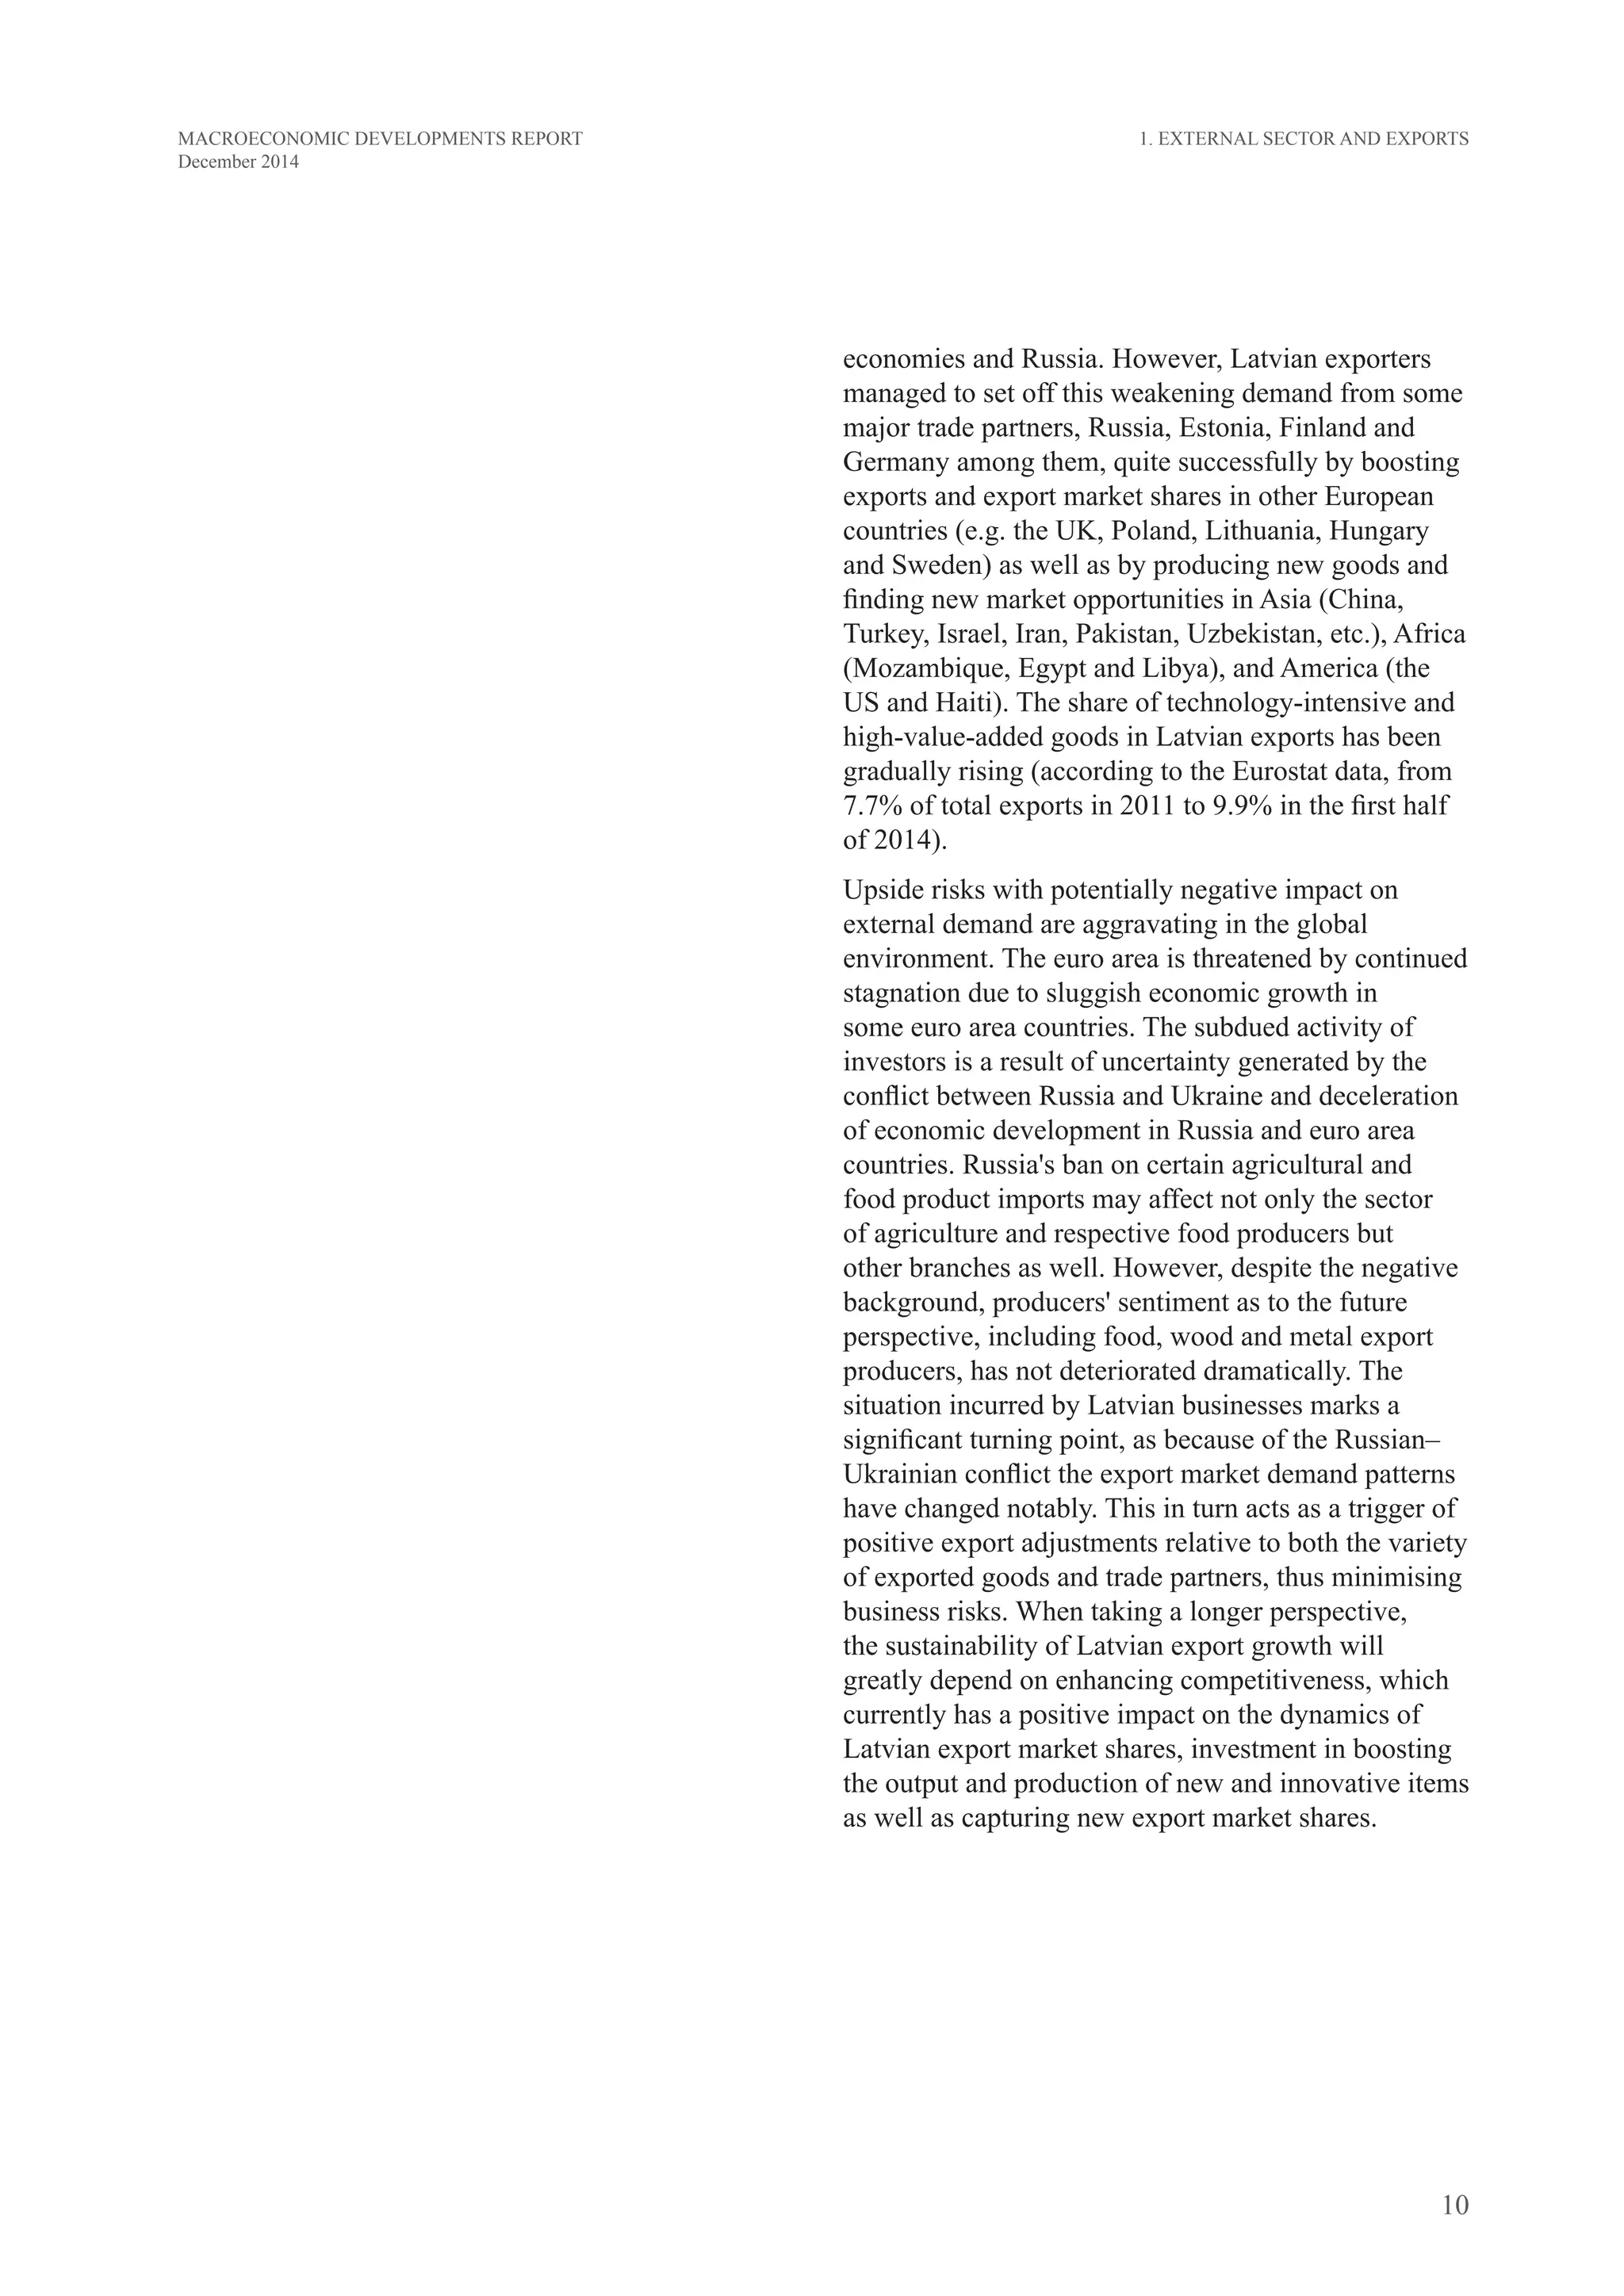
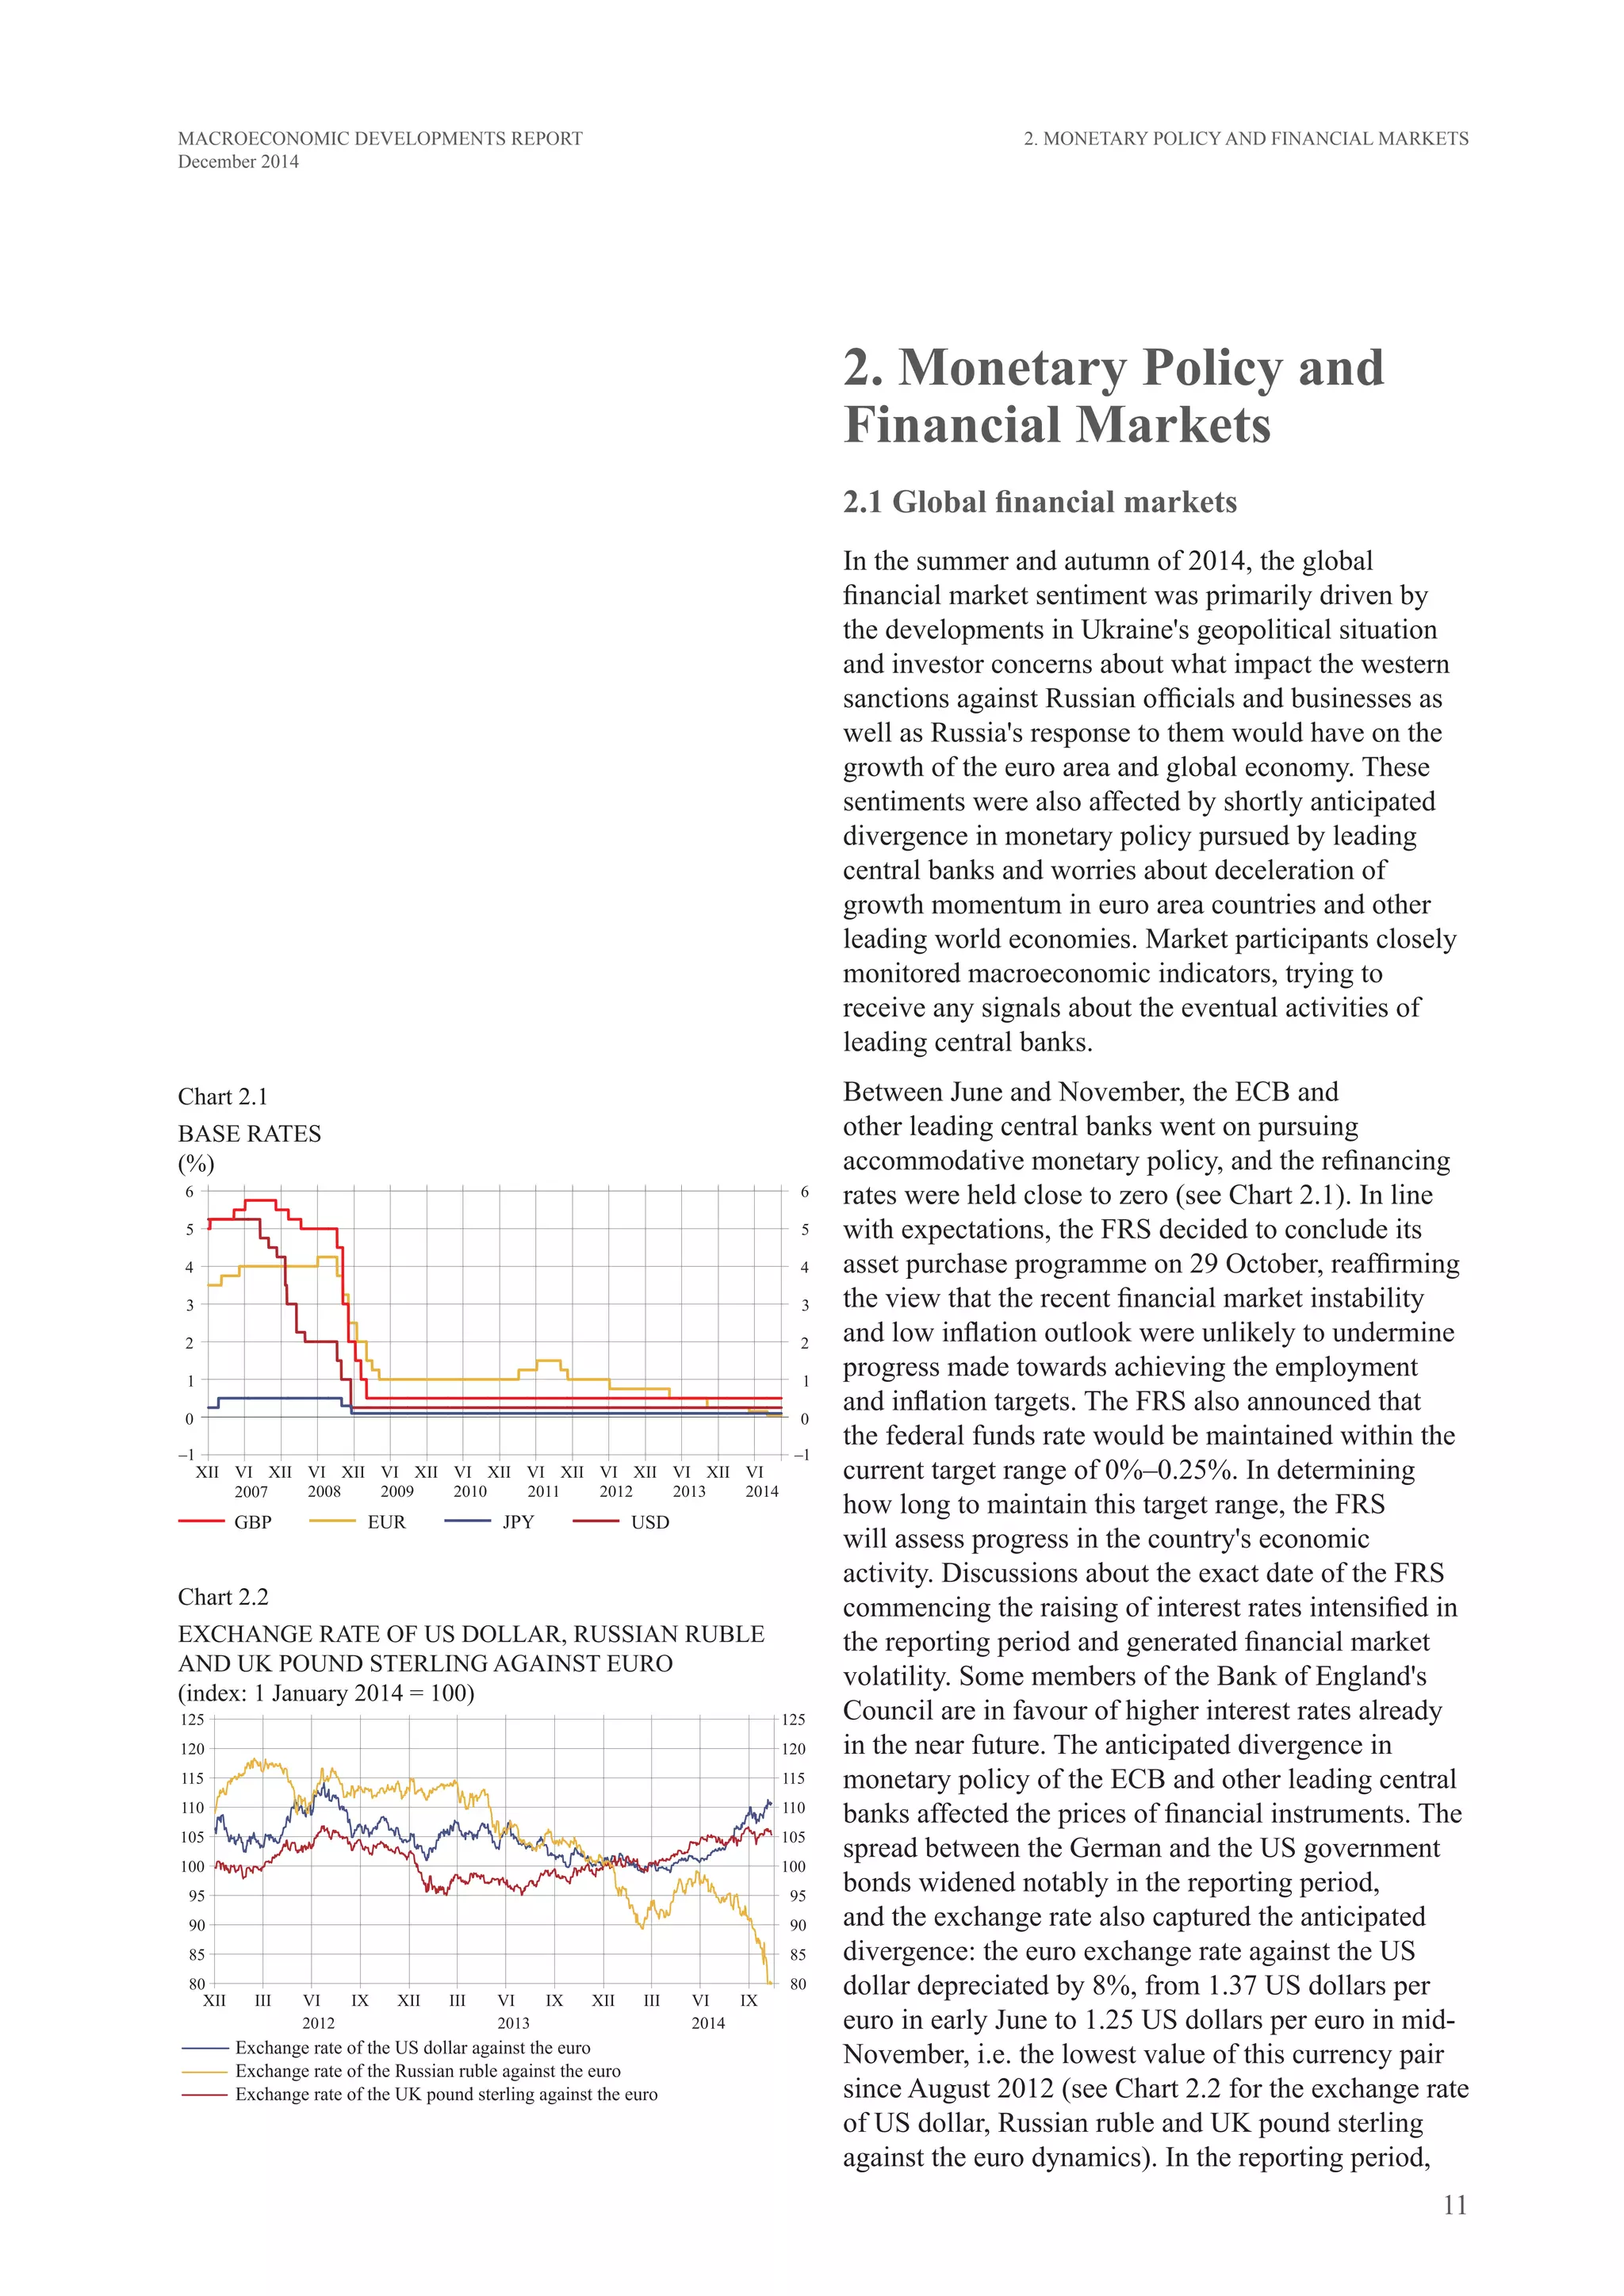
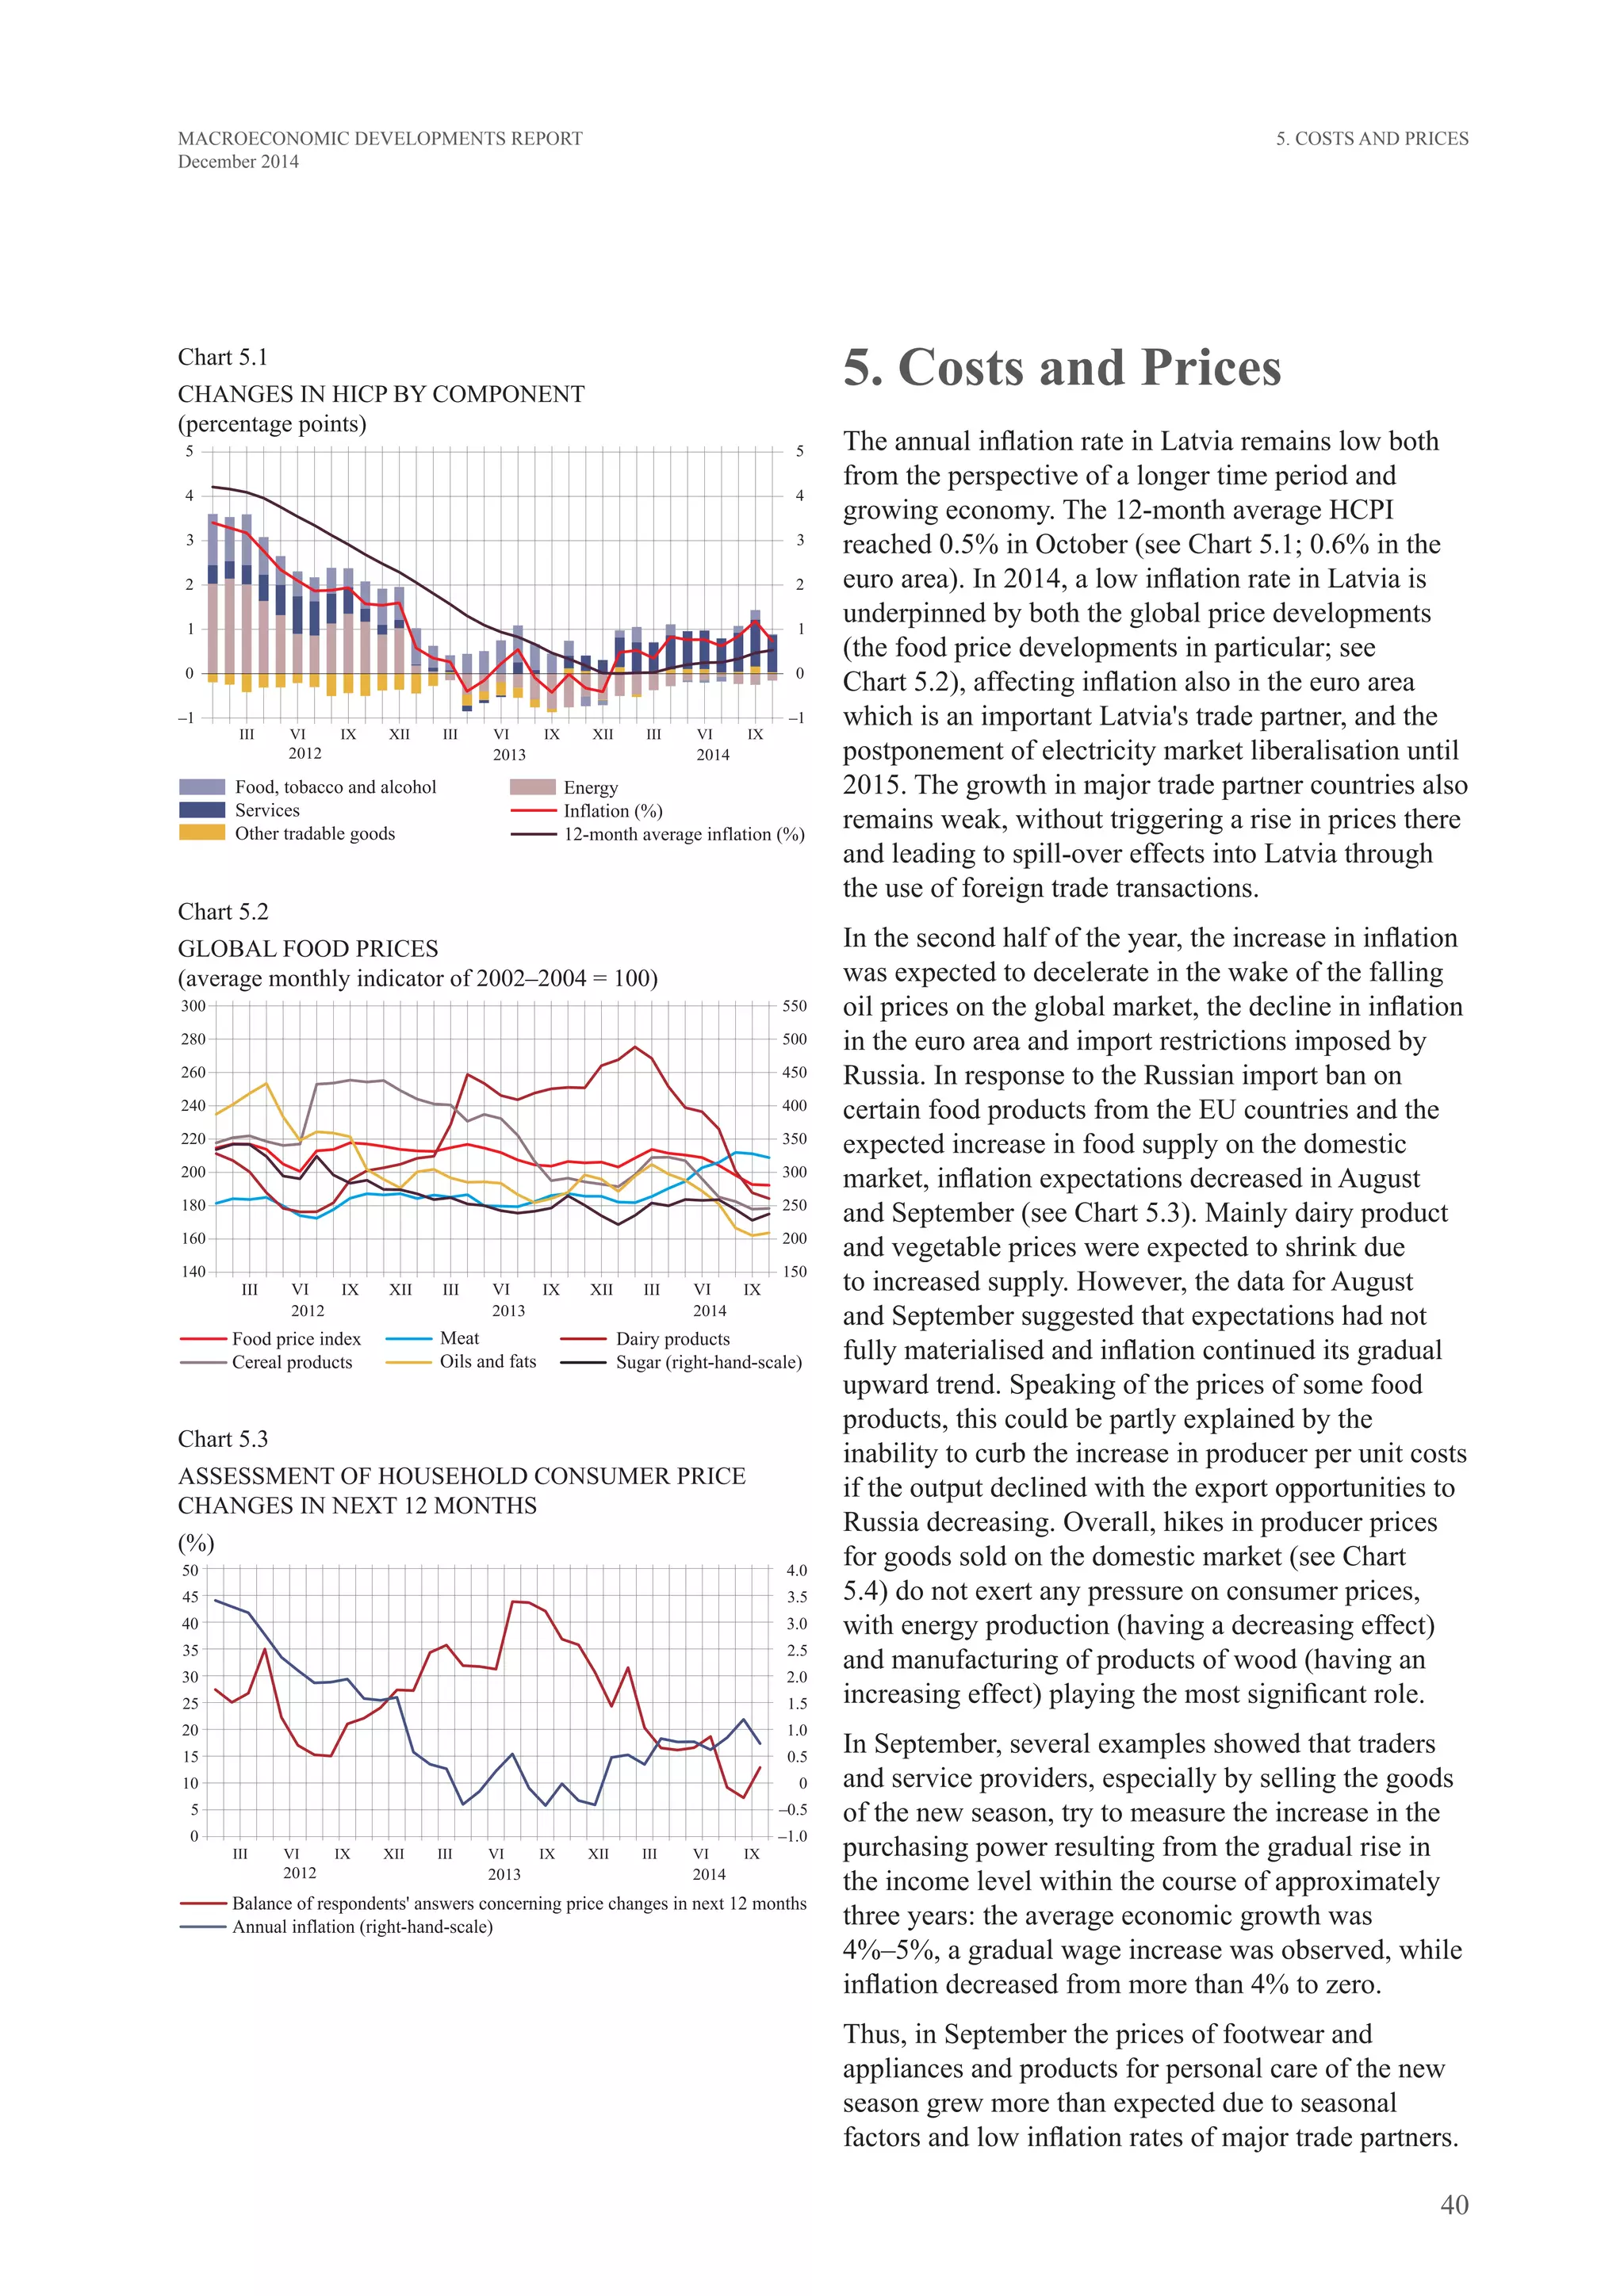
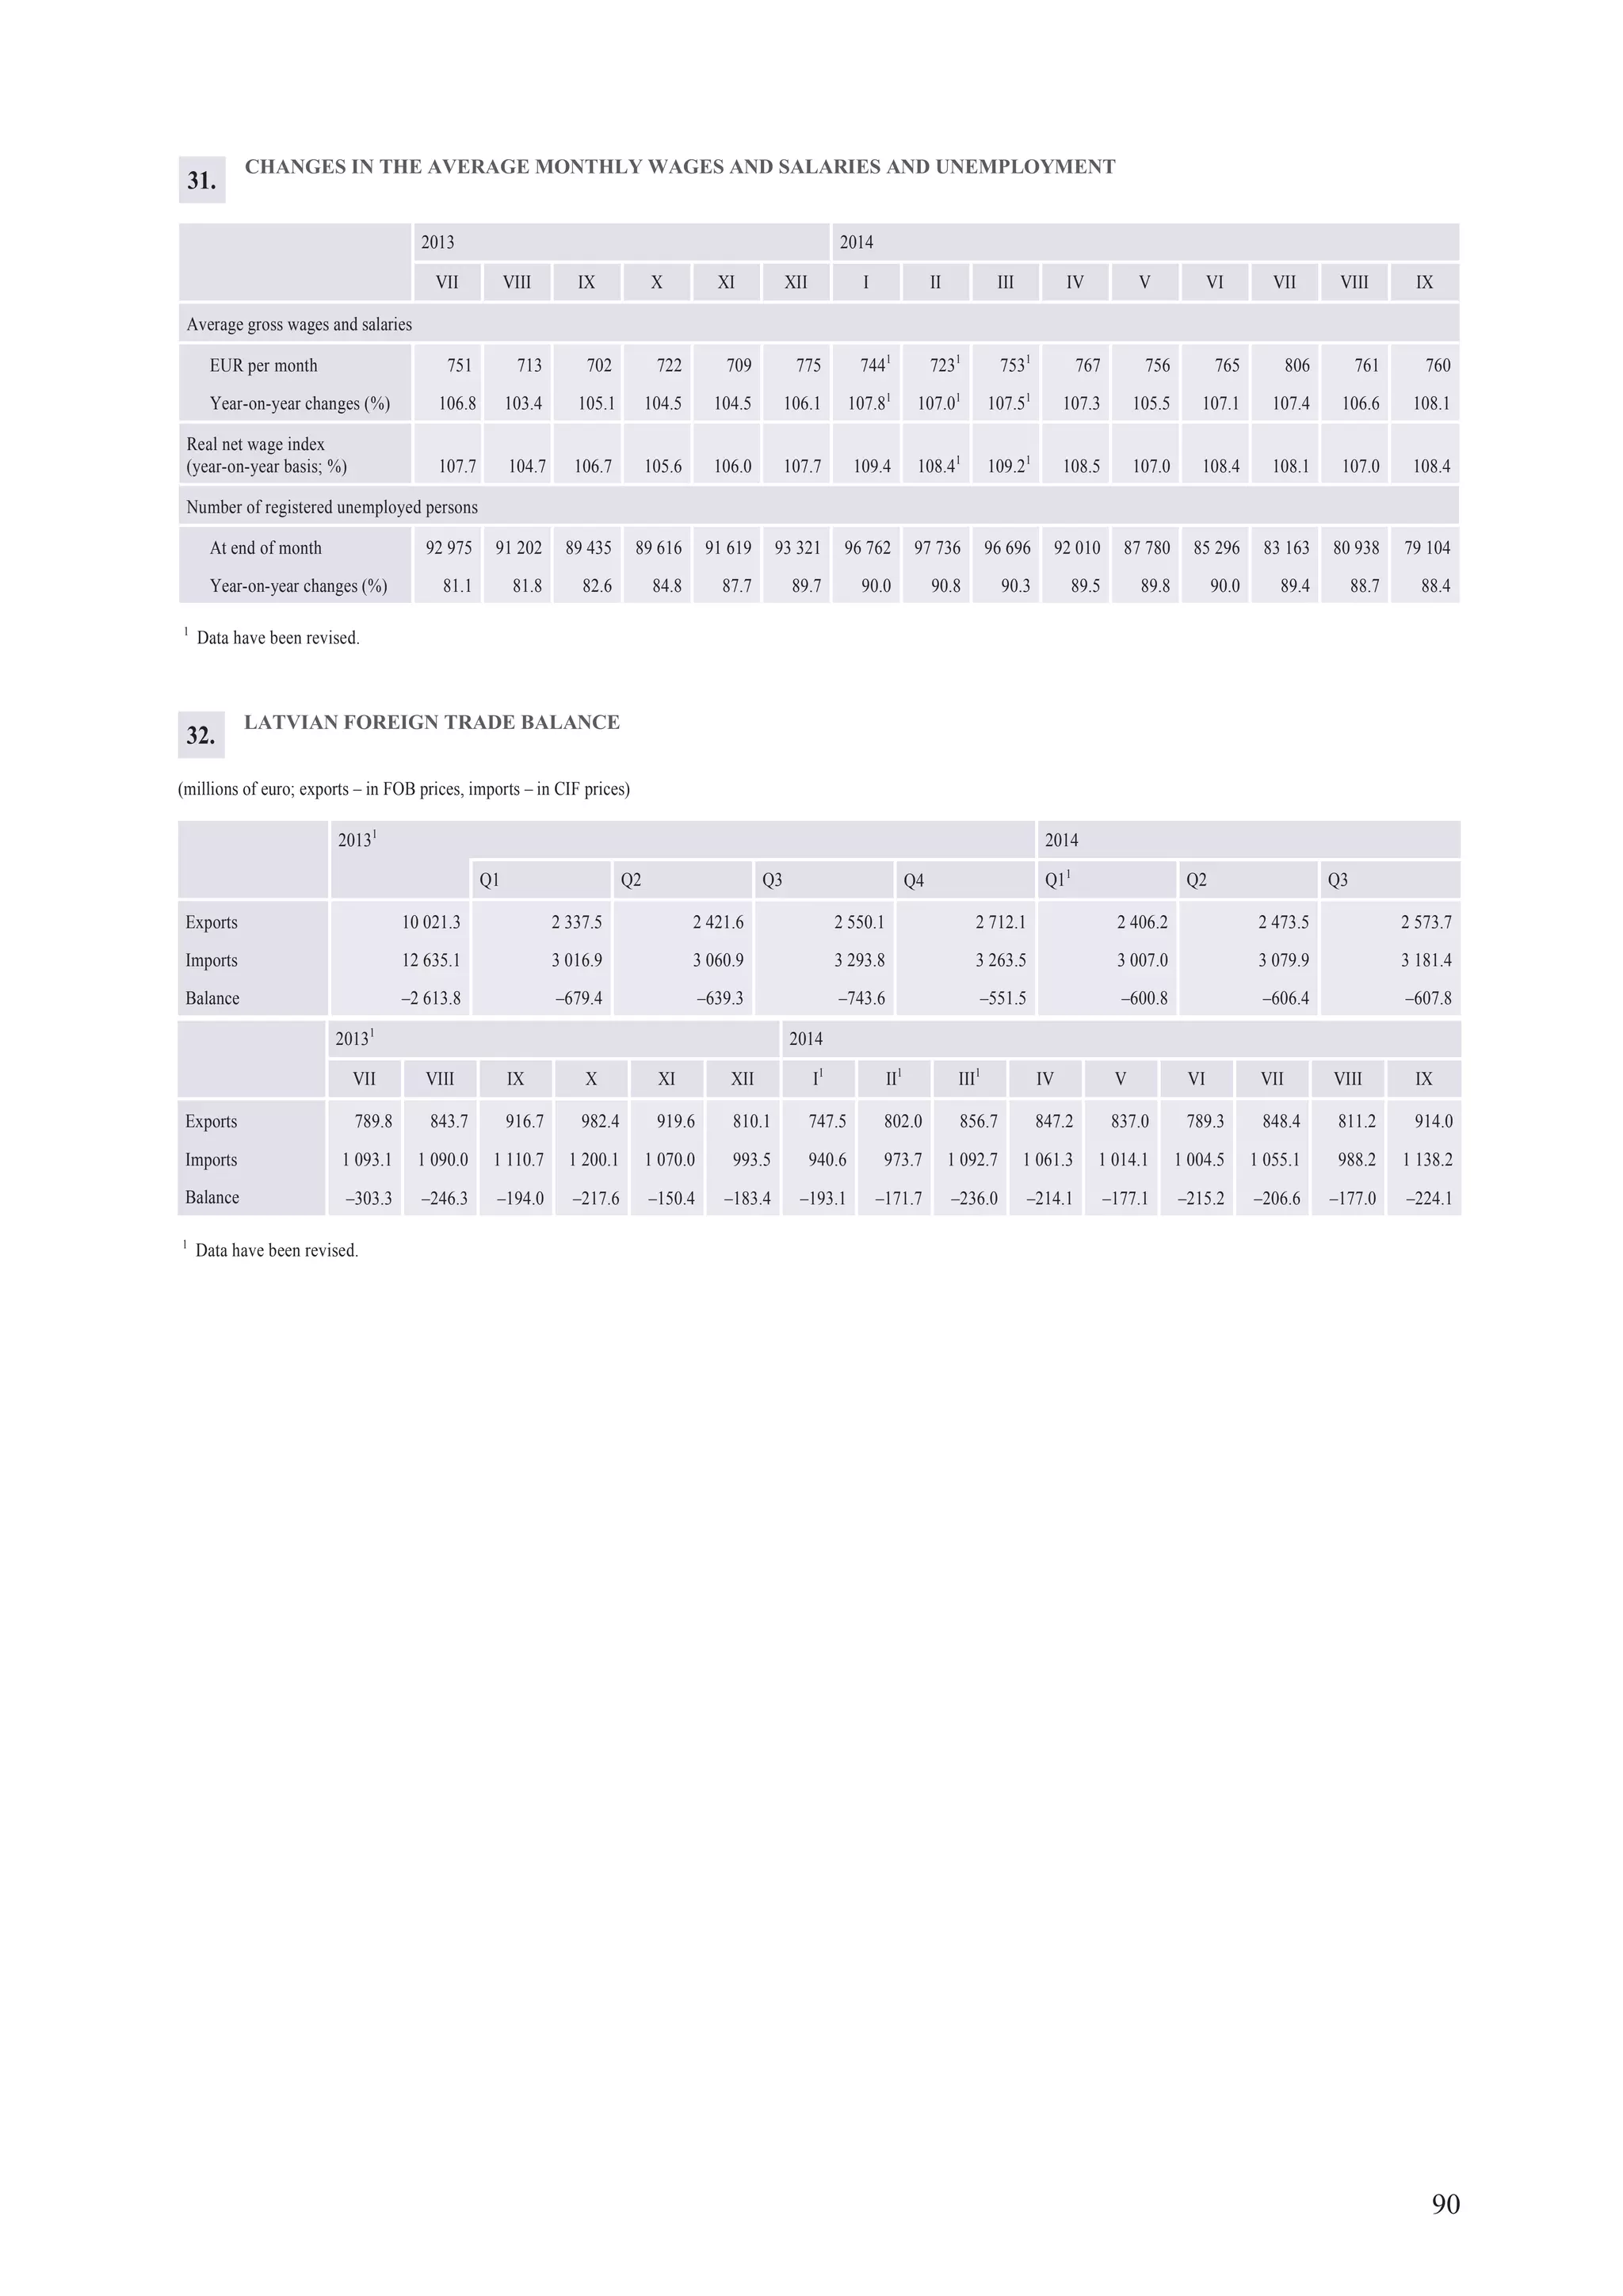
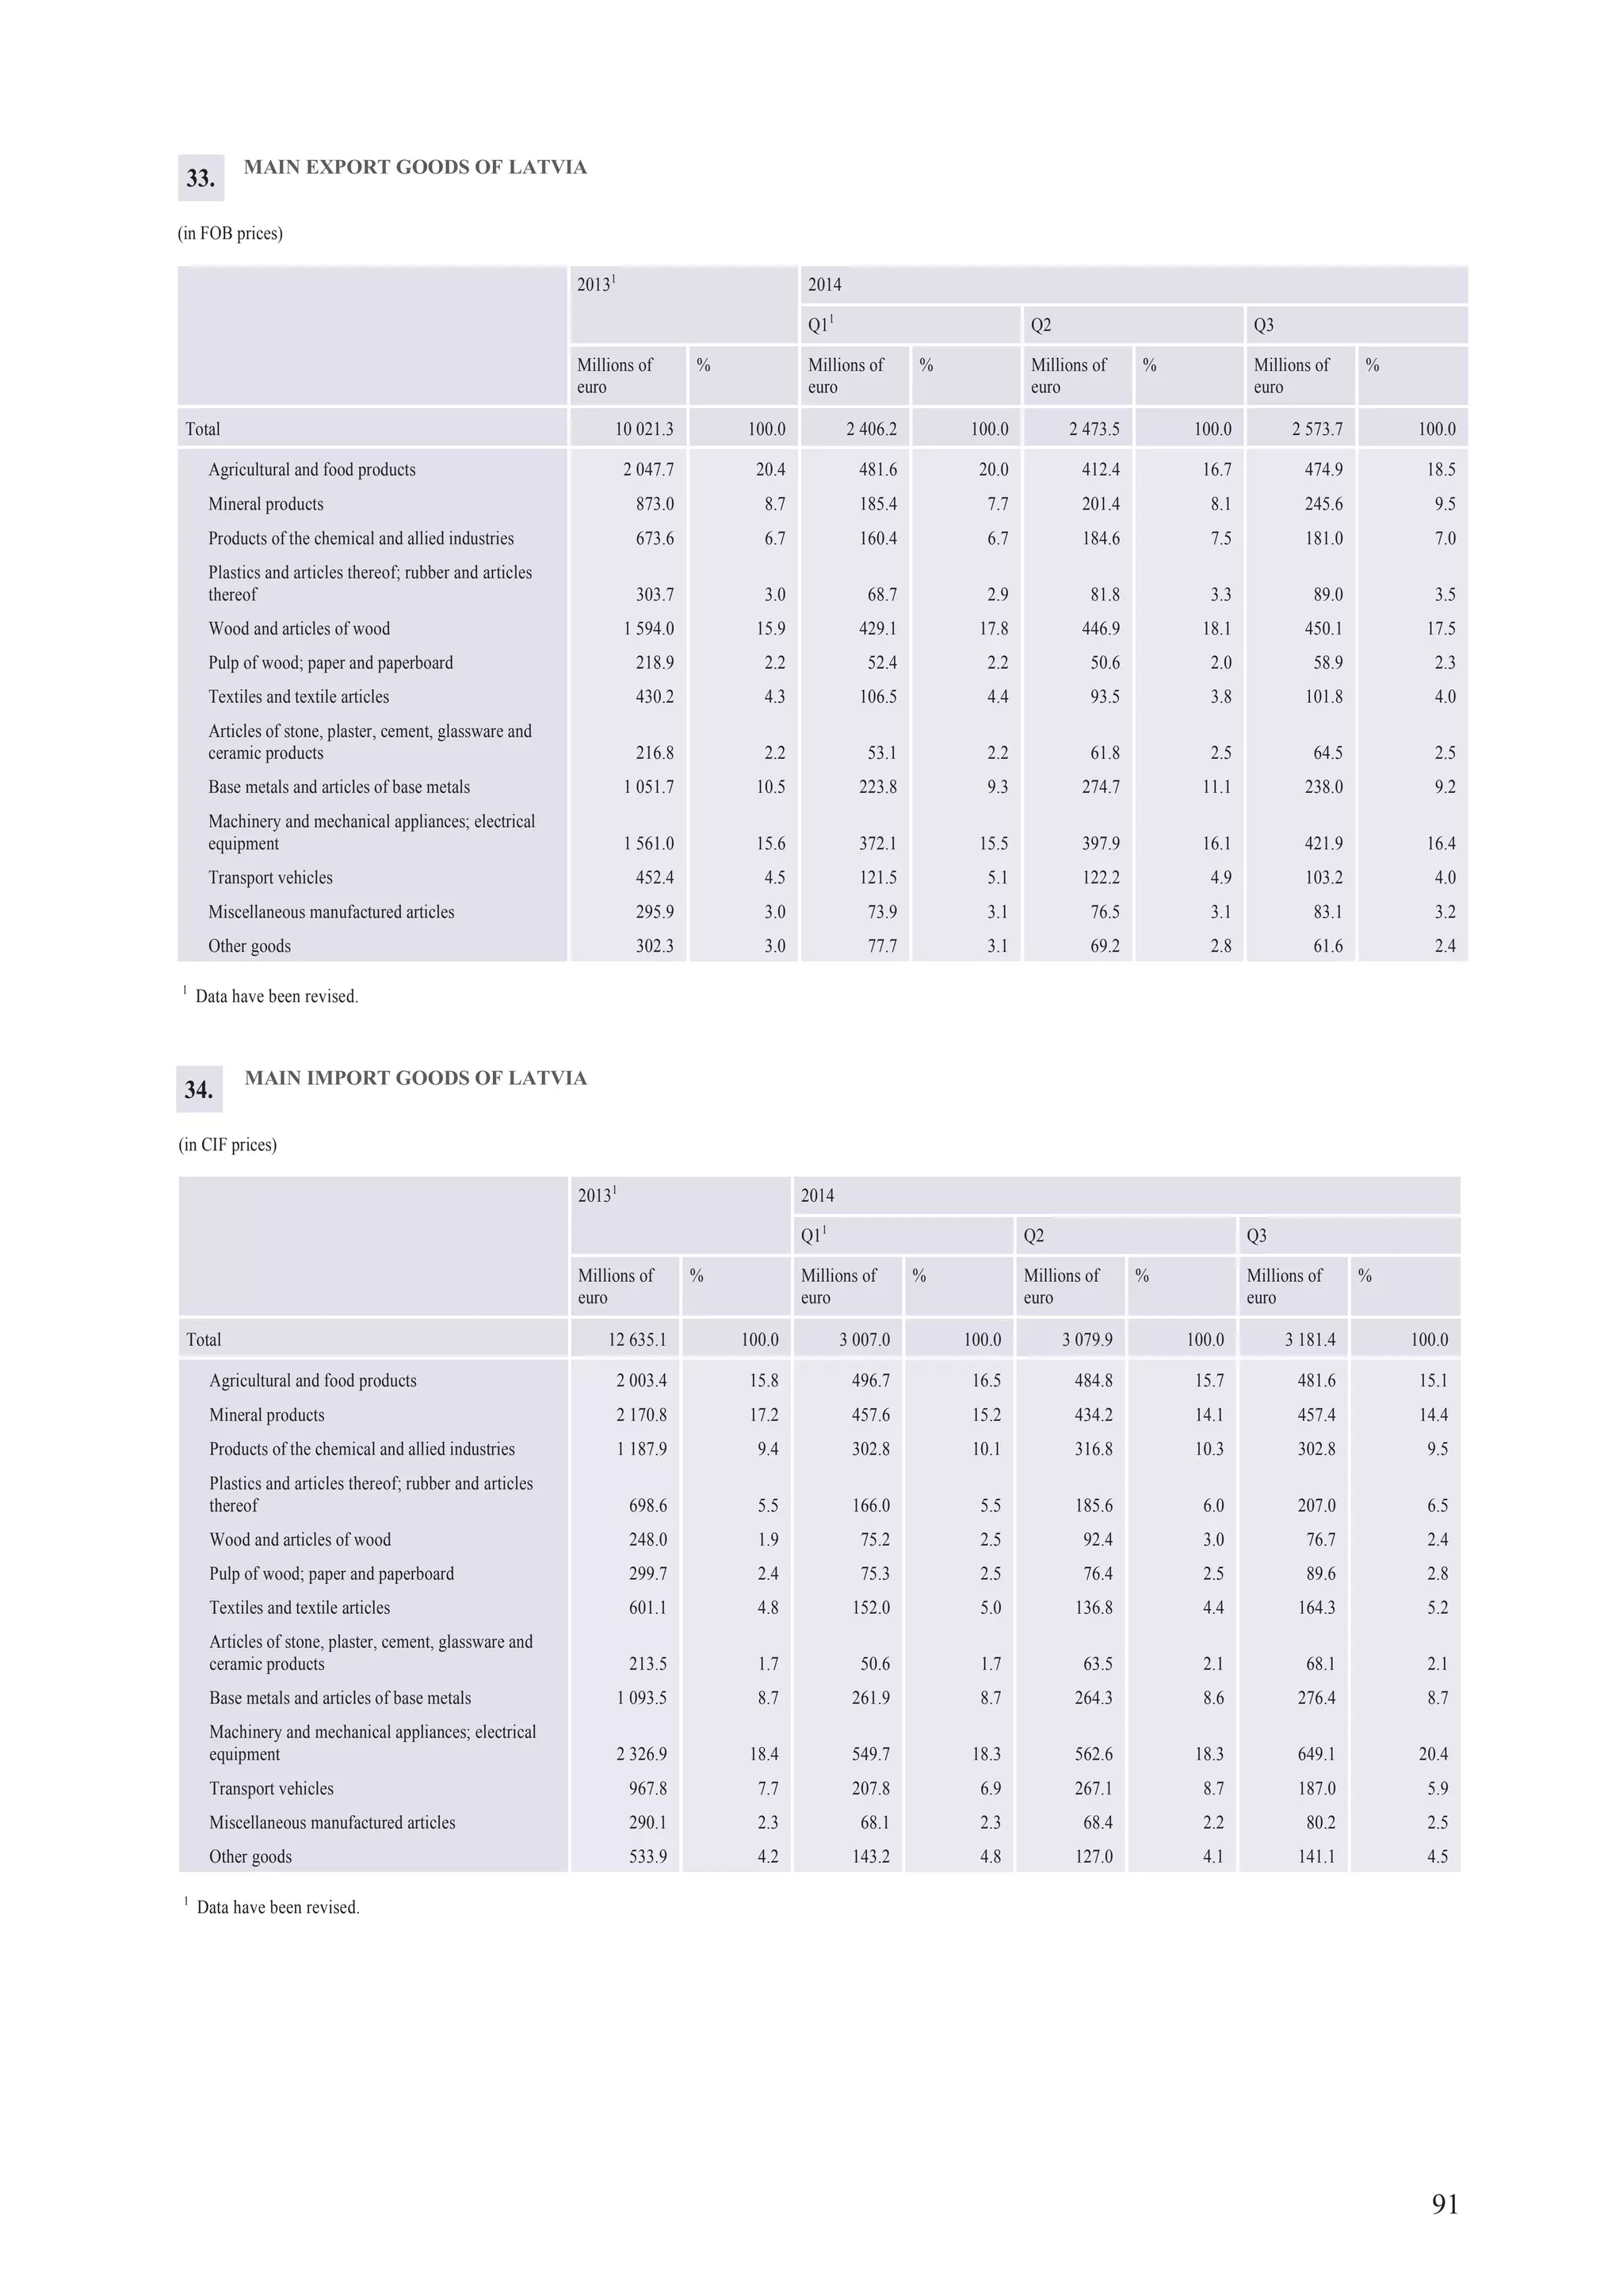
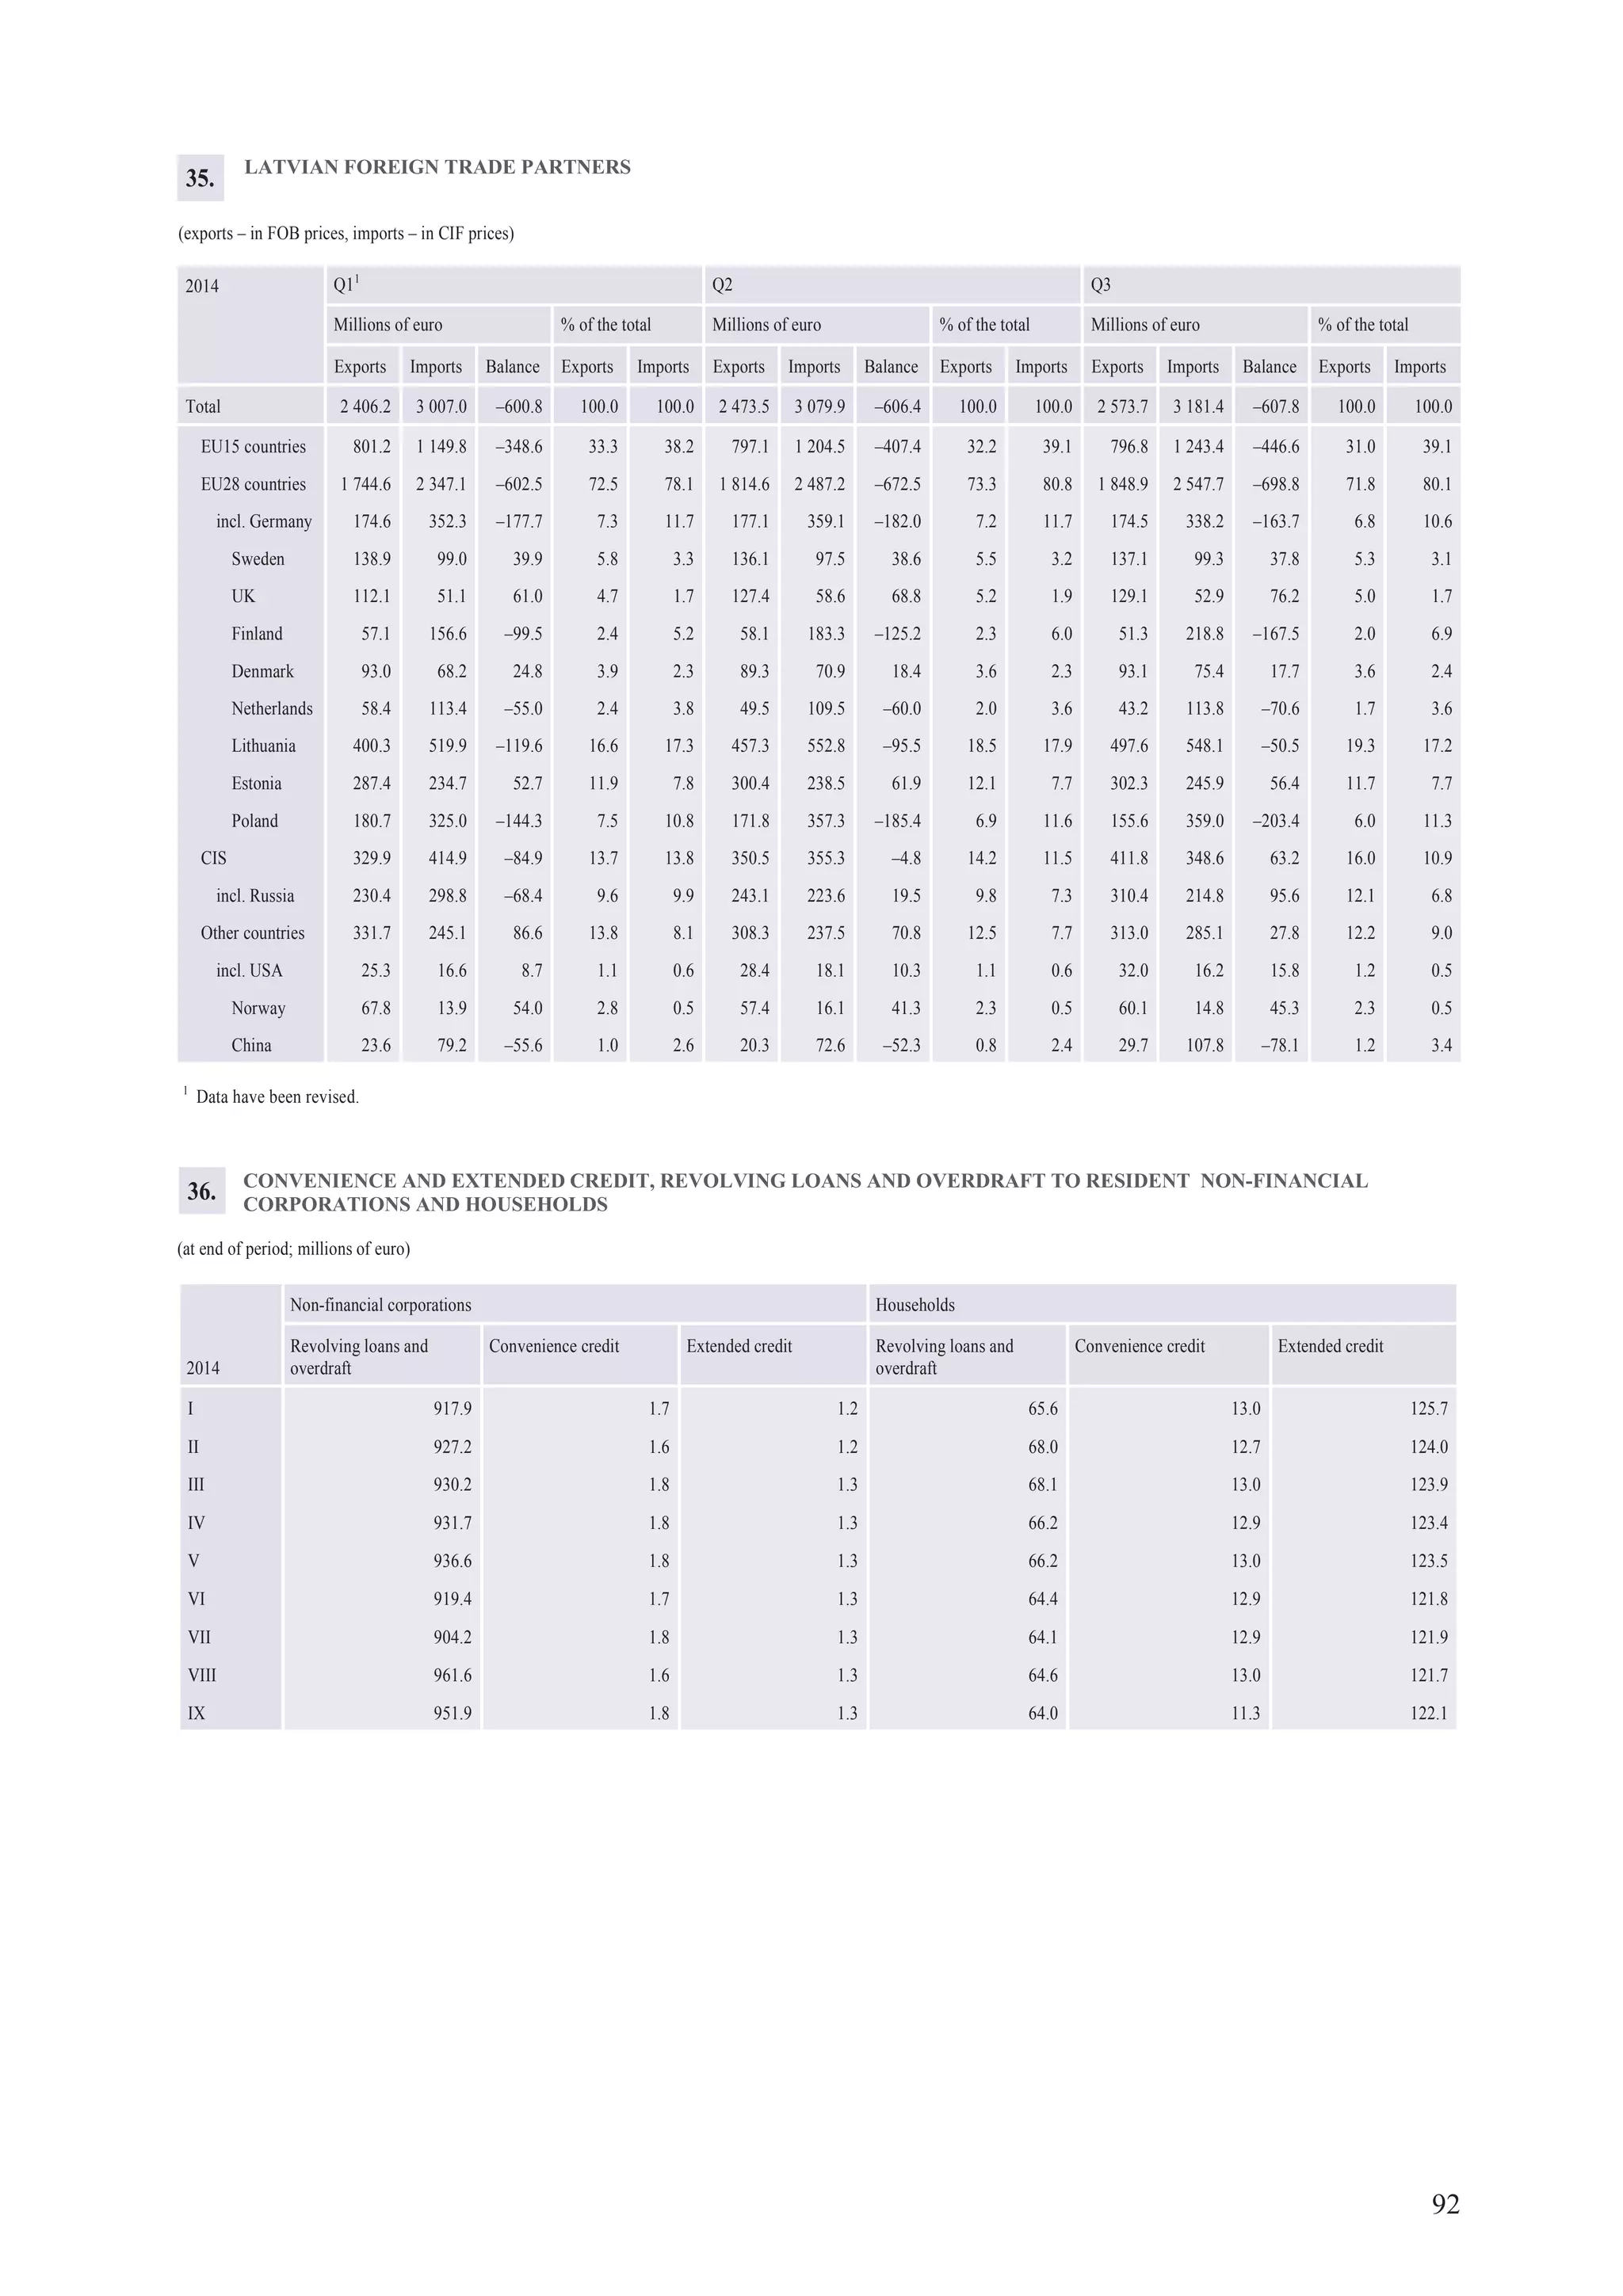
The document summarizes macroeconomic developments in December 2014. It reports that growth was weak in many of Latvia's major trade partners in late 2014. The IMF lowered GDP growth projections for the Eurozone, Germany, Sweden, Estonia and Lithuania for 2014 and 2015. Latvia's exports to Russia declined in the first nine months of 2014, though exports to other countries increased. The ECB lowered interest rates and implemented new bond purchase programs to stimulate lending and the Eurozone economy. Latvian lending continued a slow downward trend in late 2014 despite ECB actions. Inflation in Latvia remained low at 0.5% in October 2014.
"Highlights":
* Energy prices keep annual inflation below zero
* Manufacturing growth regains momentum
* Latvia's exports: a zigzag path maintained
"In Focus":
* Latvia's exports to euro area: developments after joining, autore: Daina Pelēce
Highlights:
Annual inflation stands positive
Manufacturing growth has become stronger
Government debt servicing costs have been reduced
"In Focus":
What are the different effects of oil price developments on Latvia's inflation? autori: Oļegs Tkčevs and Andrejs Bessonovs
Highlights:
* GDP growth at 2.6% in 2015
* Current account posted improvement
* Unemployment continues to decrease, but at a slower pace
In Focus:
Zero-based approach to government budgeting, Baiba Traidase
Macroeconomic Developments Report. December 2015Latvijas Banka
Based on data from tLatvijas Banka, Central Statistical Bureau of Latvia, Ministry of Finance, and Financial and Capital Market Commission, this publication assesses developments of the external sector and exports, financial market, domestic demand and supply, prices and costs, and balance of payments, and provides forecasts for the economic development and inflation.
"Highlights":
Economy faces temporary slowdown
Loan portfolio is showing some signs of moderation
External trade activity drops due to slowdown in re-exports
"In Focus":
Retail trade developments, by Daina Paula
Macroeconomic Developments Report, December 2017Latvijas Banka
Based on data from Latvijas Banka, Central Statistical Bureau of Latvia, Ministry of Finance, and Financial and Capital Market Commission, this publication assesses developments of the external sector and exports, financial market, domestic demand and supply, prices and costs, and balance of payments, and provides forecasts for the economic development and inflation.
"Highlights":
* Manufacturing growth supported by nearly all sectors
* Exports regain pace
* Inflation boosted by global food prices growth while oil prices decrease
"In Focus":
* Comparison of the Baltic States' exports, author Daina Pelēce
Macroeconomic Developments Report, June 2017Latvijas Banka
Based on data from Latvijas Banka, Central Statistical Bureau of Latvia, Ministry of Finance, and Financial and Capital Market Commission, this publication assesses developments of the external sector and exports, financial market, domestic demand and supply, prices and costs, and balance of payments, and provides forecasts for the economic development and inflation. The publication is available only in electronic form.
Highlights:
- Current account reflects the recovering investment activity
- Annual inflation continues hovering around 3%
- GDP growth exceeds expectations and leads to revised forecasts
In Focus:
- Latvia 2017: Back to growth and structural reforms, by Mārtiņš Grāvītis
Highlights:
- Economic growth in Latvia is gathering momentum
- Household savings in banks on the rise
- Surplus in the current account for third consecutive quarter
In Focus:
- About Latvijas Banka's inflation forecast revisions in March and June 2017, by Oļegs Krasnopjorovs
Swedbank was founded in 1820, as Sweden’s first savings bank was established. Today, our heritage is visible in that we truly are a bank for each and every one and in that we still strive to contribute to a sustainable development of society and our environment. We are strongly committed to society as a whole and keen to help bring about a sustainable form of societal development. Our Swedish operations hold an ISO 14001 environmental certification, and environmental work is an integral part of our business activities.
"Highlights":
* Manufacturing output continues to rise despite weak demand
* Latvian exports sluggish in complex circumstances
* Inflation starting to go up
"In Focus":
Macroeconomic balance maintained in 2016, supply side should be strengthened in 2017, autors: Oļegs Krasnopjorovs
"Highlights":
* Healthy growth, but caution warranted
* Inflation growth decelerating
* Recovery of imports increased current account deficit
"In Focus":
* Does the financing from the EU structural funds improve the competitiveness of Latvian businesses?, autors: Oļegs Krasnopjorovs
Latvijas Bankas "Monthly Newsletter", 10/2016Latvijas Banka
"Highlights":
* Substantial increase in high technology sectors
* Inflation is rising, but to a large extent owing to last year's developments
* External trade in August testifies to the power of Latvian cereal exports
"In Focus":
* #reformasLV or why Latvijas Banka cares about education and healthcare?, autors: Oļegs Krasnopjorovs
Macroeconomic Developments Report, December 2016Latvijas Banka
Based on data from Latvijas Banka, Central Statistical Bureau of Latvia, Ministry of Finance, and Financial and Capital Market Commission, this publication assesses developments of the external sector and exports, financial market, domestic demand and supply, prices and costs, and balance of payments, and provides forecasts for the economic development and inflation.
Published by DESA’s Development Policy and Analysis Division, the September issue of the Monthly Briefing on the World Economic Situation and Prospects covers recent events affecting the world economy such as the connection between slowing growth in Europe and weaker exports from Asia. The recessionary environment in Europe is reducing growth prospects for some developing economies as it weakens demand for those economies’ exports. This has been felt most strongly in East and South Asia, where exports to the EU are down by 7.2 per cent year on year, and Western Asia (including Iran) where exports are down 18 per cent.
For more information: http://www.un.org/en/development/desa/policy/index.shtml
"Makroekonomisko Norišu Pārskats", 2016. gada decembrisLatvijas Banka
Izdevumā, izmantojot Latvijas Bankas, Latvijas Republikas Centrālās statistikas pārvaldes, Latvijas Republikas Finanšu ministrijas un Finanšu un kapitāla tirgus komisijas datus, vērtētas ārējā sektora un eksporta, finanšu tirgus, iekšzemes pieprasījuma un piedāvājuma, izmaksu un cenu, kā arī maksājumu bilances norises un sniegtas tautsaimniecības attīstības un inflācijas prognozes.
"Makroekonomisko Norišu Pārskats" 2015. gada decembrisLatvijas Banka
Izdevumā, izmantojot Latvijas Bankas, Latvijas Republikas Centrālās statistikas pārvaldes, Latvijas Republikas Finanšu ministrijas un Finanšu un kapitāla tirgus komisijas datus, vērtētas ārējā sektora un eksporta, finanšu tirgus, iekšzemes pieprasījuma un piedāvājuma, izmaksu un cenu, kā arī maksājumu bilances norises un sniegtas tautsaimniecības attīstības un inflācijas prognozes.
"Highlights":
* Macroeconomic recovery expected in 2017
* Budget deficit target met; financing of priorities in 2017
* Stable growth in both loans and deposits
"In Focus":
* The tourism industry in Latvia as a Mirror of the Economy, autore: Linda Vecgaile
Prezentācija: Dzīves līmenis Latvijā. Vai var/vajag noķert Igauniju?Latvijas Banka
Prezentācija izmantota lekcijā Biznesa, mākslas un tehnoloģiju augstskolā "RISEBA" 2016. gada 1. decembrī.
Pirms aptuveni 25 gadiem Baltijas valstis uzsāka pāreju uz tirgus ekonomiku. Ir populārs uzskats, ka vienlaicīgi un no vienlīdzīgas pozīcijas. Bet vai tiešām no vienlīdzīgas? Kā salīdzināt dzīves līmeni un kā izskaidrot tā atšķirības, un ko varētu darīt šo atšķirību mazināšanai?
About Us:
UltraSpectra is a full-service online company dedicated to providing the services of internet marketing and
IT solutions to professionals and businesses looking to fully leverage the internet.
http://www.ultraspectra.com
http://www.ultraspectra.net
Join Our Network:
facebook.com/ultraspectra
twitter.com/ultraspectra
youtube.com/user/ultraspecra
Highlights:
- Annual inflation rose in May, indicating sustained demand
- GDP growth stable and moderate in the first quarter of 2015
- Annual wage growth gradually decreasing
In Focus:
- Economic situation and forecasts – growth slows down, risks remain high; by Igors Kasjanovs
Swedbank was founded in 1820, as Sweden’s first savings bank was established. Today, our heritage is visible in that we truly are a bank for each and every one and in that we still strive to contribute to a sustainable development of society and our environment. We are strongly committed to society as a whole and keen to help bring about a sustainable form of societal development. Our Swedish operations hold an ISO 14001 environmental certification, and environmental work is an integral part of our business activities.
"Highlights":
Annual inflation was stable in April
GDP growth maintained by retail trade and impeded by energy sector
Labour market gradually becoming more favourable for employees
"In Focus":
Eurosystem's monetary policy: Expanded Asset Purchase Programme; autors: Egils Kaužēns
Swedbank was founded in 1820, as Sweden’s first savings bank was established. Today, our heritage is visible in that we truly are a bank for each and every one and in that we still strive to contribute to a sustainable development of society and our environment. We are strongly committed to society as a whole and keen to help bring about a sustainable form of societal development. Our Swedish operations hold an ISO 14001 environmental certification, and environmental work is an integral part of our business activities.
Swedbank Economic Outlook - 2010, September 21Swedbank
Swedbank was founded in 1820, as Sweden’s first savings bank was established. Today, our heritage is visible in that we truly are a bank for each and every one and in that we still strive to contribute to a sustainable development of society and our environment. We are strongly committed to society as a whole and keen to help bring about a sustainable form of societal development. Our Swedish operations hold an ISO 14001 environmental certification, and environmental work is an integral part of our business activities.
Similar to Macroeconomic Developments Report. December 2014 (20)
Latvijas tautsaimniecības makroekonomiskā attīstība | Septembris 2023Latvijas Banka
Latvijas Bankas prezidenta Mārtiņa Kazāka un Monetārās politikas pārvaldes vadītāja Ulda Rutkastes prezentācija 2023. gada 29. septembrī par jaunākajām ekonomikas prognozēm.
Latvijas Bankas Finanšu pratības daļas vadītājas Aijas Brikšes prezentācija Rīgas Izglītības un informatīvi metodiskā centra seminārā skolotājiem "Drošs internets un droša digitālā finanšu pratība" 2023. gada 29. augustā.
Latvijas Bankas Makroekonomikas analīzes daļas galvenās ekonomistes Baibas Brusbārdes prezentācija seminārā "Aktualitātes ekonomikā" 2023. gada 24. augustā.
Latvijas Bankas Monetārās politikas analīzes daļas galvenās ekonomistes Anetes Kravinskas prezentācija seminārā "Aktualitātes ekonomikā" 2023. gada 24. augustā.
Latvijas Bankas Makroekonomikas analīzes daļas galvenā ekonomistes Dainas Paulas prezentācija seminārā "Aktualitātes ekonomikā" 2023. gada 24. augustā.
Latvijas tautsaimniecības makroekonomiskā attīstība | Marts 2023Latvijas Banka
Latvijas Bankas prezidenta Mārtiņa Kazāka un Monetārās politikas pārvaldes vadītāja Ulda Rutkastes prezentācija 2023. gada 31. martā par jaunākajām ekonomikas prognozēm.
3. 2
MACROECONOMIC DEVELOPMENTS REPORT
December 2014
CONTENTS
Contents
Abbreviations 3
Executive Summary 4
1. External sector and exports 6
1.1 External economic environment 6
1.2 Latvia's competitiveness and dynamics of goods exports 8
2. Monetary Policy and Financial Markets 11
2.1 Global financial markets 11
2.2 Securities market 14
2.3 The ECB monetary policy decisions, Eurosystem operations, liquidity and
money market developments 15
2.4 Lending and deposit rates 18
2.5 Dynamics of domestic loans and deposits 20
3. Domestic Demand 25
3.1 Private consumption and investment 25
3.2 Government expenditure and budget 28
4. Aggregate Supply 31
4.1 Industry and construction 31
4.2 Services 34
4.3 Labour market 36
5. Costs and Prices 40
6. Balance of Payments 42
7. Conclusions and Forecasts 44
7.1 Economic developments 44
7.2 Inflation 46
Statistics 48
Additional Information 94
4. 3
MACROECONOMIC DEVELOPMENTS REPORT
December 2014
Abbreviations
ABSPP – Asset-backed securities purchase programme
CBPP3 – third Covered bond purchase programme
CDS – credit default swap
CIF – cost, insurance and freight at the importer's border
CIS – Commonwealth of Independent States
CSB – Central Statistical Bureau of Latvia
EC – European Commission
ECB – European Central Bank
ERDF – European Regional Development Fund
ESA 2010 – European System of Accounts 2010
EU – European Union
EU15 – EU countries before 1 May 2004
EURIBOR – Euro Interbank Offered Rate
FOB – free on board at the exporter's border
FRS – Federal Reserve System
GDP – gross domestic product
HICP – Harmonised Index of Consumer Prices
IMF – International Monetary Fund
JSC – joint stock company
MFI – monetary financial institution
OFI – other financial intermediary (other than an insurance corporation or a pension fund)
TLTRO – targeted longer term refinancing operations
UK – United Kingdom
UN – United Nations Organisation
US – United States of America
VAT – value added tax
WTO – World Trade Organisation
ABBREVIATIONS
5. 4
MACROECONOMIC DEVELOPMENTS REPORT
December 2014
EXECUTIVE SUMMARY
Executive Summary
Growth was weak in a large number of Latvia's major trade partners in the second and third
quarters of 2014, and future projections do not point towards early resumption of rapid
growth either. The conflict between Russia and Ukraine, weak growth of the euro area,
changes in the FRS monetary policy that may hinder market growth of developing countries
as well as the expected deceleration of growth in China exerted a significant contractive
effect. Considering the combination of these factors, the IMF in October made downward
revisions to GDP growth projections for a number of Latvia's major trade partners.
During the first nine months of 2014, Latvia's exports to Russia declined by 2.7%, and
growth in several other important markets (Estonia, Finland, Germany) also moderated
primarily owing to a decrease in demand and less to the sanctions imposed by the EU on
Russia. Nevertheless, Latvian exporters offset the weak demand relatively successfully by an
increase in exports to the UK, Sweden, Poland, Lithuania and other countries. Thus, Latvia's
total exports in January–September 2014 year-on-year continued to rise. Latvia's export
market shares in global imports also grew further suggesting that competitiveness is still
sustainable.
The Governing Council of the ECB decided on the reduction in the key ECB interest rates
twice (on 5 June and 4 September) to enhance progress of the euro area towards the inflation
rate below, but close to, 2% in the medium term. In addition, the Governing Council of the
ECB adopted a decision on the introduction of targeted longer-term refinancing operations
(TLTRO) at its meeting of 5 June. In its meeting of 4 September, the Governing Council of
the ECB also decided to start implementing the Asset-backed securities purchase programme
(ABSPP) and a new Covered bond purchase programme (CBPP3).
The ECB Governing Council adopted a decision on setting negative interest rates on
deposits with central banks of the euro area to facilitate lending to real economy. However,
Latvian credit institutions largely placed their excess funds with foreign credit institutions
and in government and corporate debt securities. Thus, domestic loans continued their
slow downward trend in April–October, with loans both to households and non-financial
corporations falling. Nevertheless, August and September saw a moderate monthly growth
in lending, and in October the annual rate of decrease in loans was the lowest since May
2013. This positive trend might continue until the end of the year; however, improvement
in lending is likely to slow down in 2015. It is expected that mortgage lending will be
hampered by precaution arising from external risks along with the impact of the amendments
to the Insolvency Law and the poor state of the legal environment in the area of insolvency.
The decisions adopted by the Governing Council of the ECB aimed at facilitating lending
will fail to fully offset the above hindrances.
Stable GDP growth in Latvia continued both in the second and third quarters (3.3% and
2.4% respectively year-on-year); however, growth was slower than in 2013. The domestic
market, construction, trade and public utilities currently contribute to growth. In the second
quarter, the current account deficit of Latvia's balance of payments amounted to 224.0
million euro or 3.8% of GDP.
With the cyclical unemployment component shrinking and growth decelerating, employment
growth slowed down sharply in 2014, and currently the labour market is close to
equilibrium. A steep rise in wages and salaries was observed in the first quarter, but it was
driven by several one-off factors, including a rise in the minimum wage, easing of the tax
burden on labour and rounding up of wages and salaries upon the euro changeover. The rise
in wages and salaries in 2014 is expected to exceed the traditional 4%–5% owing to the
impact of the first quarter data.
The annual inflation rate in Latvia remains low both from the perspective of a longer time
6. 5
MACROECONOMIC DEVELOPMENTS REPORT
December 2014
EXECUTIVE SUMMARY
period and the growing economy. The 12-month average HCPI reached 0.5% in October. In
the first half of the year, a lower-than-expected inflation rate was underpinned by both the
global price trends that impacted the inflation rate in the euro area and by the postponement
of the opening of the electricity market until 2015. In response to the Russian import ban on
food products, inflation expectations deteriorated rapidly in August and September. Dairy
product and vegetable prices were expected to shrink due to increased supply. However,
the data for August and September suggested that expectations had not fully materialised
and inflation continued on its gradual upward trend, atypical for the season and economic
conditions in selected consumption groups. Nevertheless, many of the above prices saw
adjustment already in October, pointing to the fact that the demand had probably been
overestimated. At the same time inflation expectations rose on account of the published
electricity tariffs.
Since the above trends were taken into account when producing the previous forecast, the
GDP forecast for 2014 by Latvijas Banka has been slightly reduced from 2.9% to 2.8%, but
the GDP forecast for 2015 remains unchanged. The downward risks to the GDP forecast are
still mainly related to weaker-than-expected recovery of the external environment, while
the upside risks are linked to the possible resumption of operation of the JSC KVV Liepājas
metalurgs.
7. 6
MACROECONOMIC DEVELOPMENTS REPORT
December 2014
Table 1
GDP GROWTH PROJECTIONS FOR LATVIA'S MAJOR
TRADE PARTNERS IN 2014 AND 2015
(%)
20141
20142
20151
20152
Euro area 1.1 0.8 1.5 1.3
Germany 1.9 1.4 1.7 1.5
UK 3.2 3.2 2.7 2.7
Russia 0.2 0.2 1.0 0.5
Denmark 1.5 1.5 1.7 1.8
Sweden 2.8 2.1 2.6 2.7
Estonia 2.4 1.2 3.2 2.5
Lithuania 3.3 3.0 3.5 3.3
Poland 3.1 3.2 3.3 3.3
Sources: April 2014 (Denmark, Sweden, Estonia, Lithuania and
Poland) and July 2014 (the euro area, Germany, the UK and Russia) (1)
and October 2014 (2) World Economic Outlook (IMF).
1. EXTERNAL SECTOR AND EXPORTS
1. External Sector and
Exports
1.1 External economic environment
In October 2014, the IMF revised downwards the
GDP growth projections for a number of major global
players for 2014 and 2015. It was on account of a
slower GDP growth in the first six months in such
countries as Russia (the Russian–Ukrainian conflict
having adverse impact on investment, manufacturing
and confidence indicators), Brazil (domestic demand
turning out to be weaker than projected), Japan (a
stronger-than-expected drop in domestic demand
following a consumption tax hike), and the euro area
as a whole (economic growth slowed down in the
second quarter due to heightened geopolitical tension,
falling investment and contracting exports). At the
same time, the economic development of the US and
the UK as well as China and India was relatively
positive and supported global economic recovery.
The GDP growth projections for the euro area,
Germany, Sweden, Estonia and Lithuania were
revised downwards by the IMF in October; the
projections for Poland were revised upwards, while
those for the UK, Russia and Denmark remained
unchanged (see Table 1). A slower GDP growth in
Latvia's major trade partners may translate also into
a weaker demand from these countries for Latvian
goods and services.
In the third quarter, the euro area GDP increased
by 0.2% against the previous quarter and posted a
0.8% increase on an annual basis (see Chart 1.1),
thus suggesting a weak and uneven recovery of
the euro area. The euro area growth still remains
weak, with notable differentials across countries.
Reform implementation processes in Spain, Ireland
and Portugal have brought about the first positive
results, with the economic growth in these countries
recommencing. In some other countries recording
more sluggish structural reform processes (Italy
and France), also the GDP growth has been more
moderate. Waning private sector deleveraging, tight
lending standards and high unemployment rates
are still imposing restrictions on sustainability of
economic recovery. Major risks to the euro area
growth perspective remain related to the still-unsolved
conflict between Russia and Ukraine and the impact
of imposed sanctions as a result from it, while weaker
global trade data and decelerating economic growth
in the developing countries give rise to extra concerns
Chart 1.1
annual and QUARTERLY GDP GROWTH RATE
IN Q3 2014 in latvia's MAJOR trade partner
countries
(%)
8. 7
MACROECONOMIC DEVELOPMENTS REPORT
December 2014
about the global economic growth expectations (see
Chart 1.2 for Purchasing Managers Index in Latvia's
major trade partners).
Economic growth data for Latvia's major trade
partners have been varying. In the third quarter,
Germany's GDP increased by 0.1% quarter-on-quarter.
Subdued investment was offset by strengthened
private consumption, and Germany succeeded in
averting technical recession. Even though Germany
has stopped to act as the engine of euro area economic
growth, declining unemployment, rising salaries and
low interest rates support the development.
In Estonia, GDP posted a 0.2% quarter-on-quarter
increase in the third quarter. Higher revenue from
value added and excise taxes had a positive impact on
GDP growth, whereas the impact from developments
in the transport sector, in freight transportation by
rail in particular, was negative. The government tariff
policy along with tighter competition with the new
seaports in north-western Russia affected adversely
the turnover of freight transportation by rail in
Estonia.
In the third quarter, Lithuania's GDP picked up 0.4%
quarter-on-quarter. Some analysts claim that Lithuania
with its embargo-affected goods exports to Russia
accounting for 2.5% of GDP is much more vulnerable
to Russia's sanctions than the other Baltic States (in
Latvia, Estonia and Poland the affected exports to
Russia account for less than 0.5% of GDP). However,
the growth in Lithuania is favoured by the invitation
to Lithuania to join the euro area as of 1 January 2015,
which adds extra recognisability to the country.
The quarter-on-quarter rise in Poland's GDP was 0.9%
in the third quarter. At its November meeting, the
Monetary Policy Council of Narodowy Bank Polski
emphasised that the economic situation in Poland had
recently deteriorated, apparently also under the impact
of the consequences from the Russian–Ukrainian
conflict, with decelerating pace in manufacturing,
construction and retail trade all pointing to a decline.
GDP in the UK posted a 0.7% quarter-on-quarter
pick-up in the third quarter. Overall, the economic
growth in the UK has remained strong since early
2013 and is expected to be solid also at the close of
2014. In addition, the improving economic situation
in the US, a major trade partner of the UK, generates
additional confidence in sustainable growth thereafter.
In August, on account of more sluggish external
market dynamics, the Ministry of Finance of Sweden
revised downwards the GDP forecast both for 2014
1. External Sector and Exports
Chart 1.2
purchasing managers index in latvia's major
trade partner countries
(total seasonally adjusted indicator)
9. 8
MACROECONOMIC DEVELOPMENTS REPORT
December 2014
(by 0.6 percentage point, to 1.9%) and 2015 (by 0.1
percentage point, to 3.0%). As was then indicated by
the Minister for Finance Anders Borg, fiscal policy in
the current and next year would focus on enhancing
the economic advance.
In Denmark, the retail trade data point to cyclically
low consumer demand. However, the budget
deficit remains moderate, disposable income of the
population continues to grow, and unemployment rate
is declining.
Turning to Russia, its GDP growth data and several
confidence and financial market indicators suggest
that the country's economy had been subdued even
before the EU, the US and other countries announced
the economic sanctions late in July. Capital outflows
responsible for the depreciation of the Russian ruble
still figure among the most pressing problems in
Russia. In addition, the Central Bank of the Russian
Federation took a decision to abolish the acting
exchange rate policy mechanism by cancelling the
operational band and regular interventions within and
outside the borders of this band.
1.2 Latvia's competitiveness and dynamics
of goods exports
In the first nine months of 2014, Latvia's exports
of goods retained an upward year-on-year trend,
increasing by 2.0%.
The largest positive nine-month contribution to the
annual rise in goods export value came from wood
and articles of wood (2.0 percentage points), products
of the chemical and allied industries (0.9 percentage
point), and machinery and mechanical appliances,
electrical equipment (0.7 percentage point). In the first
nine months of 2014, exports of wood and articles
of wood posted a year-on-year 11.2% increase. The
wood export market has been diversified, hence
export volumes expanded in both eastern and western
directions. For instance, in the first nine months of
2014, exports of plain sawn wood and wood in chips
recorded year-on-year increases to the UK, Egypt,
South Korea, China and Ireland. However, the annual
export growth was adversely affected by contracting
volumes of base metals and articles of base metals,
textiles and textile articles, and mineral products.
Despite a negative political and economic
environment, the turnover of Latvian foreign trade in
goods in the third quarter picked up 3.6% quarter-on-
quarter, with goods exports and imports expanding by
4.1% and 3.3% respectively (see Charts 1.3 and 1.4
1. External Sector and Exports
Chart 1.3
EXPORTS OF GOODS
(year-on-year; %)
Chart 1.4
IMPORTS OF GOODS
(year-on-year; %)
10. 9
MACROECONOMIC DEVELOPMENTS REPORT
December 2014
1. External Sector and Exports
for year-on-year changes in exports and imports of
goods). A decrease in the export value did not come as
a surprise, for it had been signalled by the weakening
external demand, slow and uneven advance of the
euro area economies, and contracting demand from
Russia due to embargo imposed on food product
imports, and depreciation of the Russian ruble.
Even though exports to Russia increased in the third
quarter, in the first nine months of 2014 overall
they contracted by 21.6 million euro or 2.7% in
comparison with the same period of the previous
year. Transport vehicles (trailers and semi-trailers,
other not mechanically propelled vehicles) and
products of the chemical industry (medications)
posted the largest drop in exports to Russia. A positive
annual increase, on the other hand, was still retained
by animal product exports to Russia (beef and
poultry meat, butter, cheese, cottage cheese, cream,
etc.), products of food industry (mainly alcoholic
beverages), and machinery (centrifuges and treatment
machinery, metal processing machinery and other
mechanical appliances and their parts). Month-on-
month, the export growth in July was on account
of animal products (butter, cheese, cottage cheese),
products of the chemical industry (cosmetics, soap),
electrical equipment (block capacitors), textile articles
(underwear, male and female wearing apparel), and
other products. In August and September, exports to
Russia expanded mainly on account of the growing
volumes of alcoholic beverages, wine and preserved
fish. In the meantime, animal product exports to
Russia posted a notable contraction in August and
September, because this product group was affected
most by the Russian embargo on imports effective as
of August. It was exports of products included in the
banned imports group that had recorded an upswing
in early 2014, with their share in exports to Russia
increasing notably to 8.1% (from 4.5% in 2013) in the
first half of the year.
In the first nine months of 2014, the value of exports
to Belarus contracted by 8.2 million euro or 6.0%
year-on-year. In the given period of time, volume
contractions mainly refer to metal structures, transport
vehicles, and automatic data processing equipment
and its elements. In August and September, exports
of the Russian-banned animal products (milk, cream,
cheese and cottage cheese) to Belarus boosted.
The low overall external market demand
notwithstanding, Latvia's export market shares, as
suggested by the WTO preliminary data, continued
to increase. Latvia's exports, on the other hand, also
captured the subdued growth in some euro area
11. 10
MACROECONOMIC DEVELOPMENTS REPORT
December 2014
economies and Russia. However, Latvian exporters
managed to set off this weakening demand from some
major trade partners, Russia, Estonia, Finland and
Germany among them, quite successfully by boosting
exports and export market shares in other European
countries (e.g. the UK, Poland, Lithuania, Hungary
and Sweden) as well as by producing new goods and
finding new market opportunities in Asia (China,
Turkey, Israel, Iran, Pakistan, Uzbekistan, etc.), Africa
(Mozambique, Egypt and Libya), and America (the
US and Haiti). The share of technology-intensive and
high-value-added goods in Latvian exports has been
gradually rising (according to the Eurostat data, from
7.7% of total exports in 2011 to 9.9% in the first half
of 2014).
Upside risks with potentially negative impact on
external demand are aggravating in the global
environment. The euro area is threatened by continued
stagnation due to sluggish economic growth in
some euro area countries. The subdued activity of
investors is a result of uncertainty generated by the
conflict between Russia and Ukraine and deceleration
of economic development in Russia and euro area
countries. Russia's ban on certain agricultural and
food product imports may affect not only the sector
of agriculture and respective food producers but
other branches as well. However, despite the negative
background, producers' sentiment as to the future
perspective, including food, wood and metal export
producers, has not deteriorated dramatically. The
situation incurred by Latvian businesses marks a
significant turning point, as because of the Russian–
Ukrainian conflict the export market demand patterns
have changed notably. This in turn acts as a trigger of
positive export adjustments relative to both the variety
of exported goods and trade partners, thus minimising
business risks. When taking a longer perspective,
the sustainability of Latvian export growth will
greatly depend on enhancing competitiveness, which
currently has a positive impact on the dynamics of
Latvian export market shares, investment in boosting
the output and production of new and innovative items
as well as capturing new export market shares.
1. External Sector and Exports
12. 11
MACROECONOMIC DEVELOPMENTS REPORT
December 2014
2. Monetary Policy and
Financial Markets
2.1 Global financial markets
In the summer and autumn of 2014, the global
financial market sentiment was primarily driven by
the developments in Ukraine's geopolitical situation
and investor concerns about what impact the western
sanctions against Russian officials and businesses as
well as Russia's response to them would have on the
growth of the euro area and global economy. These
sentiments were also affected by shortly anticipated
divergence in monetary policy pursued by leading
central banks and worries about deceleration of
growth momentum in euro area countries and other
leading world economies. Market participants closely
monitored macroeconomic indicators, trying to
receive any signals about the eventual activities of
leading central banks.
Between June and November, the ECB and
other leading central banks went on pursuing
accommodative monetary policy, and the refinancing
rates were held close to zero (see Chart 2.1). In line
with expectations, the FRS decided to conclude its
asset purchase programme on 29 October, reaffirming
the view that the recent financial market instability
and low inflation outlook were unlikely to undermine
progress made towards achieving the employment
and inflation targets. The FRS also announced that
the federal funds rate would be maintained within the
current target range of 0%–0.25%. In determining
how long to maintain this target range, the FRS
will assess progress in the country's economic
activity. Discussions about the exact date of the FRS
commencing the raising of interest rates intensified in
the reporting period and generated financial market
volatility. Some members of the Bank of England's
Council are in favour of higher interest rates already
in the near future. The anticipated divergence in
monetary policy of the ECB and other leading central
banks affected the prices of financial instruments. The
spread between the German and the US government
bonds widened notably in the reporting period,
and the exchange rate also captured the anticipated
divergence: the euro exchange rate against the US
dollar depreciated by 8%, from 1.37 US dollars per
euro in early June to 1.25 US dollars per euro in mid-
November, i.e. the lowest value of this currency pair
since August 2012 (see Chart 2.2 for the exchange rate
of US dollar, Russian ruble and UK pound sterling
against the euro dynamics). In the reporting period,
2. Monetary Policy and Financial Markets
Chart 2.1
base rates
(%)
Chart 2.2
Exchange rate of US dollar, Russian ruble
and Uk pound sterling against euro
(index: 1 January 2014 = 100)
13. 12
MACROECONOMIC DEVELOPMENTS REPORT
December 2014
2. Monetary Policy and Financial Markets
the euro depreciated also against the Swiss franc
(by 1.5%) and the UK pound sterling (by 3.0%) but
appreciated against the Japanese yen (by 4.0%).
At the beginning of the reporting period, financial
market sentiments were underpinned by the ongoing
escalation of the Russian–Ukrainian conflict, while
in the second half of the period, they were supported
by the news about several negative macroeconomic
indicators and eventual growth deceleration in the
leading world economies. Of the euro area countries,
Portugal and Greece were the objects of concern.
The crisis of Banco Espirito Santo, a Portugal's bank,
reminded market participants of the recent financial
crisis and translated into a temporary wave of turmoil.
Meanwhile, in Greece, discussions commenced about
country's early exit from the international bail-out
programme, with Greece stating its commitment to
cover its financing needs from 2015 onwards on its
own. Market participants reacted by immediately
embedding extra risk premiums in bond prices. Under
the current bail-out programme, the final EC bail-out
payment is scheduled for December 2014, while the
IMF financing is projected to last until the first quarter
of 2016.
Due to geopolitical tensions and concerns about the
euro area economic growth perspective, investors
opted for safer investment opportunities more often;
as a result of it and the low euro area inflation rate,
yields on the German government 10-year bonds
dropped to a historic low (0.75% in mid-October).
In the reporting period overall, the yield on the
respective bonds contracted from 1.36% in June to
0.82% in mid-November. Short-term lending rates
also tended to go down: the yield on the German
government 2-year bonds turned negative (–0.05%
in mid-November). It means that investors, in order
to lend funds to the German government, were ready
for a surcharge. Despite investors anticipating an
eventual increase in the FRS federal funds rate, the
US government bond yields tended to decline as
well. Thus the US government 10-year bond yield
went down from 2.48% in early June to 2.37% in
mid-November. The expected divergence in the euro
area and US central bank monetary policy spurred
a notable widening of the spread between yields on
bonds of these countries (see Chart 2.3).
In the reporting period, yields on government bonds
of euro area peripheral countries were also on a
slightly downward trend (see Chart 2.4). The demand
depended on investors looking for profit earning
opportunities with the minimum likelihood of risk and
speculations that the ECB may take to quantitative
Chart 2.3
YIELDs on german and US 10-YEAR GOVERNMENT
BONDS AND their spreads
(basis points)
Chart 2.4
10-YEAR GOVERNMENT BOND yields OF EURO AREA
PERIPHERAL COUNTRIES
(%)
14. 13
MACROECONOMIC DEVELOPMENTS REPORT
December 2014
easing in the future. The Greek government bonds
were an exception, for their holders were aware of
risks related to the Greece's government plan of early
exit from the international bail-out programme, due to
which the prices of Greek government 10-year bonds
started to fluctuate significantly, and the yield on
bonds increased from 6.2% in early June to 7.9% in
mid-November.
As to Russia and Ukraine, the conflict between the
two was strongly impacting their foreign exchange
rates, making them depreciate. Since the time the
US and the EU imposed sanctions on the banks and
businesses owned by the Russian government by
banning them from the access to the US and European
capital markets, the Central Bank of the Russian
Federation was invested with additional responsibility
to assist local businesses in crisis situations. At
the beginning of the year, the Central Bank of the
Russian Federation made massive interventions in
the domestic foreign exchange market, selling 43.1
billion US dollar worth foreign reserves in the first
five months of the year, which was followed by an
opposite trend in the summer months when foreign
reserves were boosted by 1.5 billion US dollars in
June, with no interventions to come after in July,
August and September. In October and November,
when crude oil prices were falling and western-
sanction-affected Russian businesses, subject to
restricted access to international capital markets,
encountered first debt refinancing problems, the
Russian ruble started to depreciate sharply and the
Central Bank of the Russian Federation resumed its
interventions in the foreign exchange market, selling
foreign reserves worth 26.7 billion US dollars in
October.
In addition in the reporting period, the Central Bank
of the Russian Federation raised the base rate on two
occasions (from 7.5% to 8.0% in July and from 8.0%
to 9.5% in late October) so that to curb inflation,
which was on an upward trend, at 8.3% in October.
The central bank also announced its plans for passing
over to free floating exchange rate by the end of
2014, expanded the national currency's maximum
fluctuation band in August, and abolished the band
and regular interventions in November, maintaining
powers to make ad hoc interventions at any moment if
financial stability is threatened. In the period between
early June and early December, the Russian ruble
depreciated against the euro by 29%, falling by 32%
since the beginning of 2014.
Fuelled by the armed conflict in eastern Ukraine,
Ukraine's hryvnia continued to depreciate. In order
2. Monetary Policy and Financial Markets
15. 14
MACROECONOMIC DEVELOPMENTS REPORT
December 2014
to curb its sharp fall, the National Bank of Ukraine
resumed interventions in the foreign exchange
market after a six-month break in August. The central
bank's capacity to intervene in the foreign exchange
market is limited due to its foreign reserves that have
contracted from 38.4 billion US dollars in 2011 to
12.6 billion US dollars in November 2014. In the
period between early June and early December, the
Ukrainian hryvnia depreciated by 14% against the
euro, falling by 40% since the beginning of 2014.
2.2 Securities market
Supply of Latvian government securities (50 million
euro in June, 35 million euro in July, September
and November, 20 million euro in October) was
reduced at primary auctions; government securities
were not supplied in August (see Chart 2.5).
State budget execution was good. Moreover, the
government had sufficient accrual of funds to repay
the external debt of 1.2 billion euro in 2015 and to
ensure public expenditure during the last months
of 2014. All government securities supplied were
sold. Furthermore, following the introduction of the
negative interest rate on the deposit facility by the
ECB, the demand to supply ratio increased from
3.6 in June to 4.8 in September, 4.4 in October and
5.0 in November. Overall, in June–November the
Treasury supplied 6-month and 12-month Treasury
bills as well as 5-year Treasury bonds. The yield on
12-month Treasury bills shrank from 0.19% in June to
0.07% in November, but the yield on 5-year Treasury
bonds declined from 1.82% in June to 1.22% in
November. Development of interest rates was driven
by the overall trends prevailing in the euro area – the
majority of the euro area countries experienced the
decrease in interest rates.
The bid yield of Latvian government eurobonds
maturing in 2024 issued in the external market in 2014
decreased from 2.80% at the beginning of June to
1.79% in mid-November in the secondary market. The
spread between the above and German government
bonds of the respective maturity contracted from
126 basis points to 98 basis points. The bid yield on
Latvian government bonds denominated in US dollars
and maturing in 2021 declined from 3.31% at the
beginning of June to 3.23% in mid-November (see
Chart 2.6); the spread between the above and that
of US government bonds of the respective maturity
shrank from 136 basis points to 126 basis points. This
trend was similar in all euro area countries.
The tight fiscal policy implemented by the Baltic
Chart 2.5
AUCTIONS OF GOVERNMENT SECURITIES
(millions of euro)
Chart 2.6
Latvian GOVERNMENT BOND bid YIELDS
(%)
2. Monetary Policy and Financial Markets
16. 15
MACROECONOMIC DEVELOPMENTS REPORT
December 2014
States was assessed during the reporting period
when Lithuania issued 12-year government bonds
in international financial markets. The amount of
the issue was 1 billion euro, and the yield was set
as the interest rate on euro swaps of the respective
maturity plus 100 basis points (2.34% on 27
October). The Lithuanian example showed that
further implementation of a conservative fiscal
policy provides an opportunity for the Baltic States
to issue bonds in international financial markets with
a maturity exceeding 10 years and yields sufficiently
attractive for the issuer.
The world's leading share price indices retreated. This
decline was affected by the weak economic indicators
and geopolitical instability. In mid-November,
NASDAQ OMX Riga share price index OMXR went
down by 4.9% in comparison with the beginning of
June, but the Baltic share price index OMXBBGI
decreased by 3.8%. This drop was largely supported
by deceleration of the economic development pace in
Latvia and the EU as a whole which, in turn, was due
to the situation in Ukraine, the ongoing discussions
of the governments of the euro area countries on their
financial situation and on account of the postponement
of austerity measures. The European stock market
index DJ EURO STOXX 50 retreated by 6.1%, the
US stock market index S & P 500 augmented by
6.0%, but the Japanese stock market price index
Nikkei 225 increased by 18.9% until mid-November,
in comparison with the beginning of June (see Chart
2.7) owing to the monetary stimulus provided by the
Bank of Japan and depreciation of the Japanese yen.
2.3 The ECB monetary policy decisions,
Eurosystem operations liquidity and money
market developments
During the reporting period, the Governing Council
of the ECB adopted several decisions to facilitate
development of the euro area economy and stabilise
the price level in the Monetary Union. The Governing
Council of the ECB reduced the key ECB interest
rates to cut interest rates on short-term loans in the
interbank market of the euro area and implemented
additional measures in order to foster credit granting
to the private sector.
The Governing Council of the ECB decided on the
reduction in the key ECB interest rates twice (on
5 June and 4 September) in the reporting period. The
first decrease in interest rates came into effect on
11 June but the second one – on 10 September. The
decision of 5 June lowered the interest rates on the
Chart 2.7
STOCK PRICE INDICES
(1 January 2014 = 100)
2. MONETARY POLICY AND FINANCIAL MARKETS
17. 16
MACROECONOMIC DEVELOPMENTS REPORT
December 2014
main refinancing operations from 0.25% to 0.15%, on
the marginal lending facility – from 0.75% to 0.40%
and on the deposit facility – from 0.00% to –0.10%.
The decision of the Governing Council of the ECB of
4 September cut these interest rates to 0.05%, 0.30%
and –0.20% respectively. A negative deposit facility
rate means that as of 11 June, when it was first cut
to a negative level, credit institutions are obliged to
pay for their excess financial resources kept at the
central bank and exceeding the minimum reserve
requirements. In this way, the ECB encourages credit
institutions having excess financial resources to
lend funds to credit institutions in need of additional
liquidity and to other economic agents.
In addition to the reduction in interest rates, the
Eurosystem discontinued the organisation of fixed-
term deposit tenders, thus increasing excess liquidity.
The ECB announced that it would continue to
organise fixed-rate tenders with full allotment also
in the future as long as necessary but until at least
December 2016.
Following the assessment of the economic situation
in the euro area, the Governing Council of the ECB
decided to implement several additional measures to
improve the monetary policy transmission mechanism
and ensure lending to the economy, thus enhancing
progress of the euro area towards the inflation rate
below, but close to, 2% over the medium term. The
Governing Council of the ECB adopted a decision on
the introduction of TLTRO at its meeting of 5 June.
The Governing Council of the ECB decided to
supplement the TLTRO programme with ABSPP and
CBPP3 at its meeting of 4 September.
TLTRO tenders are organised once every three
months as of September 2014. Overall, eight
TLTRO tenders take place. The first two tenders in
September and December provide an opportunity for
credit institutions to borrow up to 7% of their loans
to the euro area non-financial sector, except loans
to households for house purchase. In turn, during
the next tenders organised until June 2016, credit
institutions will be able to borrow funds three times
exceeding the net increase in their new loans (new
loans minus repaid loans) to the euro area non-
financial sector, except loans to households for house
purchase. The interest rate on the main refinancing
operations plus 10 basis points will constitute the rate
on these loans for credit institutions. Loan maturity of
all these tenders is September 2018. After a two-year-
period, credit institutions will have an opportunity to
make early repayments of their loans; however, they
will have to repay the loans not used for the intended
2. Monetary Policy and Financial Markets
18. 17
MACROECONOMIC DEVELOPMENTS REPORT
December 2014
purpose before their maturity. Initial forecasts
suggested that 1 trillion euro would reach the euro
area economy (400 billion euro as a result of the first
two tenders in September and December and 600
billion euro during the next years) through TLTRO,
but these expectations have decreased following
lower than expected activity at the September tender.
Latvian credit institutions are eligible to apply for
loans up to 560 billion euro at the first two TLTRO
tenders in September and October.
The first TLTRO tender took place in September
when the Eurosystem granted 82.6 billion euro with
maturity of 4 years (1 463 days) at a fixed rate of
0.15% to 255 participants. Latvian credit institutions
attracted 25 million euro at this TLTRO tender.
CBPP3 was already launched in the second half of
October, but ABSPP will commence at the end of
2014. Duration of the two programmes is at least two
years; acquisition of securities will be made in both
the primary and secondary markets. The minimum
credit rating (BBB–/Baa3/BBBl) thresholds set
in compliance with the ECB monetary operation
collateral requirements will be applied to the
securities to be purchased.
The ECB carried out the main refinancing operations
as fixed rate tenders with full allotment and a maturity
of 1 week. Interest of Eurosystem credit institutions
in the main refinancing operations remained quite
steady at the beginning of the reporting period; the
amount allotted in tenders fluctuated within the range
of 94–149 billion euro as in the previous reporting
period. However, activity of credit institutions fell in
the second half of the period following the September
meeting of the Governing Council of the ECB; the
amount allotted at tenders fluctuated within the range
of 83–118 billion euro.
Longer-term refinancing operations with full
allotment and with a maturity of 1 reserve
maintenance period were cancelled, but longer-term
refinancing operations with a maturity of 3 reserve
maintenance periods were organised as usual. In June,
euro area credit institutions attracted 10.4 billion euro,
in July – 6.8 billion euro, in August – 7.2 billion euro,
in September – 11.0 billion euro and in October –
10.2 billion euro through these operations. During the
reporting period, credit institutions continued early
repayment of the funds borrowed in December 2011
and March 2012 when the ECB carried out longer-
term refinancing operations with a maturity of 3 years,
accelerating repayment prior to the TLTRO tender.
At the end of October 2014, banks of the euro area
2. Monetary Policy and Financial Markets
19. 18
MACROECONOMIC DEVELOPMENTS REPORT
December 2014
countries had repaid the ECB 725.1 billion euro or
71% of funding allotted via these operations.
Excess liquidity (the reserve amount of credit
institutions plus the deposit facility minus the
marginal lending facility minus minimum reserve
requirements) in the euro area recorded a minor
decrease during the reporting period compared to the
previous one. The average amount of excess liquidity
fell from the average amount of 117 billion euro in
the previous reporting period to 108 billion euro in
the current reporting period. The abatement of excess
liquidity was primarily on account of the application
of a negative interest rate on the excess funds of credit
institutions deposited with the central bank. However,
the ECB decision on the cancellation of fixed-term
deposit tenders and organisation of the TLTRO
tender had an upward impact on the amount of excess
liquidity.
As a result of the June and September decisions made
by the Governing Council of the ECB, money market
interest rates declined. The fluctuation band and level
of the EONIA index of he interbank interest rate on
overnight loans shrank, approaching zero. During the
previous reporting period, the average EONIA was
0.18%. From 11 June, when the first reduction in the
key ECB interest rates occurred, to 10 September,
when the second downward revision of the key ECB
interest rates took place, the average value of EONIA
reached 0.033%, but from 10 September to mid-
November it turned negative and stood at –0.005%.
A downward trend of 3-month EURIBOR was also
recorded; it decreased from its average value of 0.32%
during the previous reporting period to 0.16% in the
current one, in October reaching a historical low of
the index – 0.079% (see Chart 2.8).
2.4 Lending and deposit rates
In the reporting period, the ECB lowered money
market indices of various maturities by reducing,
on two occasions, the interest rate on the main
refinancing operations, by introducing TLTRO and
new asset purchase programmes. In turn, the falling
money market rates adversely affected interest
rates both on loans and deposits in Latvia. At the
same time, rates on loans had also been effected
by fluctuations of the interest rate spread over the
money market indices. These fluctuations declined
in May–August, but they augmented in September
as the risk premium they contained went up owing to
the increasing uncertainty of political developments
in relations between Russia and Ukraine. Latvia's
2. Monetary Policy and Financial Markets
Chart 2.8
EURO MONEY MARKET INTEREST RATES (%) AND
EXCESS LIQUIDITY IN THE EURO AREA
20. 19
MACROECONOMIC DEVELOPMENTS REPORT
December 2014
activity in the area of legislation also played a role.
The spread between interest rates on new loans and
new deposits remained relatively stable (see Chart
2.9), ensuring positive profits to credit institutions
from interest income and expenditure.
As a result of the monetary policy implemented by
the ECB in the euro area, interest rates on new euro
loans to non-financial corporations and households
and those on new euro deposits received from non-
financial corporations and households decreased for
the majority of loan and deposit instruments in June–
September. Substantial differences still exist among
interest rates on loans applied across the euro area
countries (see Chart 2.10). Interest rates on loans and
deposits are higher in countries with weaker economic
development and excessive debt burden.
In May–August, the weighted average interest rate on
new loans to resident non-financial corporations and
households declined from 4.9% to 4.2% in Latvia,
but in October it returned to the level of 4.7%. The
dynamics of the weighted average interest rate on new
loans to non-financial corporations and households
were driven by development of interest rates on new
loans granted to non-financial corporations. The
above interest rate decreased from 4.4% in April to
3.6% in August and increased to 3.8% in October
(see Chart 2.11). The dynamics were also fuelled by
the contraction of the share of loans to non-financial
corporations in the total amount of new loans to
households and non-financial corporations. In April–
October, the weighted average interest rate on new
loans to households for house purchase went down
from 3.4% to 3.3%, but the weighted average interest
rate on consumer credit and other loans to households
fell from 15.7% to 13.9%.
Development of interest rates on new euro loans to
non-financial corporations can mainly be explained by
changes in interest rates on sizeable loans (exceeding
1 million euro). In May and June, the weighted
average interest rate on new high volume loans to
non-financial corporations had decreased even below
3% (2.5% and 2.9% respectively); however, in July–
October, it increased again reaching 3.4%. Interest
rates on new small and medium-volume euro loans
(up to 250 thousand euro and from 250 thousand euro
to 1 million euro) initially tended to go down, but
in October they augmented again. In April–October,
the weighted average interest rate on new small euro
loans edged up from 4.9% to 5.1%, but it remained
substantially unchanged on medium-volume loans
(4.7% and 4.6% respectively). The minor reduction
2. Monetary Policy and Financial Markets
Chart 2.9
SPREAD BETWEEN INTEREST RATES ON NEW LOANS
AND NEW DEPOSITS
(percentage points)
Chart 2.10
INTEREST RATES ON MFI new loans in EURO to
non-financial corporations
(%)
Chart 2.11
INTEREST RATES ON MFI new SHORT-TERM LOANS
IN euro*
(%)
* Floating interest rates and interest rates with an initial interest rate
fixation period of up to 1 year.
21. 20
MACROECONOMIC DEVELOPMENTS REPORT
December 2014
in interest rates on new euro loans to households
for house purchase is mainly related to the decline
in money market indices. In turn, the interest rates
on new consumer credits and other loans in euro to
households decreased significantly as several credit
institutions serviced study and student loans, and the
share of loans granted by the credit institutions, which
usually set relatively higher interest rates, diminished
in the total amount of new consumer credits and other
loans to households.
The accommodative monetary policy implemented by
the ECB could exert a downward pressure on interest
rates on loans in the future since the necessity of
granting new loans to fulfil the TLTRO requirements
can lead to increased competition among credit
institutions in lending to non-financial corporations.
At the same time, the introduction of the so-called
clause of returned keys following the adoption of the
amendments to the Insolvency Law could facilitate
further tightening of credit standards for household
loans for house purchase.
Interest rates on new euro deposits received from
non-financial corporations and households gradually
decreased due to downward dynamics of money
market indices. The weighted average interest rate on
fixed-term deposits attracted from households in euro
with a maturity of up to 1 year shrank from 0.35% in
April to 0.33% in October, while that on fixed-term
deposits received from non-financial corporations
went down from 0.24% to 0.05%. The weighted
average interest rate on new fixed-term deposits
attracted from households in euro with a maturity
of up to 1 year augmented from 1.3% in April to
2.0% in October as several credit institutions offered
more favourable terms and conditions for long-term
deposits in the third and fourth quarters. Attraction
of longer-term deposits enables credit institutions
to reduce the interest rate risk and ensure higher
financing stability.
2.5 Dynamics of domestic loans and deposits
Following the downward trend in April and May,
money supply indicators in June–August reversed
again and after a marginal contraction in September,
they continued to increase in October. Consequently,
deposits with credit institutions exceeded both the
level reached in March (by 0.8%) and that of October
2013 (by 9.1%). Loans granted by credit institutions
continued to decline in April–June as loans to non-
financial corporations and households diminished
further; however, the contraction of the loan portfolio
moderated, but in August and September the total
2. Monetary Policy and Financial Markets
22. 21
MACROECONOMIC DEVELOPMENTS REPORT
December 2014
2. Monetary Policy and Financial Markets
Chart 2.12
LATVIA'S CONTRIBUTION TO THE EURO AREA MONEY
SUPPLY
(billions of euro)
Chart 2.13
ANNUAL RATE OF CHANGE IN RESIDENT DEPOSITs
(%)
Chart 2.14
ANNUAL RESIDENT DEPOSIT dynamics
(billions of euro)
outstanding loans already posted a rise. Although the
aggregate loan portfolio contracted again in October,
the annual rate of decrease in loans improved from
8.7% in March to 5.3% in October.
As regards Latvia's contribution to changes of the
monetary aggregate M3 of the euro area, overnight
deposits made by residents of the euro area with
Latvian credit institutions in April–October
augmented by 4.5% and deposits redeemable at notice
of up to 3 months rose by 14.7%, while deposits with
an agreed maturity of up to 2 years declined by 16.0%
(see Chart 2.12 for developments in deposits).
A pick-up in household deposits was driven by an
upward trend in domestic deposits as the population's
precaution grew and thereby resulted in growth of
savings. They increased by 6.2% in April–October
(the annual rate of increase in October was 14.0%),
but deposits of non-financial corporations shrank by
3.7% during this period (the annual rate of increase
in October was 4.7%; see Charts 2.13–2.15), with
exports stagnating and economic growth decelerating.
Non-resident non-MFI deposits surged by 12.3% in
the above period (see Charts 2.16 and 2.17).
23. 22
MACROECONOMIC DEVELOPMENTS REPORT
December 2014
Chart 2.15
ANNUAL RATE OF CHANGE IN RESIDENT DEPOSITs
(%)
Chart 2.16
non-mfi deposit dynamics
(billions of euro)
Chart 2.17
CREDIT INSTITUTION FOREIGN LIABILITIES
(billions of euro)
2. Monetary Policy and Financial Markets
24. 23
MACROECONOMIC DEVELOPMENTS REPORT
December 2014
Chart 2.18
ANNUAL RATE OF CHANGE IN LOANS TO RESIDENTS
(%)
Chart 2.19
MONTHLY CHANGE IN LOANS TO RESIDENT
HOUSEHOLDS AND NON-FINANCIAL CORPORATIONS
(millions of euro)
Chart 2.20
STRUCTURE OF CHANGES IN DOMESTIC LOAN
PORTFOLIO
(millions of euro)
Reaction of Latvian credit institutions to the June
decision of the Governing Council of the ECB on
setting negative interest rates on deposits with central
banks of the euro area during the first months of the
operation of this decision did not imply a change
in lending trends as credit institutions placed their
excess funds with foreign credit institutions and
invested them in government and corporate debt
securities rather than in loans to real economy. Thus,
the structure of credit institutions' assets changed;
however, domestic loans continued their slow
downward trend. In April–July, the domestic loan
portfolio of credit institutions declined by 1.0% and
in October – by 0.5%, while August and September
saw credit growth, and in October the annual rate of
decrease in loans was the lowest since May 2013 (see
Chart 2.18). Overall, in April–October, loans granted
both to households and non-financial corporations
declined by 2.8% and 2.2% respectively (see Chart
2.19), while loans to financial institutions increased
by 38.8% during this period. In October, the annual
rate of decrease in loans to financial institutions and
non-financial corporations fell to 3.6% but that of
loans to households dropped to 7.4%. The contraction
of loans for house purchase continued to contribute
to the decrease in the level of household debt, while
consumer credit increased during five of the last six
months. At the end of October, 95.2% of all domestic
loans were granted in euro and 4.8% – in foreign
currencies.
In April–September, loan investment climbed in
several sectors of the economy, including individual
subsectors of manufacturing (manufacture of chemical
substances, fabricated metal products, textiles and
printing), in crop and animal production, mining,
construction, real estate activities, postal activities,
information services and, to a quite significant
extent, in several areas of financial services. In turn,
credit investment in forestry, manufacture of food
products and beverages as well as wood and furniture,
energy, trade and storage, land and water transport
considerably shrank (see Charts 2.20 and 2.21).
2. Monetary Policy and Financial Markets
25. 24
MACROECONOMIC DEVELOPMENTS REPORT
December 2014
Chart 2.21
CHANGES IN LOANS TO RESIDENTS
(millions of euro)
Chart 2.22
RESIDENT LOANS TO GDP
(%)
Chart 2.23
RESIDENT LOAN TO DEPOSIT RATIO
With loan reduction slowing down, the ratio of loans
to GDP declined only slightly from 55.6% in the
first quarter to 54.7% in the second quarter and to
54.3% in the third quarter (see Chart 2.22). Since the
total resident deposits remained basically unchanged
and the loan portfolio stabilised, the ratio of loans
to residents and resident deposits remained almost
stable, i.e. 1.46 in March and 1.43 in October (see
Chart 2.23).
The euro area has already been showing signs of
lending recovery for several months. The annual rate
of decrease in MFI loans to the private sector was
1.2% in September (1.8% in June, 2.2% in March).
The contraction of loans to non-financial corporations
decelerated in a similar manner: it was 2.0% in
September (3.1% in March), although household
lending indicators deteriorated slightly.
With risks still present in external markets and
income from exports shrinking, a considerable rise
in deposits by non-financial corporations cannot be
expected; however, the wish of households to create
security deposits with credit institutions will, most
likely, increase both deposits by private individuals
and the total deposits. According to the October bank
lending survey data, credit standards applied to non-
financial corporations remained broadly unchanged
in the third quarter, and there are no plans to alter
them significantly also in the fourth quarter. Although
lending indicators in recent months were better than
expected and are likely to stay at this level until the
end of the year, lending in 2015 will improve at a
slower rate. It is expected that mortgage lending
in Latvia will be hampered by precaution arising
from external risks along with the impact of the
amendments to the Insolvency Law and the poor state
of the legal environment in the area of insolvency.
The decisions adopted by the Governing Council of
the ECB aimed at facilitating lending will fail to fully
offset the above hindrances.
2. Monetary Policy and Financial Markets
26. 25
MACROECONOMIC DEVELOPMENTS REPORT
December 2014
3. Domestic Demand
In the second and third quarters, Latvia's GDP
growth remained positive, albeit with a downward
trend. In the second quarter, GDP increased by 0.8%
quarter-on-quarter in seasonally non-adjusted terms
and by 3.3% year-on-year (see Chart 3.1), while the
third quarter saw GDP increases of 0.5% and 2.4%
respectively.
Considering the effects of the Russian–Ukrainian
conflict, the GDP growth rate in the second and third
quarters should be viewed as decent. However, there
are doubts as to its sustainability, since it is mainly
based on the pick-up in private consumption (see
Chart 3.2) which alone cannot provide for growth in a
small, open economy in the long run.
Following the introduction of sanctions in August,
pessimism rose almost in all segments: the consumer,
industrial, retail trade and services confidence
indicators deteriorated. However, the situation
improved slightly again in October and November.
The Russian import ban did not exert a material direct
impact on the foreign trade; however, deteriorating
confidence indicators may trigger caution among
consumers and investors. With households becoming
more cautious, the increase in private consumption,
having been the main driver of economic growth in
the first three quarters of 2014, may start to decelerate.
At present, however, the weak investment dynamics
is the major concern, as it is adversely affected by
the geopolitical background, cancelling the potential
positive effect of the euro changeover as well.
3.1 Private consumption and investment
In 2014, both the employment rate and the average
wages and salaries continued to rise, thereby also
supporting the private consumption growth. In the
second quarter, GDP also grew mostly on account
of private consumption posting a 2.5% increase and
contributing 1.6 percentage points to GDP growth
(see Charts 3.3 and 3.4). Judging by the retail trade
growth, data on registered vehicles (see Chart 3.5) and
other preliminary indicators, it could be concluded
that private consumption would have retained a
leading position in the third quarter as well. GDP
data confirm this assumption: private consumption
expanded by 1.4% and contributed 0.8 percentage
point to GDP growth.
3. Domestic Demand
Chart 3.1
CHANGES IN GDP
(at constant prices; %)
Chart 3.2
contribution to ANNUAL CHANGES IN GDP
(demand side; percentage points)
Chart 3.3
CHANGES IN GDP AND PRIVATE CONSUMPTION
(year-on-year; %)
27. 26
MACROECONOMIC DEVELOPMENTS REPORT
December 2014
In the previous heating season the warm weather
conditions enabled households to save on heating
expenses, stimulating higher spending in other areas.
In this season heating expenses are most likely to
move up. Due to the opening of the electricity market
in 2015, the energy prices are expected to rise, having
an adverse effect on the purchasing power of the
population. However, this impact will not be strong on
account of state benefits envisaged to offset the above
increase in prices. Despite a rise in expenditure related
to housing maintenance, the purchasing power will
continue to improve along with the disposable income
growth both on account of growing wages and salaries
and slightly increasing old age pensions. Pension
indexation took place in October, and for the first time
it was linked to the changes in average wages and
salaries. The next pension indexation will take place
in a year.
The increasing disposable income notwithstanding,
the consumer confidence indicator deteriorated
notably in the third quarter (see Chart 3.6). On
account of the geopolitical uncertainties, slow
recovery of the EU economies and other reasons, the
population remained cautious and built up savings
by slightly reducing consumption. Improvement in
consumer confidence in October and November gives
hope that caution may recede in the future.
3. Domestic Demand
Chart 3.4
Indicators characterising consumption
(consumer confidence, net responses; 2010 = 100; %)
Chart 3.5
NUMBER OF vehicles NEWLY REGISTERED WITH
THE ROAD TRAFFIC SAFETY DiREcTorate
(thousands)
Chart 3.6
CONSUMER CONFIDENCE AND UNDERLYING
FACTORS
(net responses; percentage points)
28. 27
MACROECONOMIC DEVELOPMENTS REPORT
December 2014
Chart 3.7
Indicators characterising investment
(at constant prices; 2010 = 100; %)
Chart 3.8
CONTRIBUTION OF PRIVATE AND GOVERNMENT
INVESTMENT TO GDP
(%)
Investment growth remained weak in the reporting
period, with its volume increasing by 1.2% and
decreasing by 1.2% year-on-year in the second and
third quarters respectively (see Charts 3.7 and 3.8).
The risk appetite of businesses and their willingness
to invest in further business expansion moderated
primarily on account of external economic factors.
Although total investment remained broadly
unchanged for several quarters, investment in imports
of capital goods (including equipment and machinery)
and construction of engineering structures decreased,
while it was attracted in the construction of buildings
where a relatively rapid growth was recorded. Hence,
the structure of fixed assets changed.
In the first half of the year, the construction of
buildings was facilitated by a number of domestic
factors, the impact of which was less significant in the
third quarter.
1. The amendments to the Immigration Law (in effect
as of 1 September) stipulate higher requirements1
for
granting temporary residence permits. Hence a desire
to manage to provide housing space for purchase on
lower terms to the persons potentially interested in
receiving a temporary residence permit facilitated
the construction of residential buildings. Preliminary
data already suggest changes in the real estate market
activity: until 1 September 2014 the real estate market
saw increased activity, followed by its significant
moderation (in particular that of non-residents).
2. In the construction sector, more accelerated
growth was recorded in the construction and repair
of schools. EU funds play an important role in this
segment; however, the activity related to the granting
of funds may have been facilitated by the upcoming
election of the Saeima (Parliament) of the Republic
of Latvia, serving the politicians as a means to show
their influence. School repairs are usually planned to
be finished by the beginning of the academic year on
1 September. Hence, the activity in this segment is
likely to decline again towards the close of the year.
3. A more accelerated activity in the construction
of hotels was also observed. This may be related to
an increase in demand: the tourist flow continues to
intensify, inter alia, due to the status of Riga as the
1
The main amendments to the Immigration Law: the minimum value
of a functionally interconnected, built-up real estate (no longer a sum
of several real estate properties) is raised from 142 300 euro in the
region of Riga and from 71 150 euro in the rest of the territory of
Latvia to a single defined limit: 250 000 euro. In addition, the cadastral
value shall be no less than 80 000 euro. When requesting the first
temporary residence permit, a payment to the general government
budget shall be made in the amount of 5% of the real estate value.
3. Domestic Demand
29. 28
MACROECONOMIC DEVELOPMENTS REPORT
December 2014
Chart 3.9
NON-FINANCIAL INVESTMENT BY SECTOR
(% of total non-financial investment)
Chart 3.10
ACCRUED BALANCE OF THE CONSOLIDATED
GENERAL GOVERNMENT BUDGET BY level
(millions of euro)
European Capital of Culture in 2014 and the Latvian
Presidency of the EU Council in the first half of 2015.
The level of investment (as before) was supported by
the investment projects financed from the EU funds,
implemented in the second quarter at a particularly
rapid pace. It is the EU funds that could be the
primary driver of investment growth in the fourth
quarter when some of the above driving factors for the
construction of buildings will no longer be relevant.
Investment in industry is an important factor to regain
accelerated growth (see Chart 3.9); however, due to
the geopolitical background, this sector poses the
major concern. The external environment uncertainty
notwithstanding, businesses have announced several
new investment projects which are likely to facilitate
both the development of the construction sector and
imports of new machinery in the coming quarters.
Although in the short run imports of capital goods
have a negative impact on the actual GDP growth,
the potential GDP will increase, creating additional
opportunities for boosting exports.
3.2 Government expenditure and budget
According to the official information by the
Treasury, the balance sheet of the consolidated
general government budget, estimated on the cash
flow basis, improved considerably in the second
quarter, but the revenue excess over the expenditure
was less pronounced in the third quarter. Cash
flow was significantly affected by the volatility in
the income from the foreign financial aid (e.g., the
foreign financial assistance accounted for more than
16% of income and 9% of income in the second
and third quarters respectively). As a result of the
foreign financial assistance flows, the balance of
the central government basic budget improved
rapidly since June (see Chart 3.10). The revenue and
expenditure, accumulated in the first nine months of
2014, amounted to 6 450.7 million euro and 6 136.1
million euro respectively (year-on-year increases of
1.4% and 2.4% respectively), resulting in a surplus
of 314.6 million euro, which represented a year-on-
year decrease of 57.5 million euro due to a more
accelerated rise in expenditure.
In the first nine months of 2014, the consolidated
general government budget revenue increased by
190.3 million euro or 1.4% year-on-year. In the first
three quarters, the rise in revenue was volatile on
account of the foreign financial assistance flows,
posting a high in June, whereas their amount, received
in the third quarter, represented a considerable year-
on-year decline.
3. Domestic Demand
30. 29
MACROECONOMIC DEVELOPMENTS REPORT
December 2014
Chart 3.11
SELECTED TAX REVENUE
(January–September; millions of euro)
In the second quarter, a stable rate of increase in tax
revenue persisted, accelerating in the third quarter and
reaching annual growth of 4.0% in September. The
increase in tax revenue was based on the VAT revenue
which expanded by 8.5% in annual terms in the first
nine months of 2014 (see Chart 3.11). The rapid
growth of the net VAT revenue was largely facilitated
by smaller refunds of the overpaid VAT in January
(they were partially reimbursed in December 2013).
In turn, the rise in the gross VAT revenue was more
in accord with the domestic consumption growth,
moving up 3.7% in the first nine months of the year.
A higher-than-expected increase in wages and salaries
was reflected by the rise in taxes on labour: revenue
from personal income tax grew by 3.3% in the first
nine months of the year, while the rate of change
in the social security contributions was positive
since July2
. Beginning with the second quarter, the
impact of the rise in remuneration offset the one-off
fall in the revenue from taxes on labour recorded in
January (due to the early payments of the taxes on
labour in December 2013). The growth rate of taxes
on labour moderated on account of the tax policy
changes introduced in 2014 when the social security
contribution rate was lowered and the personal
income tax relief was raised.
Excise tax revenue improved in the second and third
quarters, providing for a small positive contribution to
the total revenue growth. As regards revenue from real
estate tax, a reverse trend was observed as the increase
achieved in the first quarter resulting from timely tax
payments for the entire year contracted. After April,
the growth rate of the revenue from corporate income
tax plummeted on account of larger refunds during
this period, and the revenue from corporate income
tax posted a year-on-year fall in the first nine months
of the year.
As to the dynamics of non-tax revenue, in the first
nine months of 2014 it lagged behind considerably
(by 64.9 million euro) the indicators recorded in the
corresponding period of the previous year. The budget
plan for 2014 envisaged lower revenue in view of the
expected fall in the profit of state capital companies
for 2013. Moreover, some of the companies were
granted a permit not to pay dividends in 2014. The
drop in non-tax revenue was also due to a lower-than-
expected revenue from the trading in state-owned
emission allowances.
2
The increase in net revenue from social security contributions in
the first four months of 2014 moderated on account of a higher rate of
contributions to the second pillar of pension funds in comparison with
the corresponding period of the previous year.
3. Domestic Demand
31. 30
MACROECONOMIC DEVELOPMENTS REPORT
December 2014
Chart 3.12
RATE OF CHANGE IN CONSOLIDATED GENERAL
GOVERNMENT BUDGET EXPENDITURE
(year-on-year; %)
After the first quarter, the increase in the expenditure
of the consolidated general government budget (see
Chart 3.12) accelerated reaching 145.6 million euro
or 2.4% in the first nine months of the year. The rate
of change of all key expenditure items picked up,
except interest payments and payments to the EC
budget. The rise in expenditure was still driven by
the remuneration expenditure (an increase of 6.5%),
affected by the raising of the minimum wage and
converging the lowest salaries in the public sector, as
well as by a 4.2% increase in the subsidy and grant
expenditure. Expenditure on goods and services
was slightly lower year-on-year; however, given the
budget plan, it is expected to rise in the future. In the
first nine months of the year, the investment made in
the fixed capital formation was 3.4% smaller year-on-
year. However, considering the budget plan and the
expected drawdown of the EU-funds related projects,
an increase is anticipated in this expenditure category
towards the end of the year. With the average levels
of pensions disbursed growing and high numbers of
beneficiaries of the unemployment benefit persisting,
the increase in the expenditure on social benefits
accelerated, reaching 1.8% in September.
At the end of September 2014, the general
government debt totalled 8 962.8 million euro on a
cash flow basis (37.1% of the forecast GDP; estimated
as 40.3% of the forecast GDP for 2014 according to
ESA 2010 methodology). Since March, the general
government debt had increased by 819.0 million euro.
The amount of the external debt also had expanded by
754.9 million euro since March, while the domestic
debt grew by 64.1 million euro. The external debt
increased primarily on account of the issue of
government bonds in the international financial
markets in April. The funds generated by the issue are
planned to be used to cover general financing needs,
inter alia, for the repayment of the EC loan scheduled
for January 2015. Moreover, government foreign
bonds in the amount of 400 million euro matured in
April. The external debt value in terms of euro also
rose as a result of the US dollar appreciation observed
since March.
3. Domestic Demand
32. 31
MACROECONOMIC DEVELOPMENTS REPORT
December 2014
4. Aggregate Supply
4. Aggregate Supply
The economic growth continued in Latvia in the
second and third quarters. In the second quarter this
development was on account of construction, trade
and also public utilities. Transportation and storage
sector also recorded expansion on an annual basis.
At the same time, energy contributed negatively to
GDP due to warm winter. Value added also shrank
in real estate activities, partly on account of the
declining demand by non-residents as a result of
the Russian–Ukrainian conflict. In the third quarter,
however, real estate activities were one of the main
drivers of the growth, possibly due to the expected
amendments to the regulations for granting temporary
residence permits. As in the second quarter, trade and
transportation contributed notably to the growth also
in the third quarter. Agriculture and forestry were
the major negative contributors, and value added of
manufacturing also shrank in the third quarter.
4.1 Industry and construction
In the second quarter, the value added of
manufacturing (seasonally adjusted) at constant prices
recorded a year-on-year increase of 1.3%. At the same
time, the value added of manufacturing recorded a
quarter-on-quarter rise of 0.8% in the second quarter,
albeit shrank by 0.3% in the third quarter. The
value added of manufacturing recorded a year-on-
year decline of 0.6% in the third quarter; hence its
contribution to the annual GDP growth was negative.
The volume of output in manufacturing at constant
prices grew in the second quarter by 3.7% quarter-
on-quarter and increased by 1.8% year-on-year (see
Chart 4.1). In the second quarter, expanding output in
the manufacture of computer, electronic and optical
products (by 22.1%) and woodworking (by 1.8%)
was the major positive driver of the development of
manufacturing quarter-on-quarter, and contribution of
the above sectors remained positive also in the third
quarter (a pickup of 22.4% and 2.3% respectively).
Output shrank in the manufacture of textile articles
and wearing apparel in the second quarter. The
declining output of the manufacture of food products
(by 1.8%) observed in the third quarter might be
attributable to Russia banning imports; however,
the narrowing manufacture of non-metallic mineral
products (by 6.0%) exerted the largest negative impact.
In the third quarter overall, manufacturing output
recorded a moderate rise quarter-on-quarter (0.9%),
albeit it shrank somewhat year-on-year (by 0.6).
Chart 4.1
DYNAMICS OF MANUFACTURING OUTPUT
(at constant prices; %)
33. 32
MACROECONOMIC DEVELOPMENTS REPORT
December 2014
In the second and third quarters, the manufacture
of wood and of products of wood and cork as well
as that of computer, electronic and optical products
was the major positive contributor to the expansion
of manufacturing year-on-year, whereas the Russian
market related subsectors (the repair of machinery
and equipment and manufacture of wearing apparel,
beverages and textiles) exerted negative impact on
growth (see Chart 4.2 for the annual changes in
industrial output in the first nine months of 2014).
Although the JSC Liepājas Metalurgs terminated
operation in the second quarter of 2013, the
developments in the manufacture of basic metals
continued to contribute negatively to the annual
growth of manufacturing both in the second and third
quarters. Manufacture of food products – one of the
major drivers of manufacturing so far – still recorded
a rise in the second quarter, albeit output declined in
the third quarter. August was the first month since the
end of 2012 reporting a negative annual output growth
rate of food products.
In the second quarter, the turnover in manufacturing
at current prices shrank by 1.3% quarter-on-quarter,
but increased by 2.2% year-on-year. At the same time,
the above turnover shrank in the third quarter both
in quarterly and annual terms (by 1.4% and 2.8%
respectively). The turnover in the external market,
following a deceleration observed for four quarters,
improved somewhat (by 1.7%) in the second quarter
in annual terms and remained broadly unchanged
in the third quarter, possibly due to Russia banning
imports. On the domestic market, the turnover rose by
2.6% in the second quarter while in the third quarter
the above turnover shrank buoyantly (by 5.1%).
The industrial confidence indicator of manufacturing
companies aggregated by the EC for the second
quarter was 1.9 point lower quarter-on-quarter. It
was primarily on account of a lower assessment of
output volume for the coming months and also an
improving assessment of the inventories of finished
goods. Export order assessment also deteriorated
somewhat. In the third quarter, business sentiment
in manufacturing remained unchanged quarter-on-
quarter. Although the assessment of the inventories
of finished goods continued to improve, this
development was offset by a higher assessment of
output volume for the coming months. Moreover,
export order assessment improved slightly despite the
unstable situation in the external environment. The
signals from Latvia's business surveys regarding the
third quarter could be deemed quite positive, since
confidence deterioration was expected in view of the
Chart 4.2
ANNUAL INDUSTRIAL OUTPUT CHANGES IN THE
FiRst NINE months OF 2014
(working-day adjusted; %)
4. Aggregate Supply
34. 33
MACROECONOMIC DEVELOPMENTS REPORT
December 2014
sluggish economic growth of the euro area and the
Russian–Ukrainian conflict.
Production capacity utilisation projected in
manufacturing for the third quarter decreased
somewhat (to 72.0%; see Chart 4.3) and that
projected for the fourth quarter rose to 73.3%. It is
a historically very high level and points to the need
of investment inflows. In the breakdown by sector,
production capacity utilisation was high in the
following sectors of the economy: the manufacture of
wood and of products of wood and cork (79.0%) and
basic pharmaceutical products and pharmaceutical
preparations (79.7%). At the same time, low
production capacity utilisation has been projected in
the manufacture of food products (66.6%) and non-
metallic mineral products (62.2%).
In the EC survey, businesses reported the lack of
demand as the primary growth-restrictive factor of
manufacturing in the third and fourth quarters (see
Chart 4.4). Businesses in manufacturing were less
concerned about the lack of equipment in comparison
with the previous period. In the fourth quarter, the
number of businesses identifying no substantial
constraint for the production was an-all time high. In
October, the Latvian business confidence indicators
of manufacturing deteriorated slightly in comparison
with September, whereas in November the above
indicators improved again.
Following a rapid acceleration observed in the first
quarter, construction continued on an upward path
also in the second quarter, albeit its growth rate shrank
in the third quarter. In the second quarter, the value
added of the construction sector (seasonally adjusted)
recorded a year-on-year rise of 12.4% and an increase
of only 4.1% in the third quarter. A quarter-on-quarter
increase in value added of construction amounted
to 0.1% in the second quarter, whereas in the third
quarter the above value added decreased by 1.3%.
In the second quarter, construction output at current
prices rose by 16.2% year-on-year and increased only
by 0.2% in the third quarter. As in the first quarter,
construction of non-residential buildings accounted
for the major contribution to the annual growth in
the second and third quarters (14.4 percentage points
and 9.7 percentage points respectively; see Chart
4.5). A particularly notable positive contributor
to the segment was the construction of schools,
universities and research institutions. Expanding
construction of dwelling houses might be on account
of the amendments made to the Immigration Law
in relation to the granting of temporary residence
Chart 4.3
PRODUCTION CAPACITY UTILISATION IN
MANUFACTURING
(%)
Chart 4.4
GROWTH-RESTRICTIVE factors IN
mANUFACTURING
(% of replies from respondents)
Chart 4.5
CONTRIBUTION OF SOME TYPES OF CONSTRUCTION
objects TO ANNUAL CONStRUCTION GROWTH AT
CURRENT PRICES
(percentage points)
4. Aggregate Supply
35. 34
MACROECONOMIC DEVELOPMENTS REPORT
December 2014
4. Aggregate Supply
permits (contribution in the second quarter –
6.7 percentage points and in the third quarter –
2.6 percentage points). The expansion of the above
segment was attributable to the construction of
residential buildings in the second quarter and to the
construction of double-apartment houses in the third
quarter. Meanwhile, the construction of engineering
structures accounted for a negative contribution to
the growth of construction (–5.0 percentage points
and –12.1 percentage points respectively). As regards
the segment of engineering structures, the largest fall
was observed in the construction of ports and dams
in the above two quarters. Moreover, the construction
of motorways and roads as well as other engineering
structures also declined buoyantly in the third quarter.
The construction confidence indicator assessed
by the EC declined by 2.4 percentage points and
2.5 percentage points respectively in the second
and third quarters. This development of the above
two quarters was mainly on account of a sharply
deteriorating assessment of employment expectations
for the next three months. Builders primarily pointed
to a lack of demand (40.2%) and weather conditions
(21.2%) as the constraint on business growth.
29.1% of builders did not identify any construction
hampering factors (a historical high in quarterly
terms). In October the construction confidence
indicator deteriorated rapidly, albeit improved
somewhat in November. The share of businesses
identifying no constraint on business enhancement
increased in November and the share of builders who
deemed the demand to be an activity hampering factor
declined.
4.2 Services
Public utilities, trade and transportation and storage
were the major positive contributors to GDP growth
in the second and third quarters (see Chart 4.6 for the
changes in value added of the main types of services).
Real estate activities and financial services also
accounted for a large positive contribution in the third
quarter.
Retail trade turnover remained volatile in the second
quarter (see Chart 4.7): the spending increased in
April due to warm Easter holidays, albeit it narrowed
in May and June. At the same time, a notably
expanding retail trade, the sales of motor vehicles in
particular, was observed in the third quarter. In the
second quarter, the retail trade turnover (including the
sales of motor vehicles) increased by 3.8% year-on-
year and rose by 3.6% in the third quarter. At the same
Chart 4.6
CHANGES IN VALUE ADDED BY MAIN TYPES OF
SERVICES
(year-on-year; non-adjusted data; %)
36. 35
MACROECONOMIC DEVELOPMENTS REPORT
December 2014
time, the retail trade turnover rose by 1.2% and 2.3%
(including the sales of motor vehicles) in the second
and third quarters respectively. Buoyant growth rate
of the second quarter is primarily attributable to the
volatility of demand associated with the introduction
of the euro, contributing to the contained spending
at the beginning of the year, as well as the impact
of Easter holidays. Meanwhile, the growth in the
third quarter can be considered as the return to a
more stable gradual increase on account of a rising
disposable income rather than one-off factors. The
impact of one-off factors is not fully excluded, for
instance, a rapidly rising number of tourists has been
observed in 2014, associated in particular with the
status of Riga as the European Capital of Culture. The
third quarter is a peak of the tourist season; hence the
spending by foreign visitors also had a positive impact
on the point of sale revenue.
In the second and third quarters, the value added
of the transportation and storage sector (seasonally
adjusted) rose by 2.7% year-on-year (see Chart 4.8
for the annual changes in freight turnover by main
types of freight traffic). The value added of the sector
recorded a quarter-on-quarter decline of 0.2% in the
second quarter and an increase of 0.6% in the third
quarter.
The volume of cargoes loaded and unloaded at
Latvia's ports in the second quarter recorded an
overall expansion of 2.1% year-on-year. The situation
improved at all ports, excluding Ventspils port (a
decline of 11.0%). An increasing volume of overall
cargo traffic was attributable to the growing volume
of cargoes loaded and unloaded at Riga port (12.7%;
mainly oil products). Volume also expanded by 6.2%
at Liepāja port. In contrast to the developments of
the first two quarters when improving performance
was observed at ports, a declining volume of
cargoes loaded and unloaded was recorded again
in the third quarter (2.2%). The volume of cargoes
shrank only at Ventspils port (by 21.4%) in the third
quarter, however, an increasing volume at Riga
port, Liepāja port and small ports (9.7%, 6.5% and
10.4% respectively) could not offset the above fall.
Deterioration performance of the sector is associated
with the channelling of Russia's oil and coal cargoes
from the ports of Latvia (Ventspils port in particular)
to other transit corridors.
The turnover of rail freight (indicator based on the
distance covered and freight weight) shrank by 1.3%
in the second quarter and narrowed by 6.4% in the
third quarter. The turnover of international freightage
Chart 4.7
BREAKDOWN BY CHANGES IN RETAIL TRADE
TURNOVER
(changes in millions of euro in comparison with January 2013)
Chart 4.8
ANNUAL CHAnGES IN FREIGHT TURNOVER BY MAIN
TYPES OF FREIGHT TRAFFIC
(%)
4. Aggregate Supply
37. 36
MACROECONOMIC DEVELOPMENTS REPORT
December 2014
4. Aggregate Supply
increased in the second quarter, albeit declined in
the third quarter. At the same time, the turnover of
domestic freight shrank in the second quarter and, in
turn, edged up notably in the third quarter.
The volume of rail freight (indicator based on the
freight weight only) posted a year-on-year rise of
1.3% in the second quarter. This development was
attributable to an expanding volume of freight imports
(of 1.7%; freight transported by rail into Latvia;
88% of the total volume of rail freight). The volume
of freight exports (freight transported by rail from
Latvia) also recorded an increase by 25.5% while
that of freight transit (freight transported across the
territory of Latvia by rail and not loaded into and
unloaded from other types of transport) declined by
35.4%. Freight volume shrank by 3.0% in the third
quarter. The volume of import, export and transit
freights fell by 0.6%, 7.1% and 39.6% respectively.
In the second quarter, the volume of freight traffic by
road increased by 8.0% year-on-year and turnover
of freight traffic by road (indicator based on the
distance covered and freight weight) rose by 11.7%.
The growing turnover of international freight traffic
by road and expanding turnover of domestic road
freight (by 12.3% and 9.1% respectively) contributed
to an overall annual expansion. In the third quarter,
the volume of freight traffic by road grew modestly
(by 0.5%). Such a subdued increase in the volume of
freight traffic by road is likely to be attributable to the
sanctions imposed by Russia since agricultural and
food products are primarily transported by road.
4.3 Labour market
The purchasing power of the average monthly
wage and salary returned to its pre-crisis level. The
acceleration in the increase of wages in the first
quarter was underpinned by several one-off factors,
inter alia, the rise in the minimum wage and salary,
the easing of the tax burden on labour and the wage
round-up at the euro changeover. The impact of
one-off factors was stronger in the private sector
(see Chart 4.9). In the second quarter, the quarterly
rate of increase (seasonally adjusted) in the average
wage and salary was again similar to that observed
previously, thus mitigating the concerns about the
upward trend in the wage-inflation spiral. However,
due to the impact of the first quarter data, the rise in
the wage and salary will exceed the increase observed
in recent years (4%–5%) in 2014. Looking ahead,
the rise in the average wage and salary could decline
again to approximately 5%, mainly reflecting the real
Chart 4.9
ANNUAL CHANGE IN THE AVERAGE MONTHLY GROSS
NOMINAL WAGE FOR FULL-TIME JOB
(%)
38. 37
MACROECONOMIC DEVELOPMENTS REPORT
December 2014
labour productivity growth and inflation instead of the
increase in the wage and salary exceeding the nominal
labour productivity growth.
Real wages and salaries have grown somewhat faster
than the real labour productivity since 2012 (see Chart
4.10). However, this does not point to the deviation
from the macroeconomic balance as was the case in
2005–2007. The assessment of labour shortage by
businesses is moderate and stable at this stage (see
Chart 4.11), while the share of businesses who plan
to increase the number of employees is similar to the
share of businesses who plan to reduce it (see Chart
4.12). In contrast to the beginning of the period of
economic overheating (2005 and 2006), the labour
shortage level as assessed by businesses increased
significantly and employment expectations of
businesses were particularly positive.
Chart 4.10
REAL WAGE AND SALARY AND LABOUR
PRODUCTIVITY INDEX
(historical average = 100; seasonally adjusted data)
Chart 4.11
THE PERCENTaGE OF BUSINESSES WHO FIND
LABOUR SHORTAGE an important OBSTACLE TO
BUSINESS GROWTH
(%)
Chart 4.12
DATA FROM BUSINESS SURVEYS ON the PROJECTED
3-MONTH EMPLOYMENT DYNAMICS
(net responses; percentage points)
4. Aggregate Supply
39. 38
MACROECONOMIC DEVELOPMENTS REPORT
December 2014
Consequently, the gradual unit labour cost growth is
likely to reflect structural changes on the income side
of the GDP, with the equilibrium level of the labour
income share in the total value added growing. The
labour income share in value added in Latvia is much
smaller than in most other EU countries (see Chart
4.13); however, convergence for this indicator (at
least partly) is expected in the long term. It is also
lower than the labour input in production estimated
by the production function model. The low level is
associated with the relatively high tax burden on
labour and low tax burden on corporate profits at the
EU level. In this case, the gradual easing of the tax
burden on labour may drive an increase in the labour
income share in the total value added.
All available statistical data sources confirmed that
employment growth slowed down sharply in 2014
(see Chart 4.14). Such developments were already
expected before, and this was mainly determined
by the shrinking cyclical unemployment component
and more subdued economic growth. As a result
of these factors, employment will not rise further
(and unemployment will not contract) as rapidly
as in 2011–2013. Moreover, employment growth
will be hindered by demographic developments –
the shrinking share of population and working age
population. The SRS data suggest that employment
growth mainly occurs when persons of pre-retirement
age and pensioners continue or commence to work.
Participation rate is currently also close to its historic
high, and it is unlikely that it will record a rapid
increase.
Registered unemployment continues to fall gradually,
reaching 8.2% of the economically active population
at the end of October. The share of long-term
(unemployed for more than a year) unemployment
as well as the regional differences in unemployment
decline slowly, with registered unemployment in
Latgale shrinking faster than in Riga.
With the rate of jobseekers (10.6% of the
economically active population in the third quarter)
approaching its natural rate, a sustainable decline in
unemployment rate is possible only on account of
intensive implementation of labour market policy
measures (e.g. vocational retraining, promotion of
motivation and work with particular population
groups) instead of stimulating aggregate demand.
With the pace of economic growth slowing down,
unemployment is expected to remain close to its
natural rate also in the coming years (the natural rate
of unemployment will follow a gradual downward
Chart 4.13
LABOUR INCOME SHARE IN VALUE ADDED IN EU
COUNTRIES
(2013)
Chart 4.14
ANNUAL INCREASE IN EMPLOYMENT
(%)
4. Aggregate Supply
40. 39
MACROECONOMIC DEVELOPMENTS REPORT
December 2014
trend); therefore, the fall in unemployment will create
no significant pressure on inflation.
The recent trends in household spending behaviour
suggest a year-on-year increase in the savings rate
in the first and second quarters. Although gross
saving of the disposable income is negative in the
first two quarters of the year, the savings ratio which
is adjusted by changes in pension fund reserves
is positive, with changes in pension fund reserves
growing several times in the second quarter in
comparison with the second quarter of 2013. The
assumptions regarding the trends in household
spending in 2014–2016, inter alia, consumption and
saving are adjusted in line with the current trends.
While nominal private consumption is revised
downwards, the household savings ratio is revised
upwards. In the short term, under the impact of the
escalating Russian–Ukrainian conflict households
could increase their precautionary savings, and the
household savings as a percentage of the disposable
income will remain in a positive territory. The decline
in the funds accumulated on account of consumption
postponed during the crisis will encourage households
to increase their savings, inter alia, by investing in
pension funds. With the labour market conditions
gradually improving, the savings ratio is expected to
continue to grow progressively in 2014–2016.
4. Aggregate Supply
41. 40
MACROECONOMIC DEVELOPMENTS REPORT
December 2014
5. Costs and Prices
The annual inflation rate in Latvia remains low both
from the perspective of a longer time period and
growing economy. The 12-month average HCPI
reached 0.5% in October (see Chart 5.1; 0.6% in the
euro area). In 2014, a low inflation rate in Latvia is
underpinned by both the global price developments
(the food price developments in particular; see
Chart 5.2), affecting inflation also in the euro area
which is an important Latvia's trade partner, and the
postponement of electricity market liberalisation until
2015. The growth in major trade partner countries also
remains weak, without triggering a rise in prices there
and leading to spill-over effects into Latvia through
the use of foreign trade transactions.
In the second half of the year, the increase in inflation
was expected to decelerate in the wake of the falling
oil prices on the global market, the decline in inflation
in the euro area and import restrictions imposed by
Russia. In response to the Russian import ban on
certain food products from the EU countries and the
expected increase in food supply on the domestic
market, inflation expectations decreased in August
and September (see Chart 5.3). Mainly dairy product
and vegetable prices were expected to shrink due
to increased supply. However, the data for August
and September suggested that expectations had not
fully materialised and inflation continued its gradual
upward trend. Speaking of the prices of some food
products, this could be partly explained by the
inability to curb the increase in producer per unit costs
if the output declined with the export opportunities to
Russia decreasing. Overall, hikes in producer prices
for goods sold on the domestic market (see Chart
5.4) do not exert any pressure on consumer prices,
with energy production (having a decreasing effect)
and manufacturing of products of wood (having an
increasing effect) playing the most significant role.
In September, several examples showed that traders
and service providers, especially by selling the goods
of the new season, try to measure the increase in the
purchasing power resulting from the gradual rise in
the income level within the course of approximately
three years: the average economic growth was
4%–5%, a gradual wage increase was observed, while
inflation decreased from more than 4% to zero.
Thus, in September the prices of footwear and
appliances and products for personal care of the new
season grew more than expected due to seasonal
factors and low inflation rates of major trade partners.
Chart 5.1
CHANGES IN HICP BY COMPONENT
(percentage points)
Chart 5.2
GLOBAL FOOD PRICES
(average monthly indicator of 2002–2004 = 100)
Chart 5.3
ASSESSMENT OF HOUSEHOLD CONSUMER PRICE
CHANGES IN NEXT 12 MONTHS
(%)
5. Costs and Prices
42. 41
MACROECONOMIC DEVELOPMENTS REPORT
December 2014
Unusual for the season, vegetable prices posted an
increase. The prices of catering services, however,
rose along with the slowdown of tourism activity.
With the global oil prices decreasing (see Chart 5.5),
fuel prices reported a moderate decline as the impact
was partly offset by the US dollar appreciation vis-à-
vis the euro.
In September, with the launch of the academic
year, the prices of education services posted a
rather significant rise, while the increase was less
pronounced in the previous years. Moreover, the
prices of general school education services grew
substantially this year. In October, the price rise in
several groups of goods and services that is unusual
for September (see Chart 5.6) was already replaced
by a price drop unusual for October, suggesting that
such a price level had not been sustainable this time.
However, education services usually do not represent
such changes in one year, i.e. this service group will
have a higher base effect within a year.
Although the prices of oil products declined,
considering the development of the average oil price
of the preceding months, the JSC Latvijas Gāze
raised tariffs for business customers in October
and November. This means a moderate increase in
heating tariffs. However, already in November the
JSC Latvijas Gāze published its assessment about
the potential dynamics of tariffs in December and
January, stating that natural gas tariffs for business
customers would return to the level seen in September
owing to the persistence of the low level of global oil
prices. Thus, the temporary rise in tariffs will have
no substantial impact on the average inflation and
consumption expenditure in 2014 and 2015 as heating
consumption in October and November is much lower
than in other months during the heating season.
5. Costs and Prices
Chart 5.4
CONTRIBUTION OF INDIVIDUAL SECTORS IN THE
ANNUAL RATE OF INCREASE IN PRODUCER PRICES
OF GOODS SOLD ON THE DOMESTIC MARKET
(percentage points)
Chart 5.5
BRENT CRUDE OIL PRICES ON GLOBAL MARKET IN
2014
(EUR/barrel)
Chart 5.6
PRICE CHANGES IN INDIVIDUAL GROUPS OF GOODS
AND SERVICES IN COMPARISON WITH THE AVERAGE
LEVEL OF THE CORRESPONDING MONTH OF
1998–2013
(percentage points)
43. 42
MACROECONOMIC DEVELOPMENTS REPORT
December 2014
6. Balance of Payments
In the second quarter, the current account deficit of
Latvia's balance of payments amounted to 224.0
million euro or 3.8% of GDP (see Chart 6.1). The
ratio of the current account deficit to GDP increased
in comparison with the ratio of the current account
deficit (–89.7 million euro) to GDP (1.6%) of the
corresponding period of the previous year. The current
account deficit also increased quarter-on-quarter,
amounting to 186.7 million euro or 3.5% of GDP. In
July–September, the current account deficit was 178.1
million euro.
In the second quarter, the foreign trade deficit in
goods increased and reached 650.6 million euro
in comparison with the previous quarter, while the
foreign trade surplus in services expanded to 441.5
million euro; yet it was supported by the rise in
exports of construction services abroad, technical,
trade-related and other business services, financial
services paid for directly, and other financial services
caused by seasonal factors (see Chart 6.2 for the
annual rate of change in exports and imports of goods
and services). In July–September, exports of goods
increased quarter-on-quarter, while the foreign trade
deficit in goods was 662.8 million euro, recording a
slight quarter-on-quarter rise, which was determined
by the excess of imports over exports. The surplus of
foreign trade in services contracted somewhat in July–
September in comparison with the second quarter,
amounting to 431.5 million euro and resulting mainly
from travel services.
The surplus of the primary income account turned
negative in the second quarter (quarter-on-quarter),
reaching 26.5 million euro. The volatility displayed
in some months was primarily affected by the decline
in funding received by Latvia from the EU funds. In
July–September, the deficit of the primary income
account increased in comparison with the second
quarter. It was driven by the decrease in other primary
income received.
In the second quarter, the secondary income account
increased to 11.6 million euro due to the shrinking
contributions to the EU budget. The surplus of the
capital account also rose to 309.4 million euro in the
second quarter. These changes were caused by flows
of EU funds intended for investment.
In the second quarter, the financial account deficit
declined to 374.6 million euro as a result of financial
transactions. Foreign direct investment flows (see
6. Balance of Payments
Chart 6.1
CURRENT ACCOUNT OF LATVIA'S BALANCE OF
PAYMENTS AND ITS COMPONENTS
(% of GDP)
Chart 6.2
RATE OF CHANGE IN EXPORTS AND IMPORTS OF
GOODS AND SERVICES
(year-on-year; %)
44. 43
MACROECONOMIC DEVELOPMENTS REPORT
December 2014
Chart 6.3) in Latvia, on the contrary, increased to
72.6 million euro in the second quarter on account
of transactions. In July–September, the inflow of
direct investment in Latvia amounted to 90.3 million
euro. In April, Latvia issued bonds in the amount
of 1.0 billion euro on the international markets to
refinance the EC loan.
Chart 6.3
FOREIGN DIRECT INVESTMENT IN LATVIA
(% of GDP)
6. Balance of Payments