Download to read offline
![44
MACROECONOMIC DEVELOPMENTS REPORT
December 2016
Bibliography
1. BOKAN, Nikola, GERALI, Andrea, GOMES, Sandra, JACQUINOT, Pascal, PISANI,
Massimiliano. EAGLE-FLI. A Macroeconomic Model of Banking and Financial
Interdependence in the Euro Area. European Central Bank Working Paper Series, No. 1923,
June 2016. 65 p.
2. BUŠS, Ginters (2015). Search-and-Matching Frictions and Labour Market Dynamics in
Latvia. Latvijas Banka Working Paper, No. 4/2015. 73 p.
3. HM Government UK. HM Treasury Analysis: the Immediate Economic Impact of Leaving
the EU. HM Treasury, 23 May 2016 [skatīts 2016. gada 30. novembrī]. Pieejams: https://
www.gov.uk/government/publications/hm-treasury-analysis-the-immediate-economic-
impact-of-leaving-the-eu.
4. Independent, 2016. 'Hard Brexit' could Cost up to £66bn and Slash UK GDP by almost
10%, Treasury Warns. Independent, 11 October 2016 [skatīts 2016. gada 30. novembrī].
Pieejams: http://www.independent.co.uk/news/uk/politics/brexit-latest-hard-brexit-uk-
economy-66bn-cost-leaving-eu-a7354996.html.
5. International Monetary Fund. Country Report No. 16/169: United Kingdom. International
Monetary Fund, June 2016. 65 p.
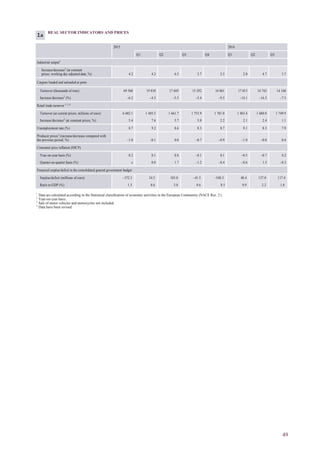
8.2 Russia's cargo traffic diverted from Latvian ports
The year 2016 saw a steep contraction in freight transport by rail and via ports, because the
transported volumes of coal and oil, two key product groups, shrank. It is associated with
falling global demand for coal, sanctions against a number of freight owners, depreciation
of the Russian rouble, and higher transit costs through Latvia. In addition, for a long time
now, Russia has been aiming at reducing the share of neighbouring ports (in Latvia and
Ukraine) in its export deliveries. This share is planned to have been reduced to 5%5
by 2020.
Public statements relative to these long-standing plans of Russia came out at an increasing
frequency in 2016. Nikolay Tokarev, Head of the Russian oil transport and pipeline PJSC
Transneft announced in September, for instance, that Russia's exports of oil products through
the Baltic ports would have been completely redirected to Russia by 2018. Moreover, Russia
is creating preconditions also for diverting freight of other states away from the Baltic ports.
Thus, at the end of October came the news that the Board of OAO Rossijskije železnije
dorogi had resolved on a 25% discount on the oil product transit from Belarus to Russian
ports, which could make the cost of Belorussian shipments to Russian ports comparable with
the tariffs in the ports of Klaipeda and Ventspils.
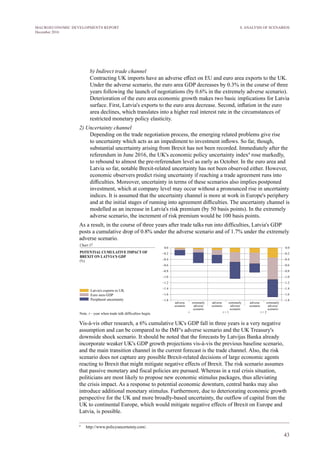
This risk scenario assumes an extremely adverse development of events, i.e. the Russian
cargo business is completely diverted away from the Latvian ports. It is understood that due
to the absence of freight of Russian origin, cargoes by rail would decrease by about 70% and
via ports by about 60%6
. The effects of the shock (diverting Russian freight) are estimated by
using the computable general equilibrium (CGE) model, capturing 32 industries, 55 products
and seven categories of final users. The model is based on Latvia's supply and use tables for
2011 from the World Input-Output Database (WIOD). To simulate the effect from freight
diverting, exports of affected sectors (domestic transport and storage, and auxiliary transport
services) are subject to shock.
The model shows that on account of the loss of Russian cargo traffic GDP would decrease by
4.3% from its current level in the year the shock applies. Difficulties in the transport industry
would push up unemployment, while wages and salaries would go down. Consequently,
purchasing power and private consumption would also deteriorate. Weak economic activity
would put investment flows under pressure as well.
5
In 2015, around 9% of Russia's export cargoes were loaded and unloaded at the Baltic and Ukrainian ports.
6
The assumption is based on an approximate share of Russian energy resource cargoes in total cargoes.
8. ANALYSIS OF SCENARIOS](https://image.slidesharecdn.com/mnp2016decembrisen-170106123506/85/Macroeconomic-Developments-Report-December-2016-45-320.jpg)
![45
MACROECONOMIC DEVELOPMENTS REPORT
December 2016
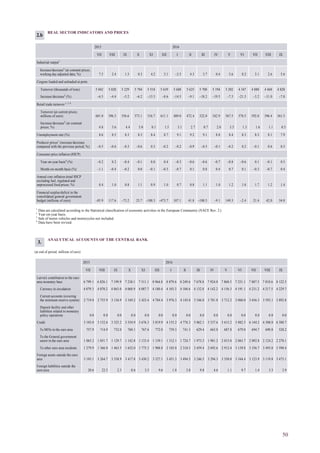
The CGE model provides an insight not only into the effects of a shock on the economy
overall but also on individual sectors. Effects are negative for shock-affected sectors and
the related transport sectors; industries with more sensitive response to overall domestic
economic activity are also impacted. Employment and output decreases are posted by
construction, financial and insurance activities, real estate operations, the energy sector,
and trade. On account of cheaper and easily available workforce, some positive impact is
recorded for manufacturing (in particular, manufacture of transport vehicles, machinery
and equipment, products of wood and textile articles, all export-oriented subsectors), and
agriculture.
Despite Russia's enormous investment to finance its port and railway infrastructure, it will
fall short of the capacity to service all freight redirected to its ports. And what is more,
recently (in September and October) the situation in Latvia's transit sector has somewhat
improved. It particularly refers to the coal freight segment where due to coal price rises
and the beginning of the heating season in Europe the demand for and exports of coal from
Russia are concurrently growing. The expanding volumes of Russian exports aggravate
capacity problems at its local ports, hence a complete withdrawal of freight traffic from
the Baltic ports without making new large investments domestically seems unlikely in
the nearest future. Nevertheless, the lack of diversity in Latvian rail- and port-transported
cargoes as well as Russia's potential to influence transporters' transit route options imply
that downside risks are in place and alternative cargoes to Russia's energy resources shall be
looked for.
Bibliography
1. BEŅKOVSKIS, Konstantīns, GOLUZINS, Eduards, TKAČEVS, Oļegs (2016). CGE
Model with Fiscal Sector for Latvia. Latvijas Banka Working Paper, No. 1/2016. 62 p.
2. Морская коллегия при Правительстве Российской Федерации. Стратегия развития
морской портовой инфраструктуры России до 2030 года. Москва: 2015 [skatīts
2016. gada 6. decembrī]. Pieejams: http://www.rosmorport.ru/media/File/seastrategy/
strategy_150430.pdf.
8. ANALYSIS OF SCENARIOS](https://image.slidesharecdn.com/mnp2016decembrisen-170106123506/85/Macroeconomic-Developments-Report-December-2016-46-320.jpg)

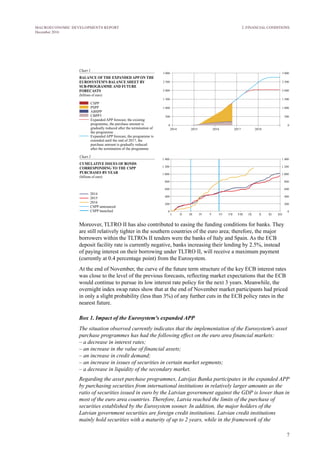
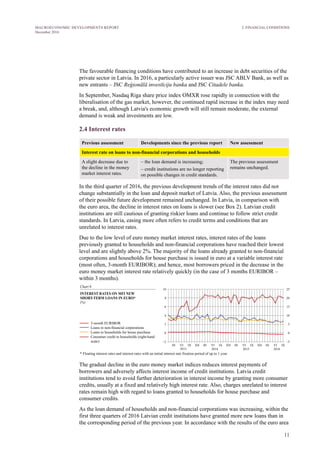
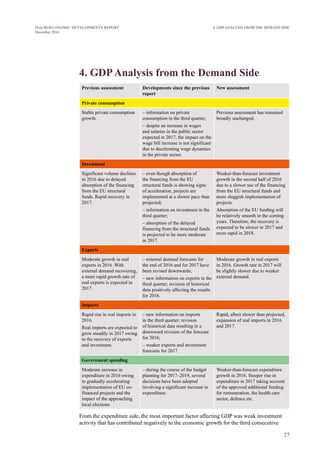
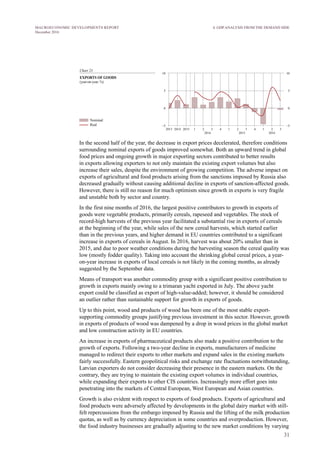
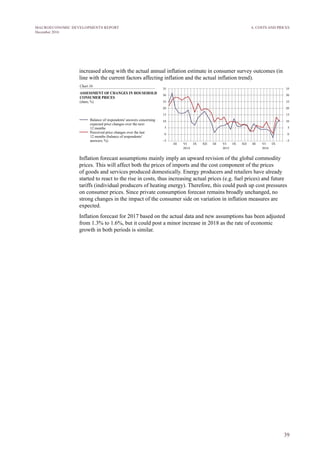
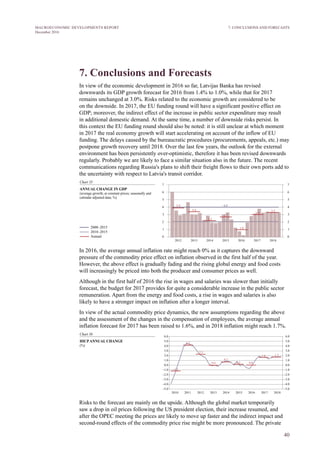
The December 2016 Macroeconomic Developments Report from Latvijas Banka presents a pessimistic economic outlook for Latvia due to stagnant GDP growth, weak external demand, and uncertainties following geopolitical developments, including the UK's EU referendum. It forecasts potential improvements in 2017 driven by EU funding and increased domestic consumption, yet warns of ongoing risks from external economic factors. The report discusses various economic sectors, financial conditions, labor market insights, and inflation expectations, emphasizing the need for structural reforms to enhance competitiveness and GDP growth.


