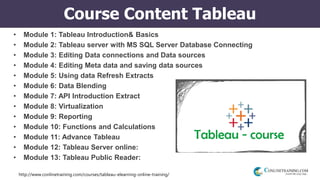
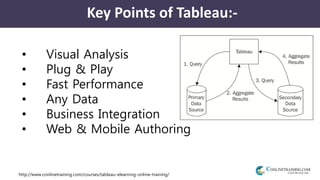
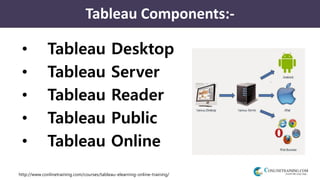
Tableau Business Intelligence and AnalyticsQEdge Tech
Tableau Business Intelligence and Analytics Data Visualization is an inevitable aspect of business analytics.Tableau is an integrated business intelligence (BI) and analytics solution that helps to analyze key business data and generate meaningful insights.
Tableau Sharing Session oleh Noverino RifaiNoverino Rifai
Slide presentasi yang menjelaskan mengenai Tableau, salah satu tools Business Intelligence yang saat ini sedang "naik daun" karena kemudahan dan penggunaan yang intuitif.
Di bagian akhir, ada perbandingan antara Tableau dengan Oracle Business Intelligence.
How to Improve Data Analysis Through Visualization in TableauEdureka!
Data Visualization using Tableau will allow one to gain an edge over the other analysts and let you present the data in a much better and insightful manner. It would be easier for the learners to immediately implement it in their workplace and create a real-time dashboard for their management using one of the most sought-after tools.
Bound Tech is the Top Institute For Tableau training. Tableau Hands On Training and Tableau Job Oriented Training is taught by Our Real Time Trainer with real time scenario’s and examples. We teach our students from the fundamental concepts to the highly developed concepts.
Tableau is one of the fastest evolving Business Intelligence (BI) and data visualization tool. It is very quick to deploy, easy to learn and very spontaneous to use for a customer. It has evolved into one of the fastest and easiest way to share analytics in the cloud.
Delivered at PSG College of Technology, Mar 24, 2018
Github - https://github.com/raghu-icecraft/tech-talks/tree/master/Tableau/Mar_18
Basics of BI, Data Visualization. Tableau Features and integration with R.
Discussed about Tableau Public and Tableau Desktop.
Additions Compared to ICCTAC 2018 session :-
Some more emphasis added related to Data Science.
Added slides related to Bi and Data science Gartner Magic Quadrant of year 2018.
A slide dedicated to foremost Principles of Data Visualization; a note Edward Tufte and Gestalt laws.
Audience are MSc Data Science students along with other Teaching Staff.
Workshop happened in PSG College of Technology, Coimbatore (Department of MCA).
List of data sets and data set sources
Sample data sets for machine learning
Data sets for predictive modeling and visualizations
Economic and Social Data sets
Business and Financial datasets
Data Visualization using Tableau will allow one to gain an edge over the other analysts and let you present the data in a much better and insightful manner. It would be easier for the learners to immediately implement it in their workplace and create a real-time dashboard for their management using one of the most sought-after tools.
Step-1 Tableau Introduction
Step-2 Connecting to Data
Step-3 Building basic views
Step-4 Data manipulations and Calculated fields
Step-5 Tableau Dashboards
Step-6 Advanced Data Options
Step-7 Advanced graph Options
Delivered at Kristu Jayanti College, Feb 1, 2018
During IEEE International Conference on Current Trends in Advanced Computing.
Github - https://github.com/raghu-icecraft/tech-talks/tree/master/Tableau_Feb%2018
Tableau - Learning Objectives for Data, Graphs, Filters, Dashboards and Advan...Srinath Reddy
Step-1 Tableau Introduction
Step-2 Connecting to Data
Step-3 Building basic views
Step-4 Data manipulations and Calculated fields
Step-5 Tableau Dashboards
Step-6 Advanced Data Options
Step-7 Advanced graph Options
As a leading data visualization tool Tableau has many desirable and unique features. Its powerful data discovery and exploration application allows you to answer important questions in seconds. You can use Tableau's drag and drop interface to visualize any data, explore different views, and even combine multiple databases together easily. It does not need any complex scripting. Anyone who understands the business problem can address it with a visualization of the relevant data. When the analysis is finished, sharing with others is as easy as publishing to Tableau Server.
An overview of the different sets of functionality of Tableau solution suite, and how it can address the many facets of a comprehensive data mining solution.
What are Parameters in Tableau | Tableau Tutorial | EdurekaEdureka!
YouTube Link: https://youtu.be/hvWkGP6yvek
**Tableau Certification Training: https://www.edureka.co/tableau-training **
This Edureka PPT on "Parameters in Tableau" allows you to use aggregated values that aren’t available in your data and incorporate these values into your reports. Learn how to create and control the input to see the results of the effect of the parameter on your data.
The following are the topics covered in the session:
What are the Parameters in Tableau?
Getting Started on the Desktop
Creating a Parameter in Tableau
Using the Parameter in a Calculation
Parameter Control
Using Parameters in your Visualization
Follow us to never miss an update in the future.
YouTube: https://www.youtube.com/user/edurekaIN
Instagram: https://www.instagram.com/edureka_learning/
Facebook: https://www.facebook.com/edurekaIN/
Twitter: https://twitter.com/edurekain
LinkedIn: https://www.linkedin.com/company/edureka
Castbox: https://castbox.fm/networks/505?country=in
Tableau reseller partner in Qatar Bilytica Best business Intelligence company...Carie John
Email: info@bilytica.com
Bilytica provides best in class services in Business Intelligence, Data-warehousing, Data Governance, Big Data management, Enterprise Applications, Enterprise Performance Management, Mobile Applications & Gaming and Business Consulting Services. Being a Tableau preferred reseller and consulting partner for Middle East, Europe, Turkey, Asia & Russia. Bilytica has helped 500+ small to large enterprises in Tableau implementation and training. We provide End to end Tableau consulting and training services including Tableau Proof of Concepts, Tableau Software license sales ,Tableau dashboard design Services , Onsite and remote Tableau consulting ,Customized onsite Tableau training , Tableau Server hosting ,Tableau integration services, Tableau advanced analytic & Tableau managed services.
SQL Saturday 492 - Tableau with MS Azure StackMichael Perillo
Slide deck presentation used for April 16, 2016. Covered Tableau Product line, deployed Tableau Server using Microsoft Azure, Deployed Tableau Sample Superstore to SQL Azure, created Tableau Data Source and Workbooks - Deployed to Tableau Server. Demo Web Author capabilities with Tableau Server 9.3. Tableau and Microsoft Azure!
Next generation analytics isn’t on its way… it’s already arrived. Most businesses are in the process of developing their new data platforms on the cloud, or moving their existing analytics infrastructure to the cloud. Attend this webinar to learn model architectures and best practices for analytics on AWS. You’ll also learn how you can leverage cloud to spread insight throughout your organization.
Join us to learn:
• What cloud data infrastructure should look like
• How to optimize your analytics deployment on the cloud
• Using Tableau to find and share new insights with everyone in your organization
Scaling Tableau to the Enterprise: The Perks and Pitfalls of Tableau Server W...Senturus
Learn the perks of Tableau Server while paying attention to the avoidable pitfalls and important considerations that impact performance, scale and user adoption. View the webinar video recording: http://www.senturus.com/resources/going-big-time-with-tableau-server/
Topics covered include: how Tableau Server allows users to share their work, with anyone, via any browser, in a secure environment; how Tableau Server enables self-service analytics over the web and via mobile devices; how Tableau Server can help control your Tableau spend; how under powered hardware, installing with defaults and insufficient care and feeding negatively impact performance; the #1 barrier to entry and user adoption and how Tableau provides flexible deployment options (in-house / cloud) as well as licensing options (named user / unlimited).
Senturus, a business analytics consulting firm, has a resource library with hundreds of free recorded webinars, trainings, demos and unbiased product reviews. Take a look and share them with your colleagues and friends: http://www.senturus.com/resources/.
10 best practices and design principles to create effective dashboards using Tableau. View the webinar video recording to hear the narrated version of the good, the bad…and the downright ugly in dashboard design: http://www.senturus.com/resources/10-best-practices-for-tableau-dashboard-design/.
Senturus, a business analytics consulting firm, has a resource library with hundreds of free recorded webinars, trainings, demos and unbiased product reviews. Take a look and share them with your colleagues and friends: http://www.senturus.com/resources/.
Kursi në TCT është identik me kursin e Microsoftit dhe përmbajtja e kësaj faqe është marrë nga faqja zyrtare e Microsoftit. Ky kurs është hartuar për të prezantuar dhe mësuar nëpërmjet praktikës gjuhën SQL (T-SQL). T-SQL është shumë e përafërt me PL/SQL dhe MySQL. Kursi mësohet & trajnohet nëpërmjet praktikës dhe synimi i kursit është t’i përgatisë studentët për një pozicion junior në database developer. Në fund të kursit studentët kanë përvetësuar aftësitë e nevojshme për të marrë provimin e Microsoft SQL Server 70-761 Quering.
Grokking Techtalk #42: Engineering challenges on building data platform for M...Grokking VN
Đến với Techtalk #42, các bạn sẽ được chia sẻ về cách thiết kế và hiện thực một platform phục vụ các bài toán về machine learning thông qua một case study về việc phân tích các bình luận của người dùng.
Nội dung chủ đề lần này sẽ xoay quanh một số thách thức trong quá trình xây dựng bao gồm các khó khăn về mặt kỹ thuật và phân tích khi:
+ Cần phải thu thập lượng lớn bình luận của người dùng
+ Tổ chức lưu trữ và xử lý dữ liệu để dễ dàng mở rộng, thuận tiện cho việc giám sát, vận hành
+ Thiết kế các thành phần trong hệ thống đảm báo tính tái sử dụng cao, tránh lãng phí tài nguyên
Ngôn ngữ: Tiếng Việt
---
Speakers:
- Anh Hiền Hoàng - Principal Big Data Engineer & TPP
- Anh Hiếu Hoàng - Data Scientist & TPP
MSBI with SQL Server T-SQL | Microsoft BI With Server T-SQL | Realtime Traini...SequelGate
Microsoft Business Intelligence: MSBI Classroom Training With T-SQL
This impeccable SQL Server BI (MSBI / SSBI) course is carefully designed for aspiring BI Developers, Consultants and Architects. Program includes basic to advanced Business Intelligence and Data Warehouse concepts on SQL Server Integration Services (SSIS), Analysis Services (SSAS) and Reporting Services (SSRS). Complete practical and realtime training course with 24x7 free LIVE server access and Lab.
Pre-requisites: Participant needs to have knowledge on SQL Server T-SQL Queries to join this Real-time Practical MSBI Training Course.
CTE Ottawa Seminar Day - September 7th, 2012
This clinic introduces the key features and enhancements in SQL Server 2012. It is designed to provide a high-level overview of the product and the key new capabilities in this release.
This course is intended for technology managers and database professionals who want to understand the key capabilities of SQL Server 2012. In many cases, it is assumed that senior technical managers may attend this clinic in order to assess the further training that their technology-focused employees will need in order to adopt SQL Server 2012.
Tomer Shiran est le fondateur et chef de produit (CPO) de Dremio. Tomer était le 4e employé et vice-président produit de MapR, un pionnier de l'analyse du Big Data. Il a également occupé de nombreux postes de gestion de produits et d'ingénierie chez IBM Research et Microsoft, et a fondé plusieurs sites Web qui ont servi des millions d'utilisateurs. Il est titulaire d'un Master en génie informatique de l'Université Carnegie Mellon et d'un Bachelor of Science en informatique du Technion - Israel Institute of Technology.
Le Modern Data Stack meetup est ravi d'accueillir Tomer Shiran. Depuis Apache Drill, Apache Arrow maintenant Apache Iceberg, il ancre avec ses équipes des choix pour Dremio avec une vision de la plateforme de données “ouverte” basée sur des technologies open source. En plus, de ces valeurs qui évitent le verrouillage de clients dans des formats propriétaires, il a aussi le souci des coûts qu’engendrent de telles plateformes. Il sait aussi proposer un certain nombre de fonctionnalités qui transforment la gestion de données grâce à des initiatives telles Nessie qui ouvre la route du Data As Code et du transactionnel multi-processus.
Le Modern Data Stack Meetup laisse “carte blanche” à Tomer Shiran afin qu’il nous partage son expérience et sa vision quant à l’Open Data Lakehouse.
(ATS4-DEV09) Visualizing SmartLab Data Using the Accelrys Enterprise PlatformBIOVIA
In this session, we will introduce a few interactive reports built using the reporting capabilities in the Accelrys Enterprise Platform on top of SmartLab data. The session will also include a discussion of the reporting capabilities of AEP and the steps needed to build such an interactive report.
Biological screening of herbal drugs: Introduction and Need for
Phyto-Pharmacological Screening, New Strategies for evaluating
Natural Products, In vitro evaluation techniques for Antioxidants, Antimicrobial and Anticancer drugs. In vivo evaluation techniques
for Anti-inflammatory, Antiulcer, Anticancer, Wound healing, Antidiabetic, Hepatoprotective, Cardio protective, Diuretics and
Antifertility, Toxicity studies as per OECD guidelines
Palestine last event orientationfvgnh .pptxRaedMohamed3
An EFL lesson about the current events in Palestine. It is intended to be for intermediate students who wish to increase their listening skills through a short lesson in power point.
Unit 8 - Information and Communication Technology (Paper I).pdfThiyagu K
This slides describes the basic concepts of ICT, basics of Email, Emerging Technology and Digital Initiatives in Education. This presentations aligns with the UGC Paper I syllabus.
Acetabularia Information For Class 9 .docxvaibhavrinwa19
Acetabularia acetabulum is a single-celled green alga that in its vegetative state is morphologically differentiated into a basal rhizoid and an axially elongated stalk, which bears whorls of branching hairs. The single diploid nucleus resides in the rhizoid.
Read| The latest issue of The Challenger is here! We are thrilled to announce that our school paper has qualified for the NATIONAL SCHOOLS PRESS CONFERENCE (NSPC) 2024. Thank you for your unwavering support and trust. Dive into the stories that made us stand out!
June 3, 2024 Anti-Semitism Letter Sent to MIT President Kornbluth and MIT Cor...Levi Shapiro
Letter from the Congress of the United States regarding Anti-Semitism sent June 3rd to MIT President Sally Kornbluth, MIT Corp Chair, Mark Gorenberg
Dear Dr. Kornbluth and Mr. Gorenberg,
The US House of Representatives is deeply concerned by ongoing and pervasive acts of antisemitic
harassment and intimidation at the Massachusetts Institute of Technology (MIT). Failing to act decisively to ensure a safe learning environment for all students would be a grave dereliction of your responsibilities as President of MIT and Chair of the MIT Corporation.
This Congress will not stand idly by and allow an environment hostile to Jewish students to persist. The House believes that your institution is in violation of Title VI of the Civil Rights Act, and the inability or
unwillingness to rectify this violation through action requires accountability.
Postsecondary education is a unique opportunity for students to learn and have their ideas and beliefs challenged. However, universities receiving hundreds of millions of federal funds annually have denied
students that opportunity and have been hijacked to become venues for the promotion of terrorism, antisemitic harassment and intimidation, unlawful encampments, and in some cases, assaults and riots.
The House of Representatives will not countenance the use of federal funds to indoctrinate students into hateful, antisemitic, anti-American supporters of terrorism. Investigations into campus antisemitism by the Committee on Education and the Workforce and the Committee on Ways and Means have been expanded into a Congress-wide probe across all relevant jurisdictions to address this national crisis. The undersigned Committees will conduct oversight into the use of federal funds at MIT and its learning environment under authorities granted to each Committee.
• The Committee on Education and the Workforce has been investigating your institution since December 7, 2023. The Committee has broad jurisdiction over postsecondary education, including its compliance with Title VI of the Civil Rights Act, campus safety concerns over disruptions to the learning environment, and the awarding of federal student aid under the Higher Education Act.
• The Committee on Oversight and Accountability is investigating the sources of funding and other support flowing to groups espousing pro-Hamas propaganda and engaged in antisemitic harassment and intimidation of students. The Committee on Oversight and Accountability is the principal oversight committee of the US House of Representatives and has broad authority to investigate “any matter” at “any time” under House Rule X.
• The Committee on Ways and Means has been investigating several universities since November 15, 2023, when the Committee held a hearing entitled From Ivory Towers to Dark Corners: Investigating the Nexus Between Antisemitism, Tax-Exempt Universities, and Terror Financing. The Committee followed the hearing with letters to those institutions on January 10, 202
Model Attribute Check Company Auto PropertyCeline George
In Odoo, the multi-company feature allows you to manage multiple companies within a single Odoo database instance. Each company can have its own configurations while still sharing common resources such as products, customers, and suppliers.
Synthetic Fiber Construction in lab .pptxPavel ( NSTU)
Synthetic fiber production is a fascinating and complex field that blends chemistry, engineering, and environmental science. By understanding these aspects, students can gain a comprehensive view of synthetic fiber production, its impact on society and the environment, and the potential for future innovations. Synthetic fibers play a crucial role in modern society, impacting various aspects of daily life, industry, and the environment. ynthetic fibers are integral to modern life, offering a range of benefits from cost-effectiveness and versatility to innovative applications and performance characteristics. While they pose environmental challenges, ongoing research and development aim to create more sustainable and eco-friendly alternatives. Understanding the importance of synthetic fibers helps in appreciating their role in the economy, industry, and daily life, while also emphasizing the need for sustainable practices and innovation.
Welcome to TechSoup New Member Orientation and Q&A (May 2024).pdfTechSoup
In this webinar you will learn how your organization can access TechSoup's wide variety of product discount and donation programs. From hardware to software, we'll give you a tour of the tools available to help your nonprofit with productivity, collaboration, financial management, donor tracking, security, and more.
2. http://www.conlinetraining.com/courses/tableau-elearning-online-training/
Course Content Tableau
• Module 1: Tableau Introduction& Basics
• Module 2: Tableau server with MS SQL Server Database Connecting
• Module 3: Editing Data connections and Data sources
• Module 4: Editing Meta data and saving data sources
• Module 5: Using data Refresh Extracts
• Module 6: Data Blending
• Module 7: API Introduction Extract
• Module 8: Virtualization
• Module 9: Reporting
• Module 10: Functions and Calculations
• Module 11: Advance Tableau
• Module 12: Tableau Server online:
• Module 13: Tableau Public Reader:
4. http://www.conlinetraining.com/courses/tableau-elearning-online-training/
English meaning of the Tableau ?
Picture
(or)
Visualization
Tableau:- Tableau is the Business Intelligence flat from, it is used to create the
reports and analyze the business.
Business Intelligence :- (BI) is the set of techniques and tools for the
transformation of raw data into meaningful and useful information for business
analysis purposes.
Data warehouse:- Data warehouse is the centralized location, where we stored
all the business transactions from different locations in order to perform the
analysis.