Download to read offline

![www.sqlschool.com For Free Demo: Reach us on 9666 44 0801 or 9666 64 0801 (24x7)
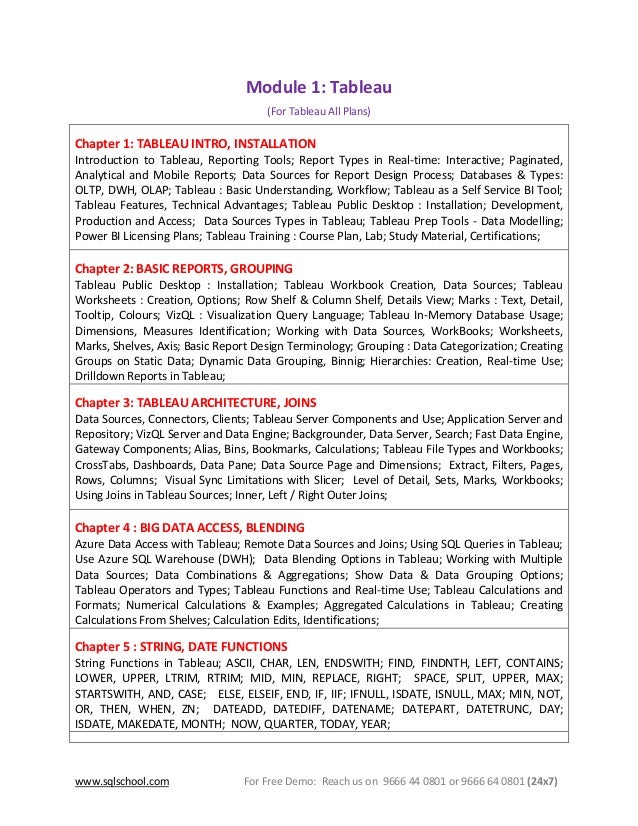
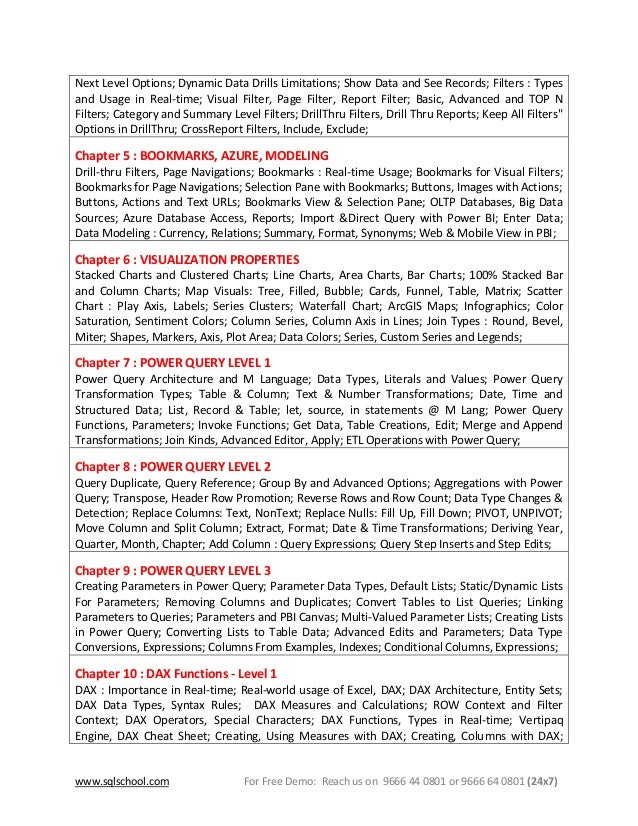
Chapter 17 : MANAGE TABLEAU SERVER
Tableau Server - Administration Concepts; Tableau Sites, Users, Groups Security; Group Rules,
Web Edits in Tableau Server; Project Permission and Locking Options; Data Security with user
Filters in Server; user Filters and Hybrid Models in Server; Access Roles, Schedules, Extraction;
TSM : Tableau Services Manager; TSM Configuration for Real-time Use; Browser, Maintenance,
GUI and CLI; Backups and Restores with Tableau TSM; TSM Upgrades For Tableau Report
Config; Tabcmd : Command Line Utility - Imports; Tabcmd : user Import via CSV File;
Comparing Tableau & Microsoft Power BI;
Chapter 18 : REAL-TIME PROJECT
Project Requirement Analysis; Implementing SDLC Phases; Requirement Gathering, FSA;
Phase 1:
TABLEAU Report Design; Visualizations, Properties; Analytics and Formatting;
Phase 2:
Data Modelling, Tableau Prep; Dynamic Connections, Azure DB; Parameters and VizQL Scripts
Phase 3:
Tableau Online Analysis; Cloud and Tableau Server; Project FAQs and Solutions
Module 2: Database Basics, SQL Server & T-SQL Concepts
(For Tableau Plans B, C)
Chapter 1: SQL SERVER INTRODUCTION
Data, Databases and RDBMS Software; Database Types : OLTP, DWH, OLAP; Microsoft SQL
Server Advantages, Use; Versions and Editions of SQL Server; SQL : Purpose, Real-time Usage
Options; SQL Versus Microsoft T-SQL [MSSQL]; Microsoft SQL Server - Career Options; Database
Engine Component and OLTP; BI Components, Data Science Components; ETL, MSBI and Power
BI Components; Course Plan, Resume, Project; 24 x 7 Lab; Software Installation Pre-Requisites;
Chapter 2: SQL SERVER INSTALLATIONS
System Configuration Checker Tool; Versions and Editions of SQL Server; SQL Server Pre-
requisites : S/W, H/W; SQL Server 2016 / 2017 Installation; SQL Server 2019 Installation;
Instance Name; Instances : Types; Default Instance, Named Instances; Port Numbers; Service
and Service Account; Authentication Modes and Logins; FileStream, Collation Properties;
Chapter 3: SSMS Tool, SQL BASICS - 1
SQL Server Management Studio; Local and Remote Connections; System Databases: Master and
Model; MSDB, TempDB, Resource Databases; Creating Databases : Files [MDF, LDF]; Creating
Tables in GUI; Data Insertion & Storage; SQL : Real-time Usage; DDL, DML, SELECT, DCL and TCL
Statements; Data Storage, Inserts - Basic Level; SELECT; Table Data Retrieval;](https://image.slidesharecdn.com/tableau-training1-220216094621/95/Tableau-LIVE-Online-Training-5-638.jpg)

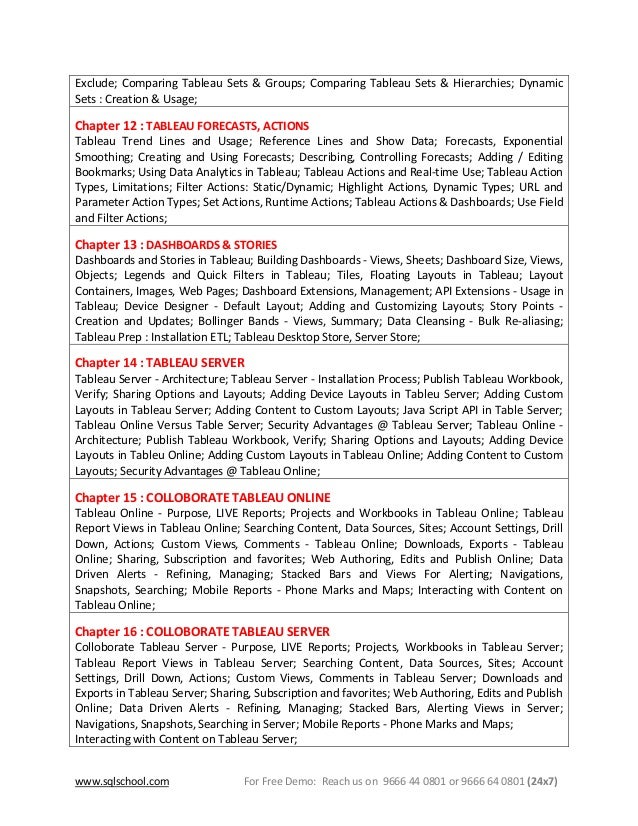
![www.sqlschool.com For Free Demo: Reach us on 9666 44 0801 or 9666 64 0801 (24x7)
Quick Measures; SUM, AVERAGEX, KEEPFILTERS; Dynamic Expressions, IF in DAX;
Chapter 11 : DAX Functions - Level 2
Data Modeling Options in DAX; Detecting Relations for DAX; Using Calculated Columns in DAX;
Using Aggregated Measures in DAX; Working with Facts & Measures; Modeling : Missing
Relations; Modeling : Relation Management; CALCULATE Function Conditions; CALCULATE &
ALL Member Scope; RELATED & COUNTROWS in DAX; Slicing; Dynamic Expressions, RETURN;
Date, Time, Text Functions; Logical, Mathematical Functions; Running Total, EARLIER Function;
Chapter 12 : DAX FUNCTIONS - Level 3
1:1, 1:M and M:1 Relations; Connection with CSV, MS Access; AVERAGEX and AVERAGE in DAX;
KEEPFILTERS and CALCUALTE; COUNTROWS, RELATED, DIVIDE; PARALLELPERIOD, DATEDADD;
CALCULATE & PREVIOUSMONTH; USERELATIONSHIP, DAX Variables; TOTALYTD , TOTALQTD;
DIVIDE, CALCULATE, Conditions; IF..ELSE..THEN Statement; SELECTEDVALUE, FORMAT; SUM,
DATEDIFF Examples; TOCHAPTER, DATE, CHAPTER with DAX; Time Intelligence Functions;
Chapter 13 : POWER BI CLOUD - 1
Power BI Service Architecture; Power BI Cloud Components, Use; App Workspaces, Report
Publish Related Datasets Cloud; Creating New Reports in Cloud; Report Publish and Report
Uploads; Dashboards Creation and Usage; Adding Tiles to Dashboards; Pining Visuals and
Report Pages; Visual Pin Actions in Dashboards; LIVE Interaction in Dashboard; Adding Images,
Custom Links; Videos & Embed Links; API Data Sources; Streaming Dataset Tiles (REST API);
Chapter 14 : POWER BI CLOUD - 2
Dashboards Actions, Report Actions; DataSet Actions: Create Report; Share, Metrics and
Exports; Mobile View & Dashboard Themes; Q & A [Cortana], Pin Visuals; Export, Subscribe,
Subscribe; Favourite, Insights, Embed Code; Featured Dashboards and Refresh; Gateways
Configuration, PBI Service; Gateway Types; Gateway Clusters, Data Refresh : Manual,
Automatic; PBIEngw Service; DataFlows, Power Query Expressions; Adding Entities, JSON Files;
Chapter 15 : EXCEL, ROW LEVEL SECURITY
Import and Upload Options in Excel; Excel Workbooks and Dashboards; Datasets in Excel and
Dashboards; Using Excel Analyzer in Power BI; Using Excel Publisher in PBI Cloud; Excel
Workbooks, PINS in Power BI; Excel ODC Connections, Power Pivot; Row Level Security (RLS)
with DAX; Need for RLS in Power BI Cloud; Data Modelling; DAX Roles Creation and Testing;
Power BI Users to Roles; Custom Visualizations; Histogram, Gantt Chart, Info graphics;
Chapter 16: REPORT SERVER, REPORT BUILDER
Need for Report Server in PROD; Install, Configure Report Server; Report Server DB, Temp
Database; Webservice URL, Webportal URL; Creating Hybrid Cloud with Power BI; Using Power
BI DesktopRS; Uploading Interactive Reports; Report Builder; Report Builder For Power BI
Cloud; Designing Paginated Reports (RDL); Deploy to Power BI Report Server; Data Source
Connections, Report; Power BI Report Server to Cloud; Tenant IDs; Mobile Report Publisher;
Chapter 17 : MSBI INTEGRATIONS WITH POWER BI
Power BI with SQL Server Source; Power BI with SQL Data Warehouse; Power BI with SSAS OLAP](https://image.slidesharecdn.com/tableau-training1-220216094621/95/Tableau-LIVE-Online-Training-9-638.jpg)
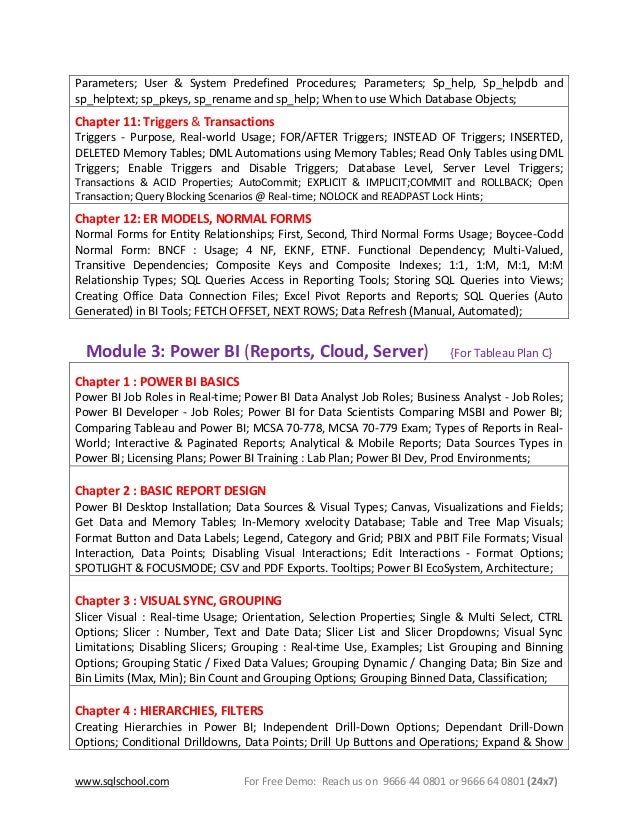
![www.sqlschool.com For Free Demo: Reach us on 9666 44 0801 or 9666 64 0801 (24x7)
Server; Power BI with Azure SQL DB Source; Power BI with Azure SQL Warehouse; Power BI
with Azure Analysis Server; Power BI with SSRS (RDL) Reports; Power BI Report Builder Tool;
Paginated Reports Design, Use; Data Sources, Datasets, RDL; Report Publish (RDL) to Cloud;
Report Verifications; Interactive Vs Paginated Reports; Configuring & Managing Alerts in Cloud;
Chapter 18: Real-time Project [Sales & Customers]
Resume, Project Oriented FAQs and Solutions](https://image.slidesharecdn.com/tableau-training1-220216094621/95/Tableau-LIVE-Online-Training-10-638.jpg)

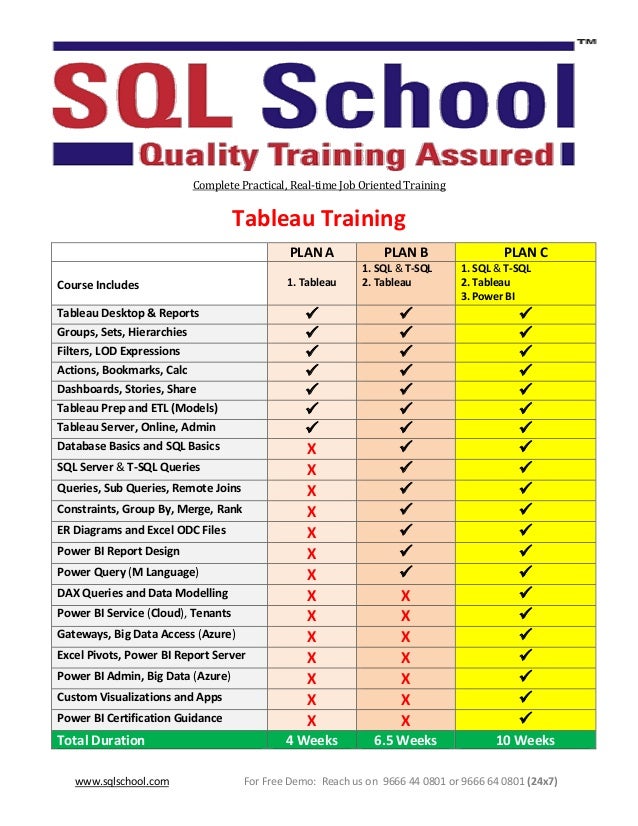
The document outlines a comprehensive training curriculum for Tableau, SQL Server, and Power BI covering various modules and chapters. It includes details on course content, durations, and training plans, as well as emphasizing real-time job-oriented training. The training also incorporates practical skills, report design, data visualization, server management, and ETL processes.


