Tableau Course syllabus

We are providing IT Software Course (Online Training) Our online training programs are designed to help students attend live sessions in the virtual ONLINE TRAINING. These help students to attend training program from any location in the whole world at their convenience. With constant support and live access to online servers for practical’s sessions, virtual ONLINE TRAINING are the training methodology of the future connecting the trainer and the students on the web. TRENDING COURSES:- MS- DYNAMICS D365 CRM MS-DYNAMICS D365 ERP AX TECHNICAL (Finance and Operations) DATASCIENCE (Artificial Intelligence, Machine Learning, Deep learning) DATASCIENCE (, Python, R programming) DIGITAL MARKETING ( SEO SEM SMM) SALESOFRCE (Admin Dev, Lightning) POWER BI TABLEAU DEVOPS, AWS MICROSOFT AZURE INFORMATICA (Power Center, IDQ, MDM) ORACLE FUSION HCM CLOUD GOOGLE CLOUD PLATFORM SNOWFLAKE DATA ANALYTICS SAP ANALYTICS CLOUD ALTER YX MULESOFT ESB APIGEE ODOO ERP HADOOP BIGDATA ( Spark, Scala) PEGA PRPC WORKDAY TECHNO FUNCTIONAL BUSINESS ANALYSIS ANGULAR JS, Node JS, React JS, React Native, JIRA UI / UX Design Full Stack SELENIUM BLOCKCHAIN SERVICE NOW SCRUM MASTER PMP APPIAN Contact Details: - Contact Person : Prakash Email id : gpsinfotech.net@gmail.com / info@gpsinfotech.com Mob: 91-9395190232 / 9989787231 ( with Whatsapp ) WebSite Url: www.gpsinfotech.com YouTube: https://www.youtube.com/user/MrGpsinfotech/videos?view_as=subscriber Linkedin: https://www.linkedin.com/in/gps-infotech-6210646a/ FaceBook : https://www.facebook.com/profile.php?id=100008120196275 Twitter : https://twitter.com/gpsinfotech Instagram : https://www.instagram.com/gpsinfotech/ Pintrest : https://in.pinterest.com/gpsinfotechsoftwaresolutions/boards/ Google + : https://gps-infotech.business.site/posts/3474591225498965037

Recommended
More Related Content
What's hot
What's hot (20)
Similar to Tableau Course syllabus
Similar to Tableau Course syllabus (20)
Recently uploaded
Recently uploaded (20)
Tableau Course syllabus
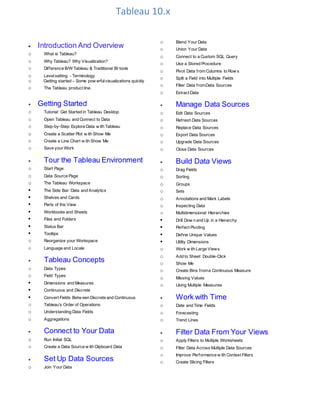
- 1. Tableau 10.x Introduction And Overview o What is Tableau? o Why Tableau? Why Visualization? o Difference B/W Tableau & Traditional BI tools o Levelsetting - Terminology o Getting started – Some pow erfulvisualizations quickly o The Tableau product line. Getting Started o Tutorial: Get Started in Tableau Desktop o Open Tableau and Connect to Data o Step-by-Step: Explore Data w ith Tableau o Create a Scatter Plot w ith Show Me o Create a Line Chart w ith Show Me o Save your Work Tour the Tableau Environment o Start Page o Data Source Page o The Tableau Workspace The Side Bar: Data and Analytics Shelves and Cards Parts of the View Workbooks and Sheets Files and Folders Status Bar Tooltips o Reorganize your Workspace o Language and Locale Tableau Concepts o Data Types o Field Types Dimensions and Measures Continuous and Discrete Convert Fields Betw een Discrete and Continuous o Tableau's Order of Operations o Understanding Data Fields o Aggregations Connect to Your Data o Run Initial SQL o Create a Data Source w ith Clipboard Data Set Up Data Sources o Join Your Data o Blend Your Data o Union Your Data o Connect to a Custom SQL Query o Use a Stored Procedure o Pivot Data from Columns to Row s o Split a Field into Multiple Fields o Filter Data fromData Sources o Extract Data Manage Data Sources o Edit Data Sources o Refresh Data Sources o Replace Data Sources o Export Data Sources o Upgrade Data Sources o Close Data Sources Build Data Views o Drag Fields o Sorting o Groups o Sets o Annotations and Mark Labels o Inspecting Data o Multidimensional Hierarchies Drill Dow n and Up in a Hierarchy Perfect Pivoting Define Unique Values Utility Dimensions o Work w ith Large Views o Add to Sheet: Double-Click o Show Me o Create Bins froma Continuous Measure o Missing Values o Using Multiple Measures Work with Time o Date and Time Fields o Forecasting o Trend Lines Filter Data From Your Views o Apply Filters to Multiple Worksheets o Filter Data Across Multiple Data Sources o Improve Performance w ith Context Filters o Create Slicing Filters
- 2. Tableau 10.x Build and Use Maps o Create Tableau Maps fromShapefiles o Custom Geocode Your Data o Custom Geocoding vs Data Blending o Example–Blend Geographic Data o Create a schema.ini File o Prepare Your Geographic Fields o Build a Map View o Edit Locations o Customize How Your Map Looks o Create Territories on a Map o Customize How People Interact w ith your Map o Use WMS Servers o Use Mapbox Maps o Explore Data in Maps o Search for Locations in Your Map o Measure Distances Betw een Data Points and Locations in a Map o Save a Map Source o Import a Map Source o Select Background Maps o Map Storing Advanced Analysis o Calculated Fields o TransformValues w ith Table Calculations o Levelof Detail Expressions o Find Clusters in Data o Percentages o Reference Lines, Bands, Distributions, and Boxes o Totals o Parameters o Background Images o Log Axes Present Your Work o Formatting o Actions o Dashboards Best Practices for Effective Dashboards Create a Dashboard Create Dashboard Device Layouts Refine Your Dashboard Tiled and Floating Layouts o Stories The Story Workspace Create a Story Customize a Story Point Format a Story Update a Story Present a Story Publish Data Sources and Workbooks o Control Who Can See What in Your Published View s Create a User Filter and Apply it in a View Create a User Filter Based on a Field in Your Data o Sign in to Tableau Server or Online o Publish a Data Source o Publish a Workbook o Set Permissions as You Publish a Data Source or Workbook o Set Credentials for Accessing YourPublished Data o Schedule Extract Refreshes as You Publish a Workbook o Save Workbooks to Tableau Public o Open Workbooks from the Server Save, Export, or Print o Saving Your Work o Reverting Workbooks o Exporting Your Work o Exporting the Data Source o Copying Information Betw een Workbooks o Print