Download to read offline

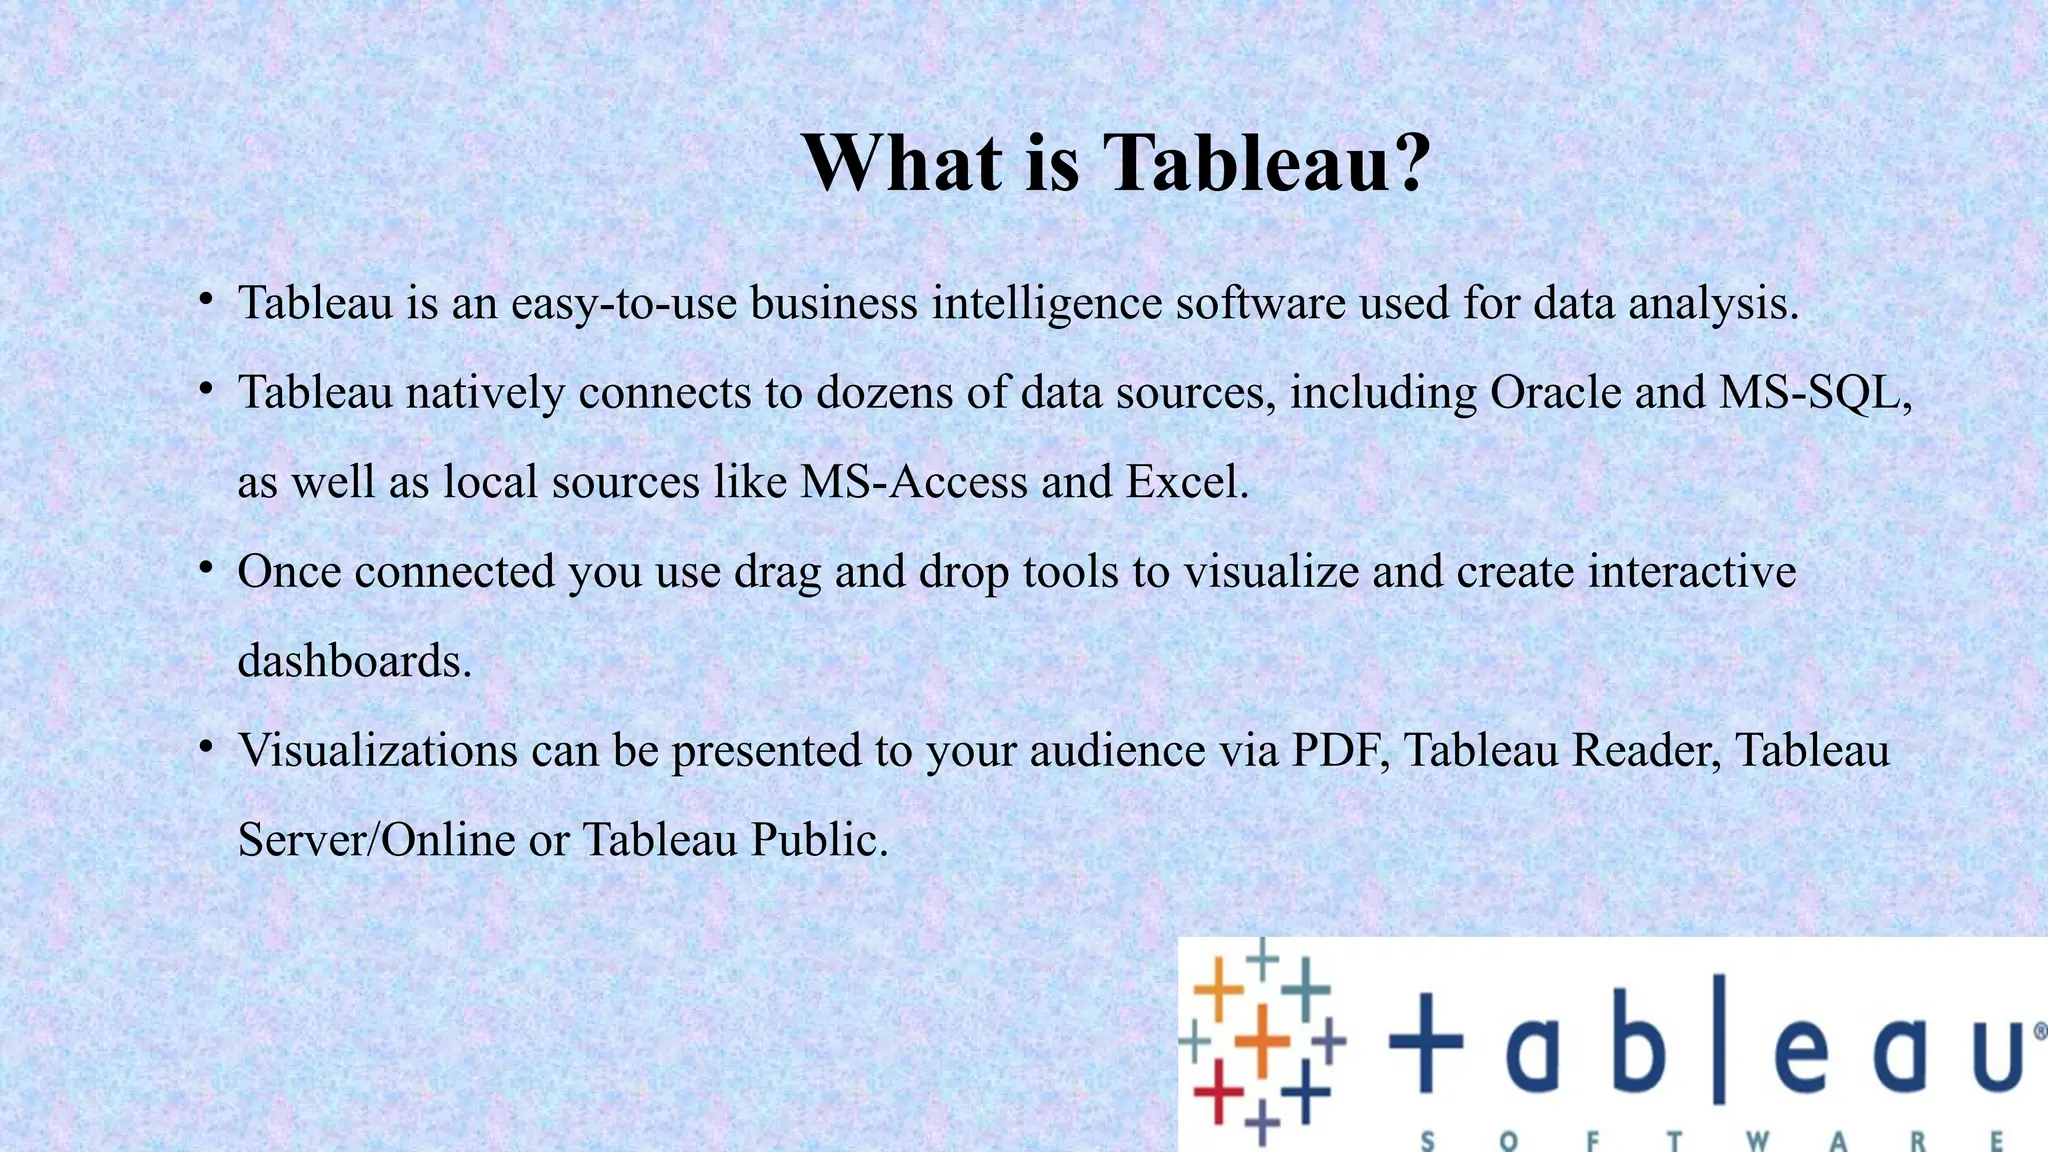
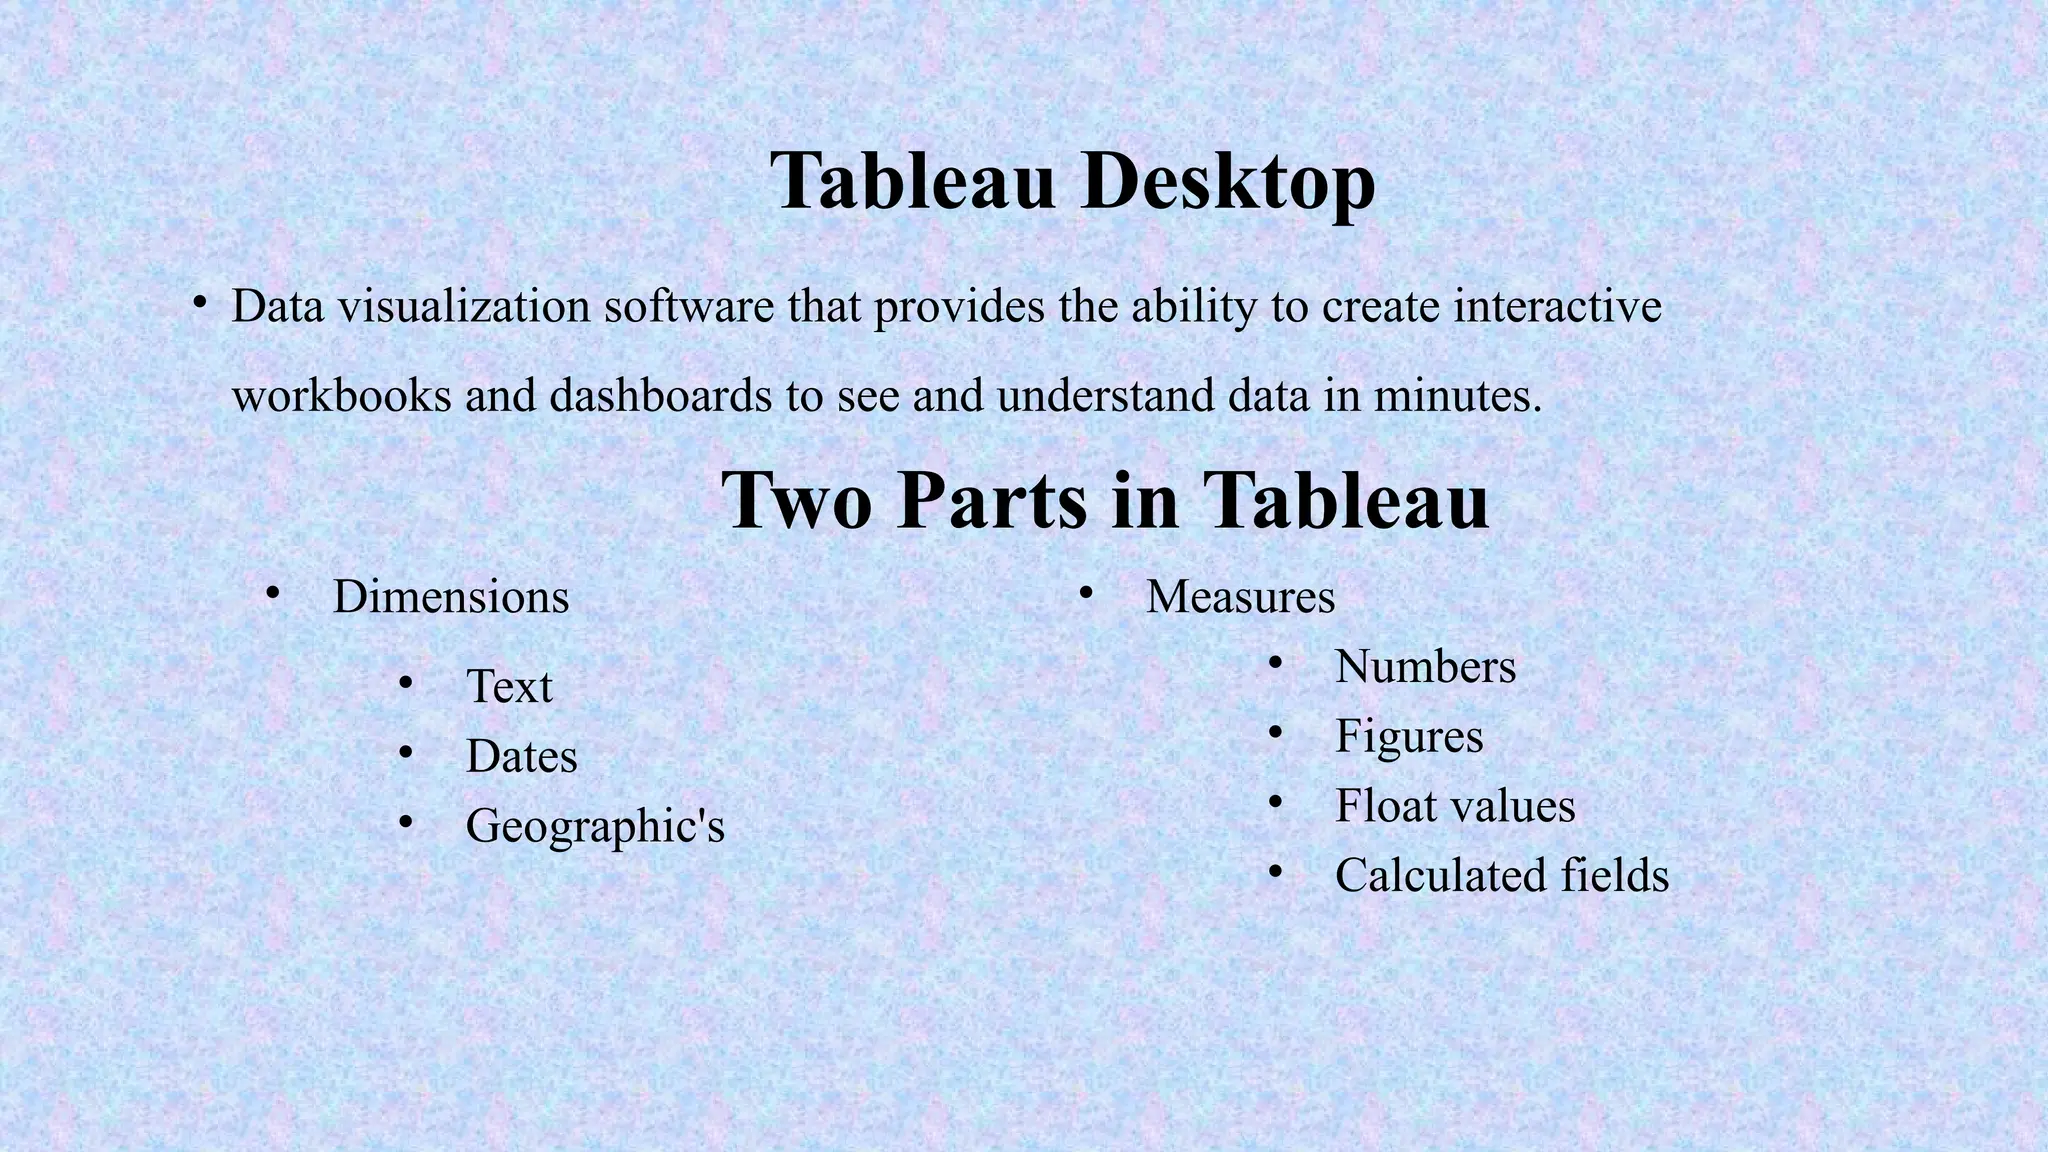
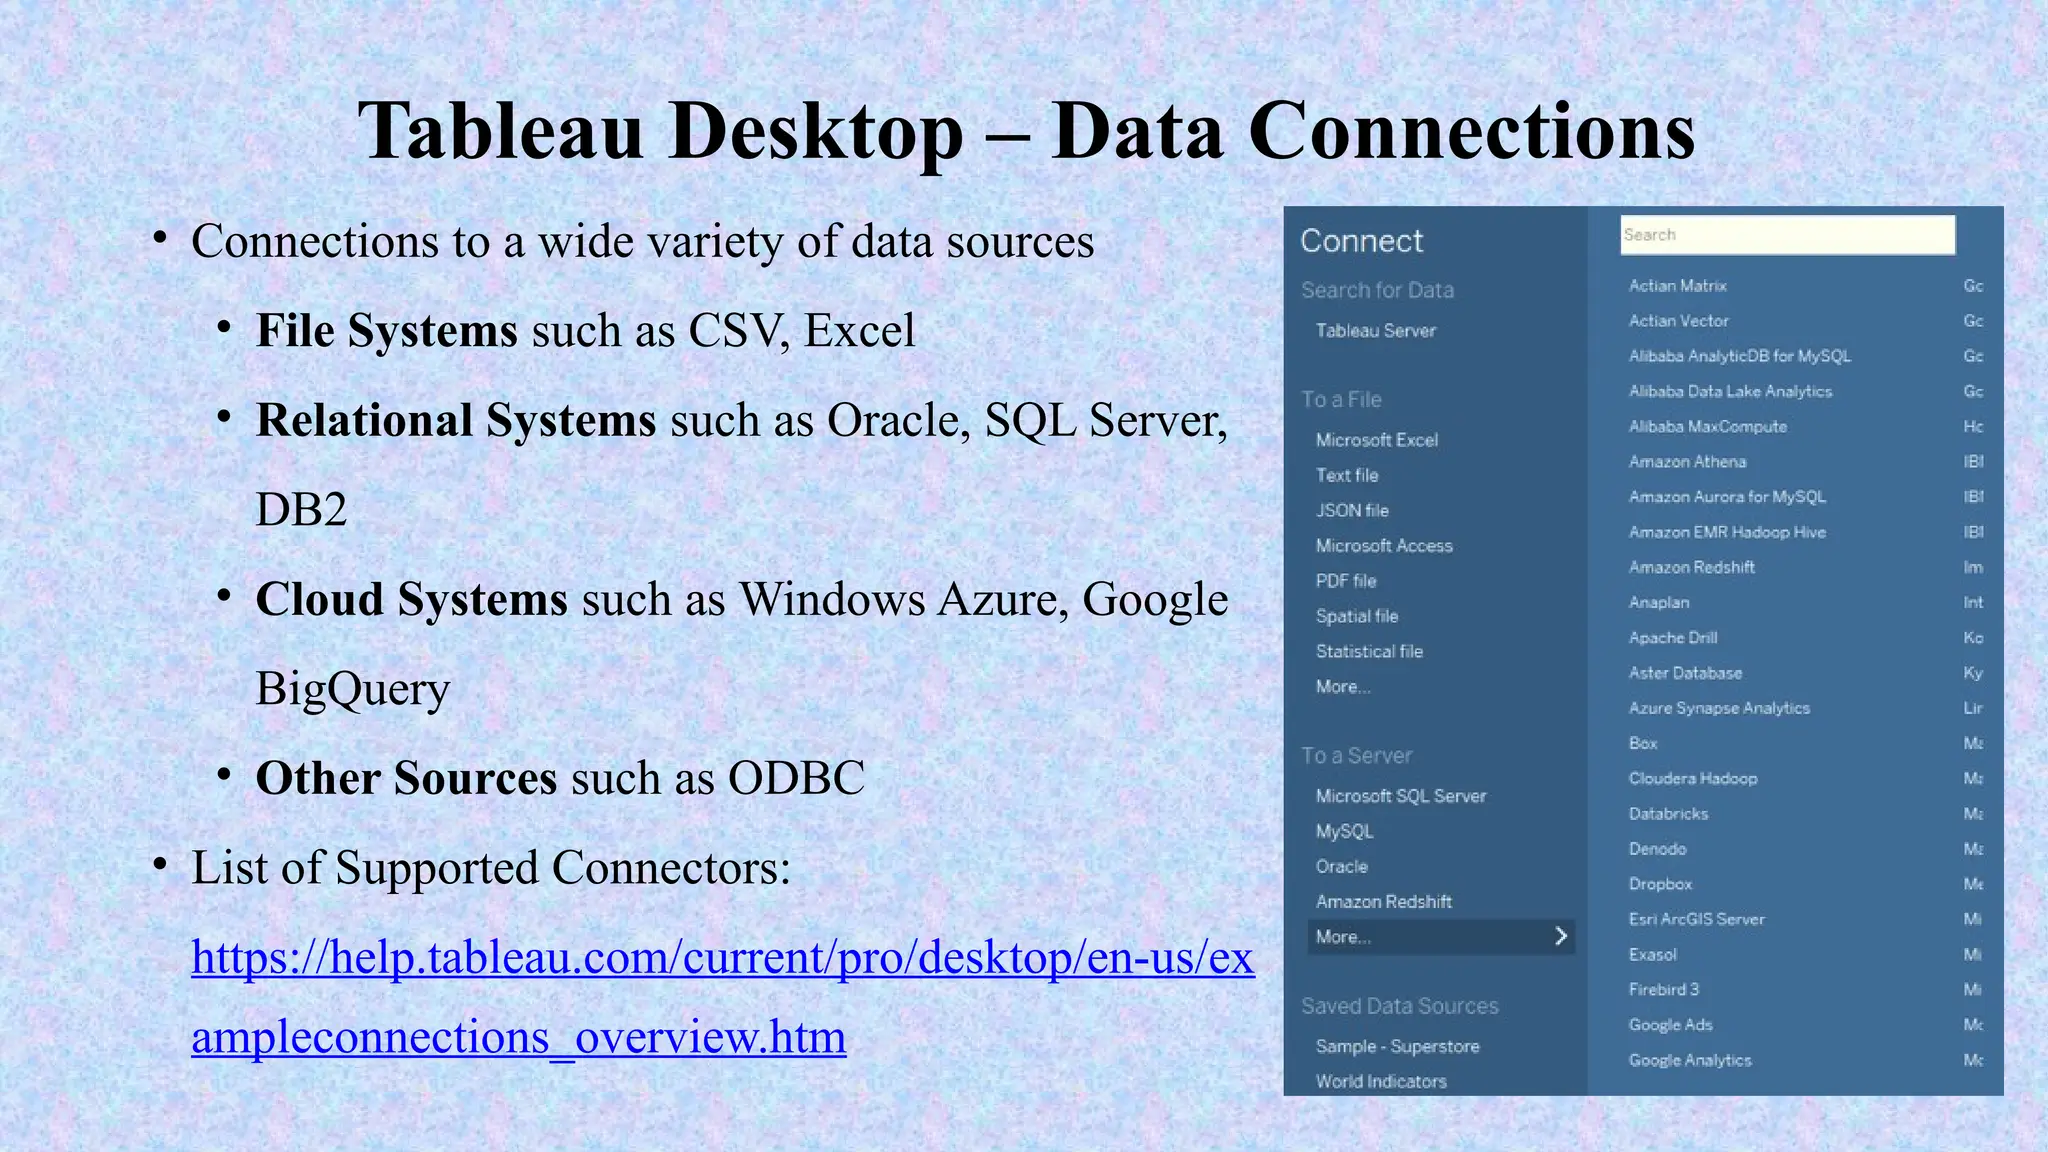
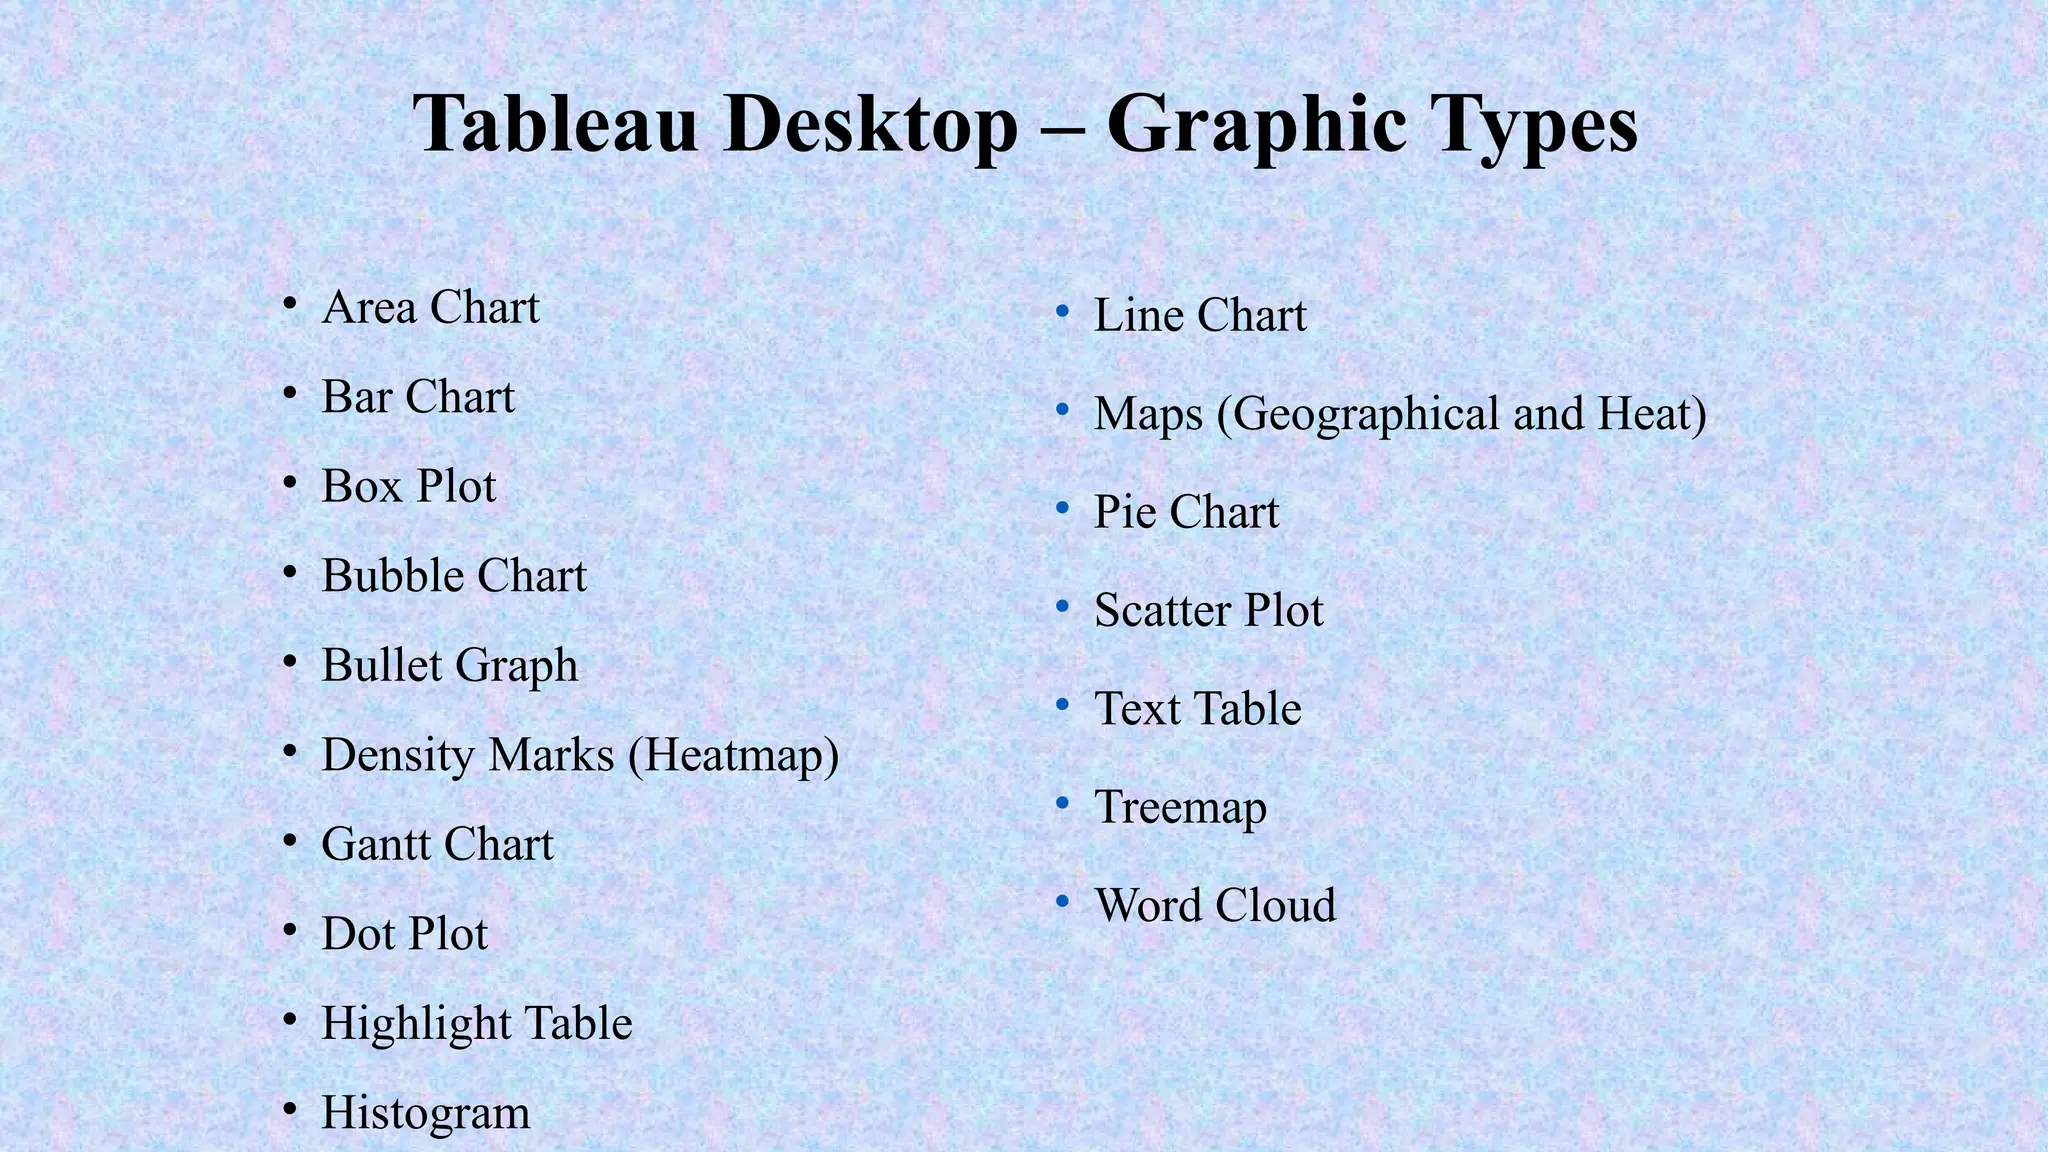
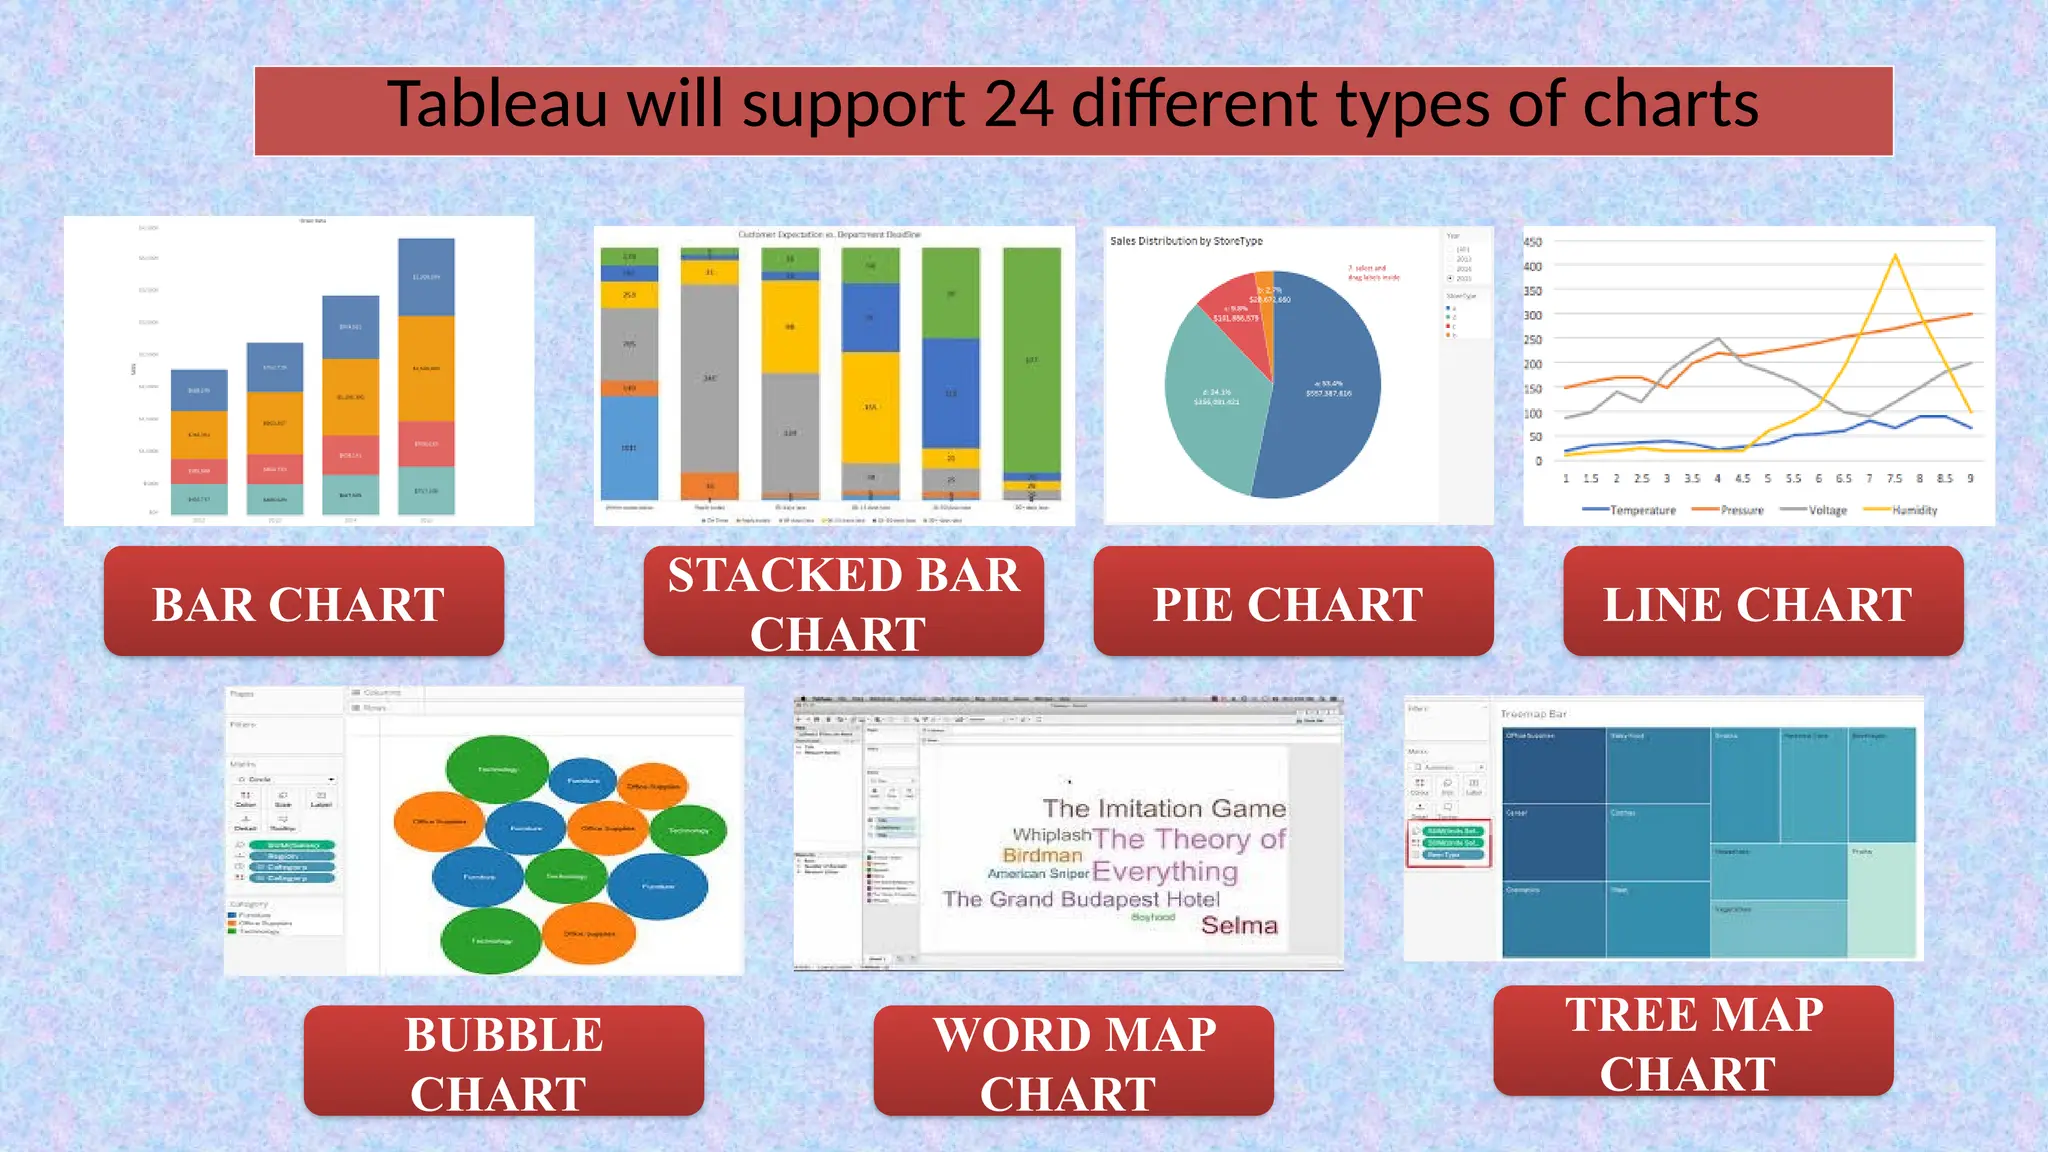
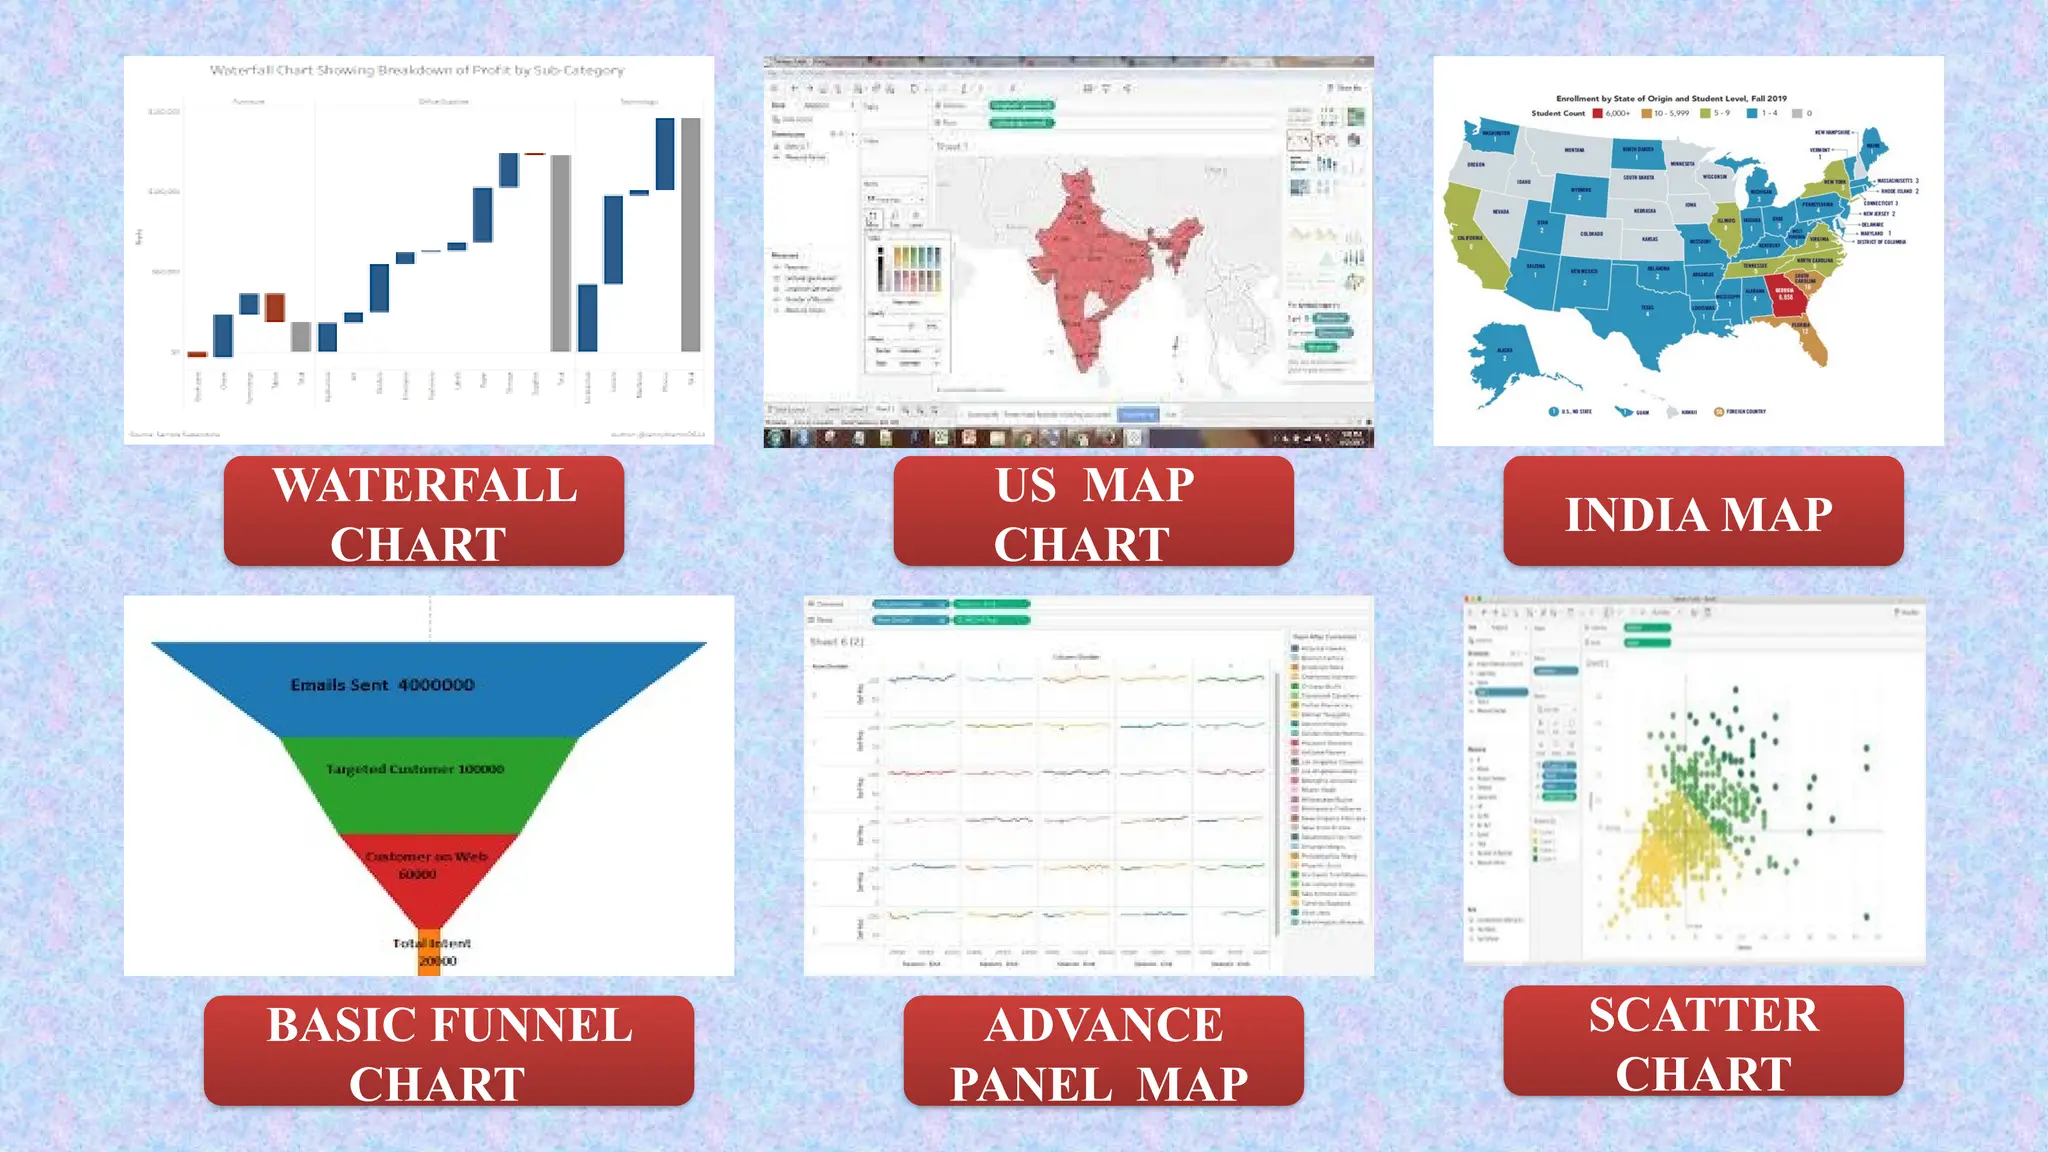
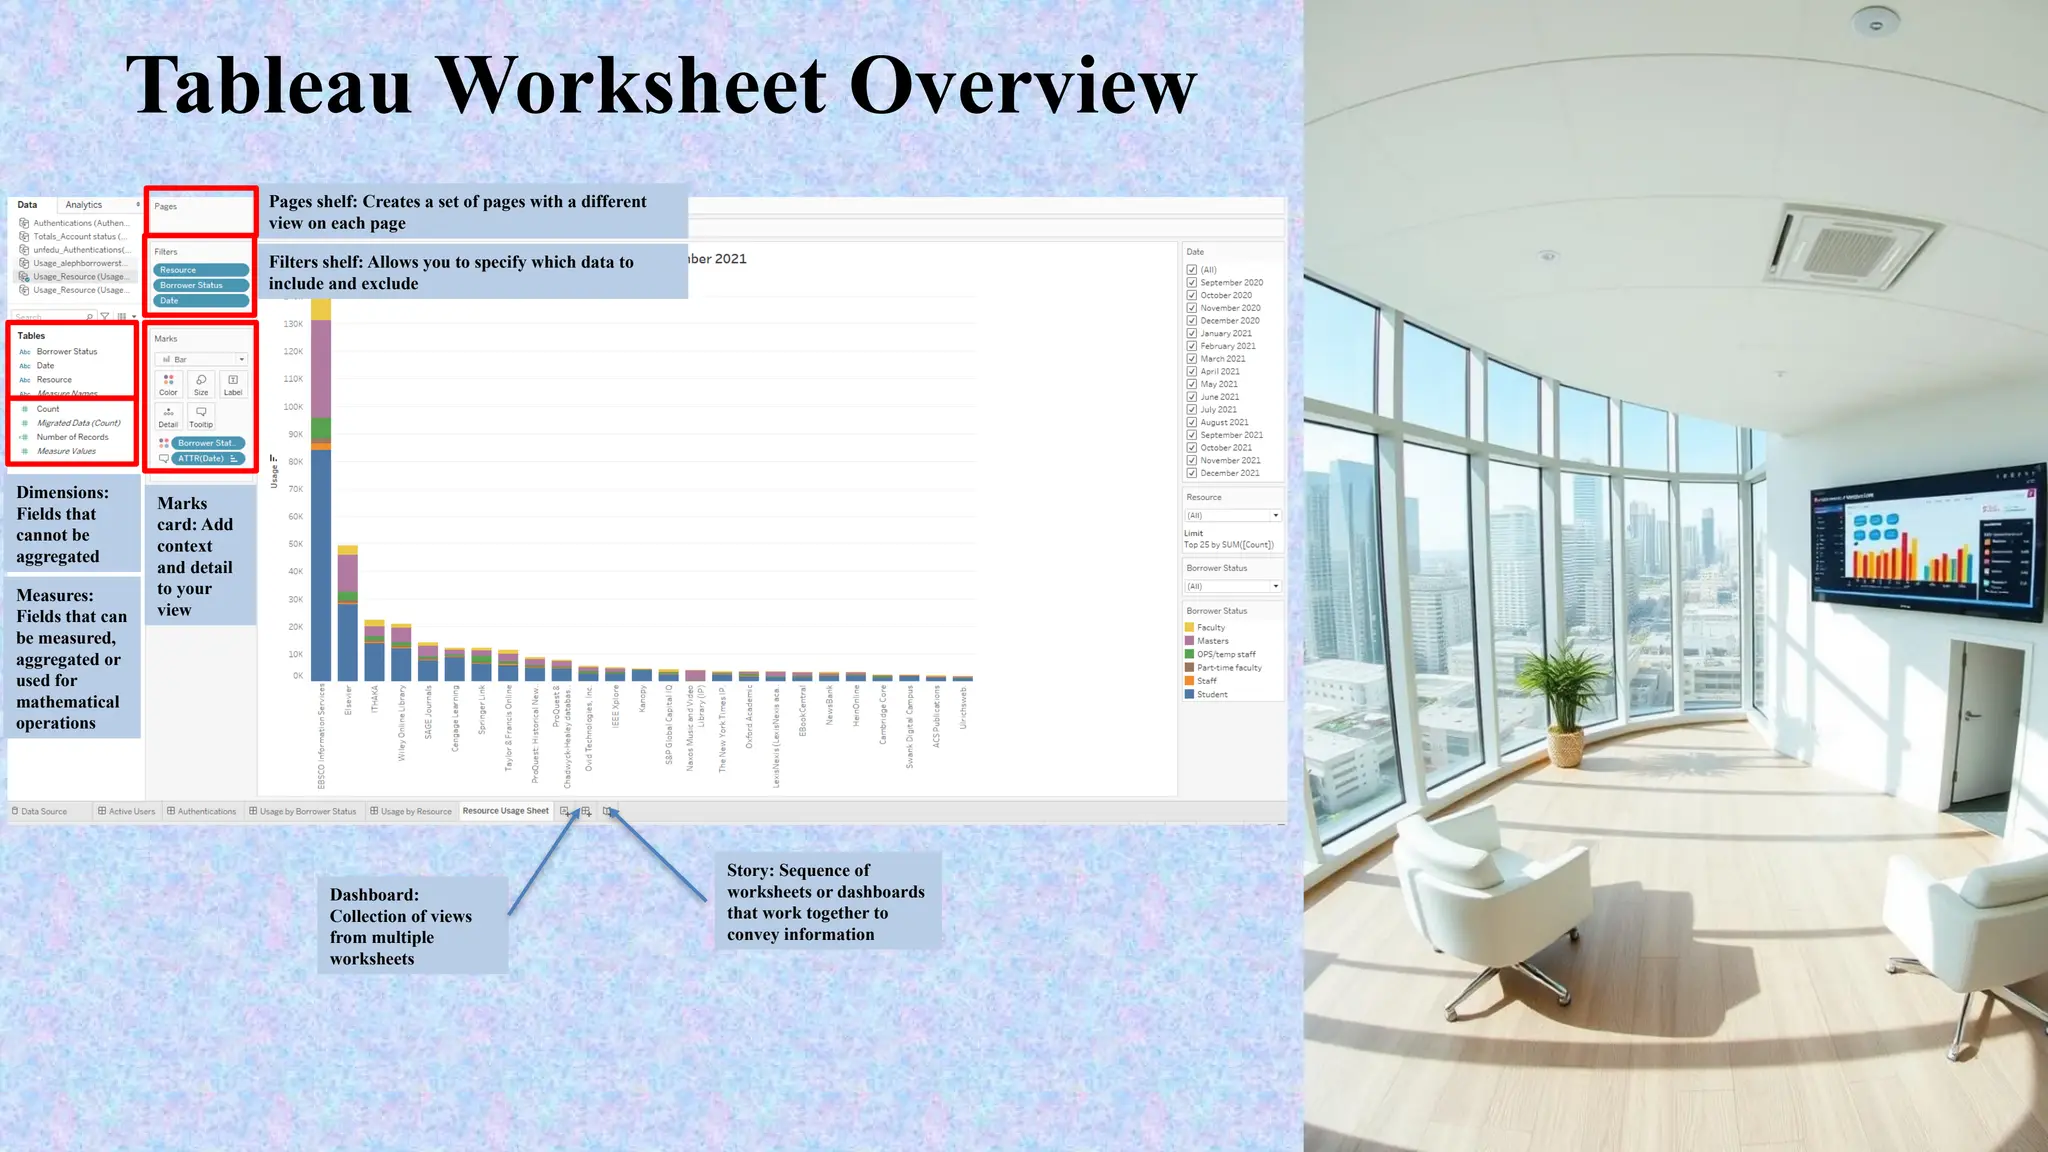
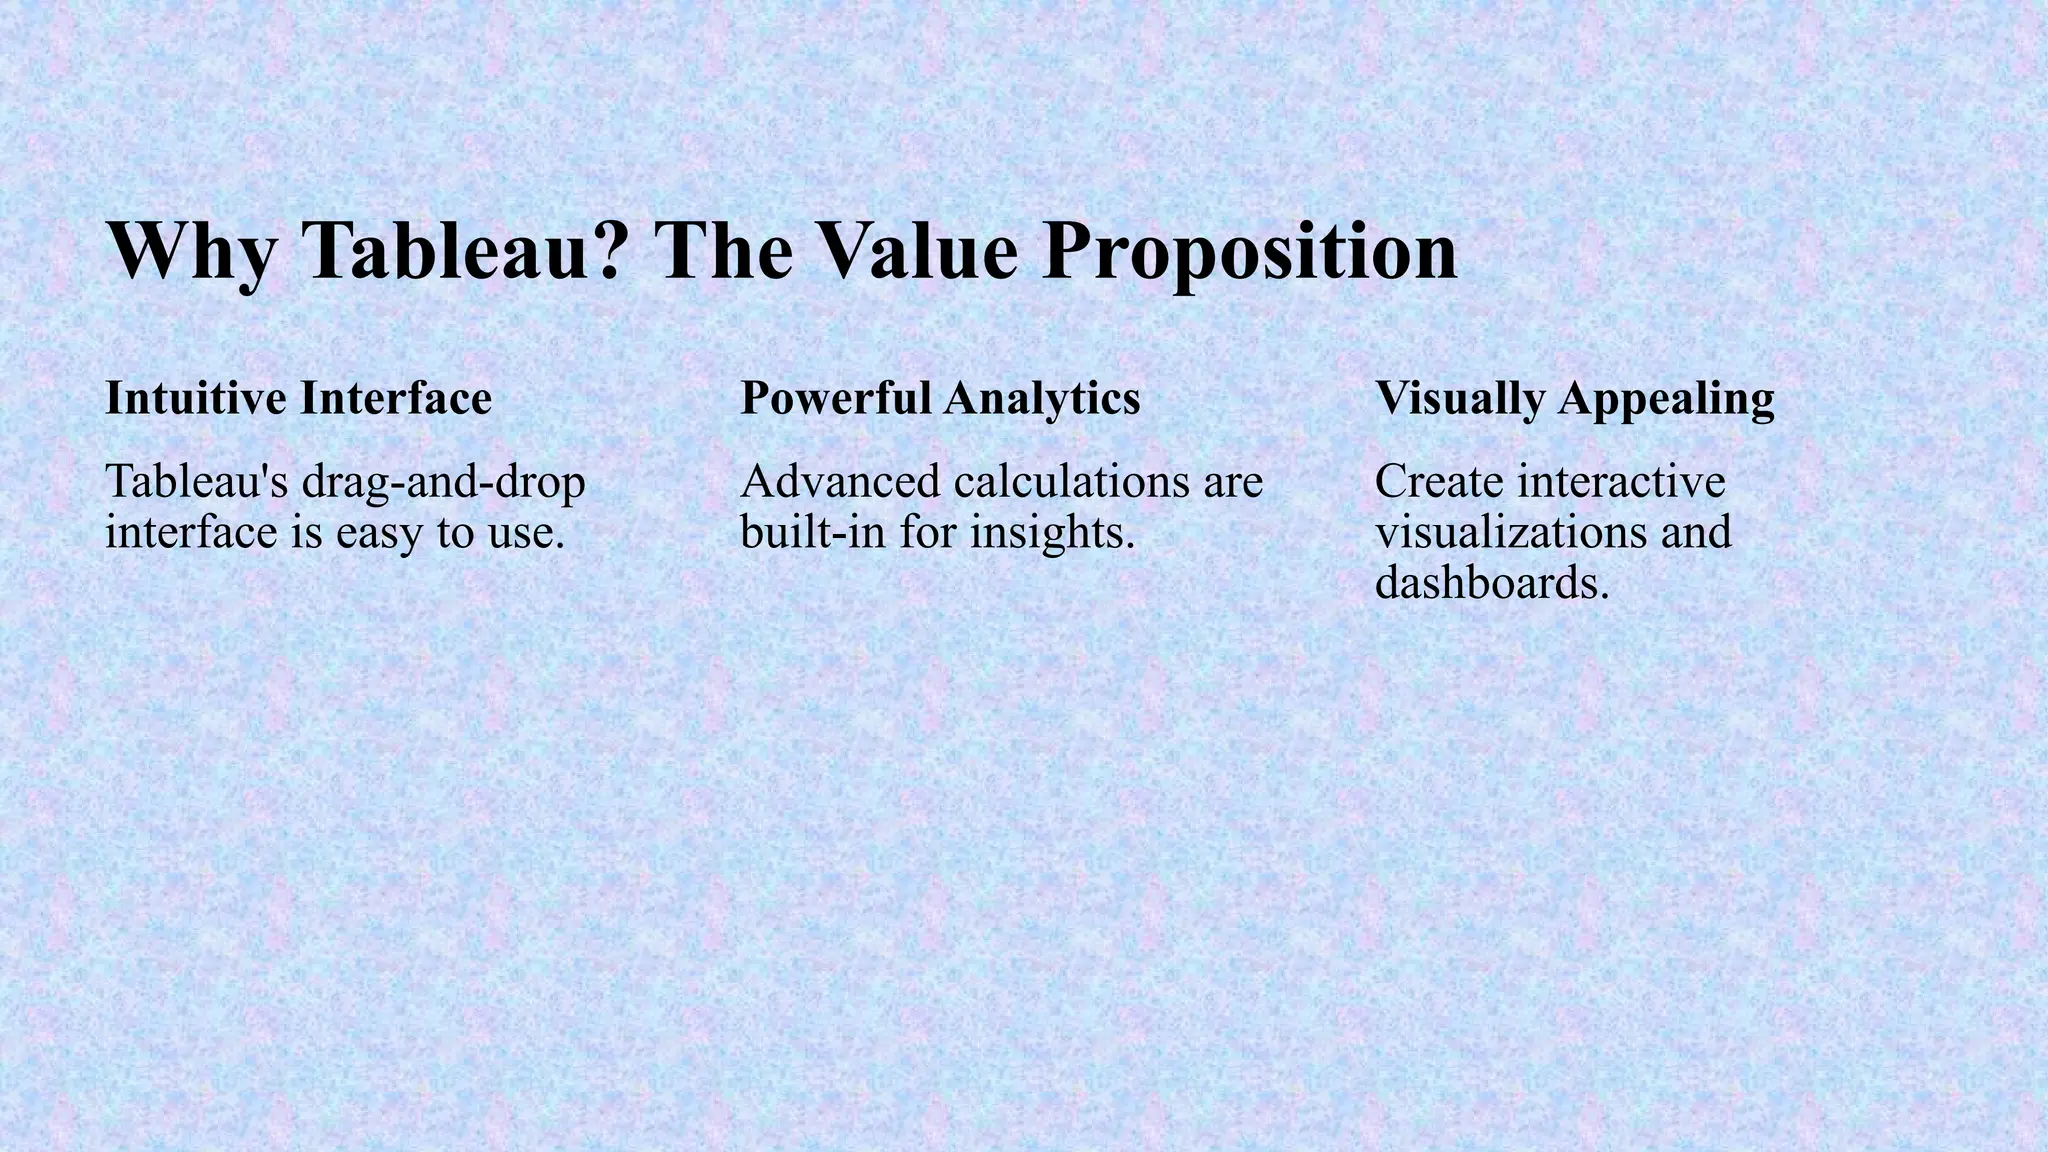
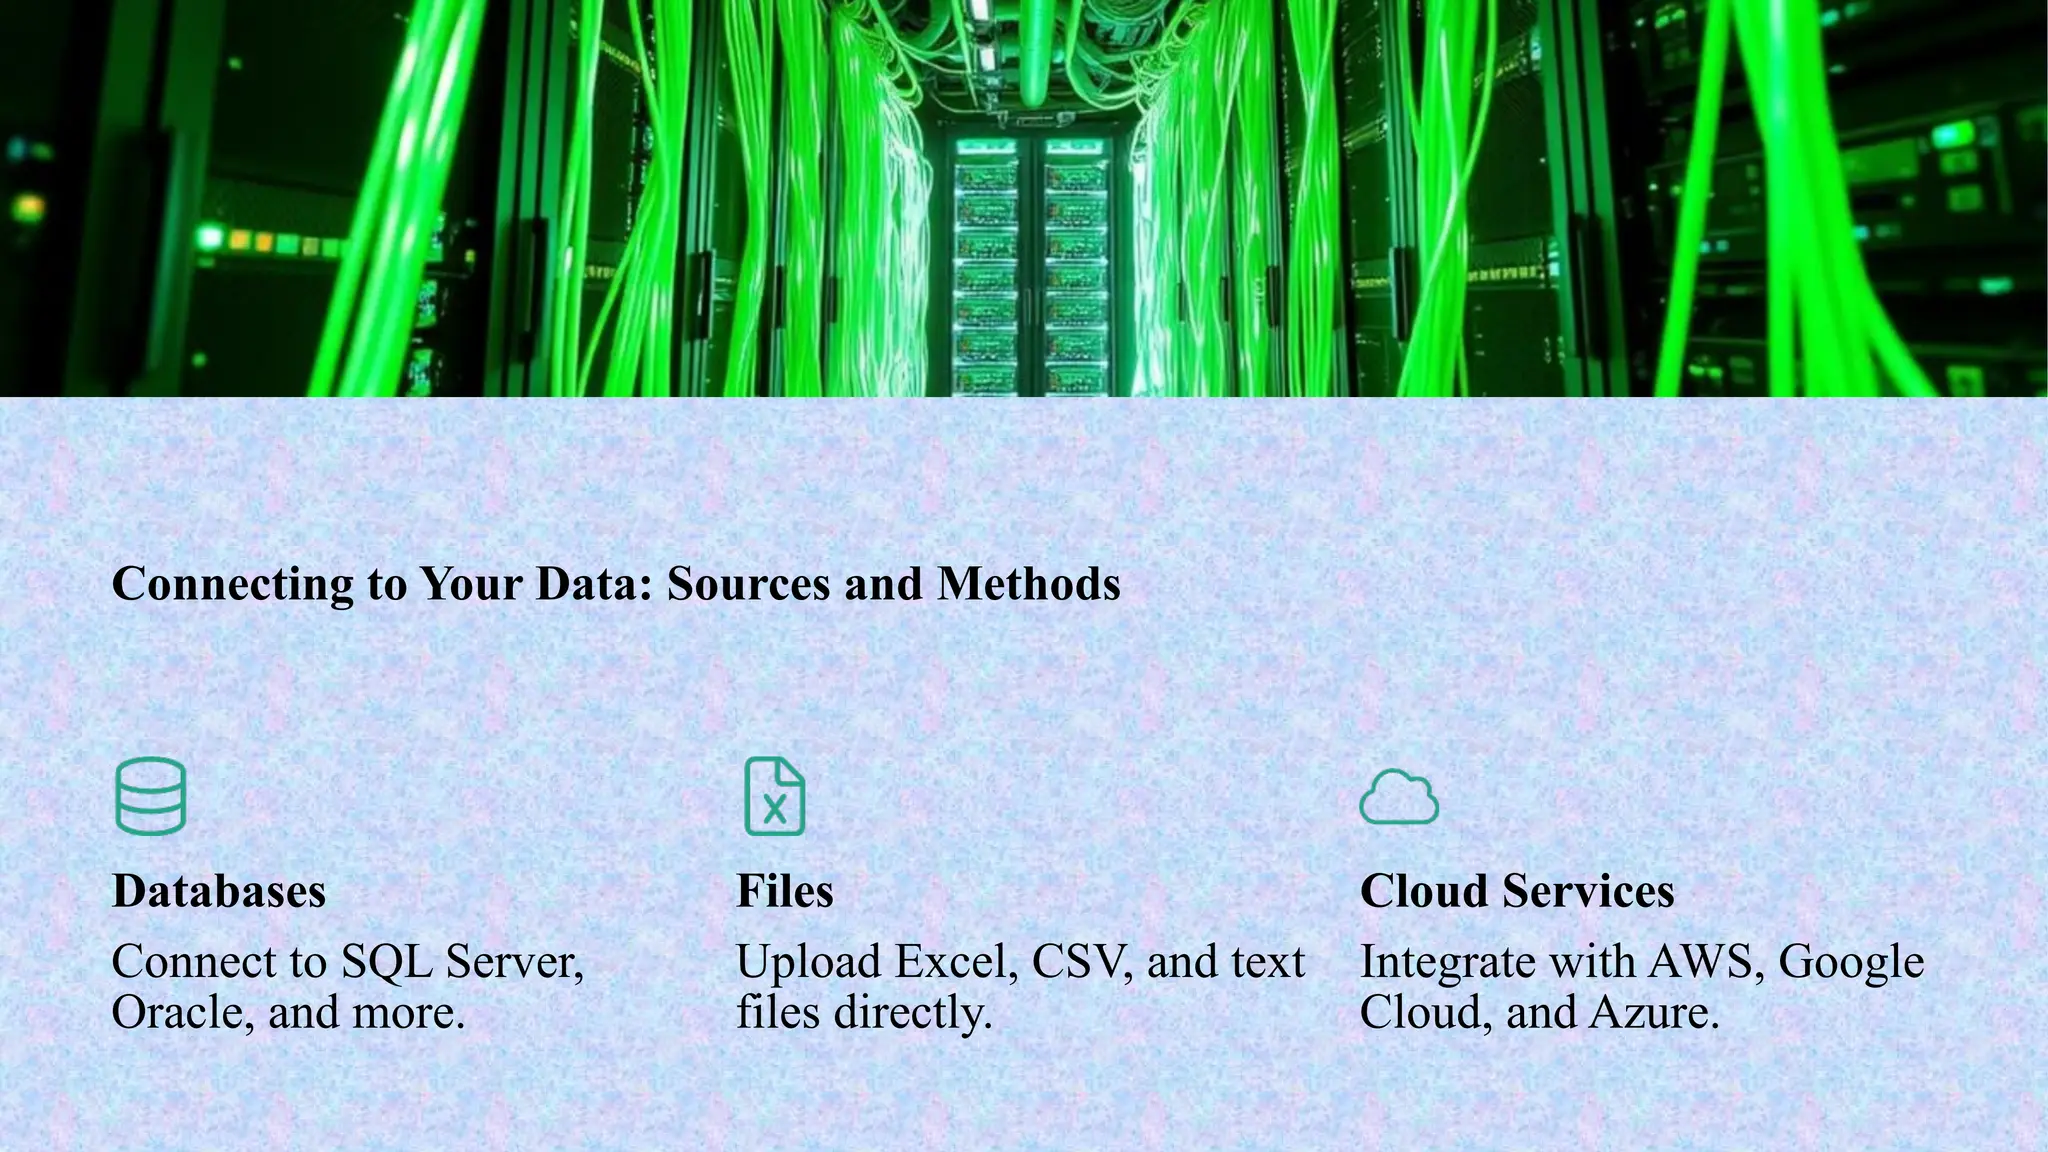
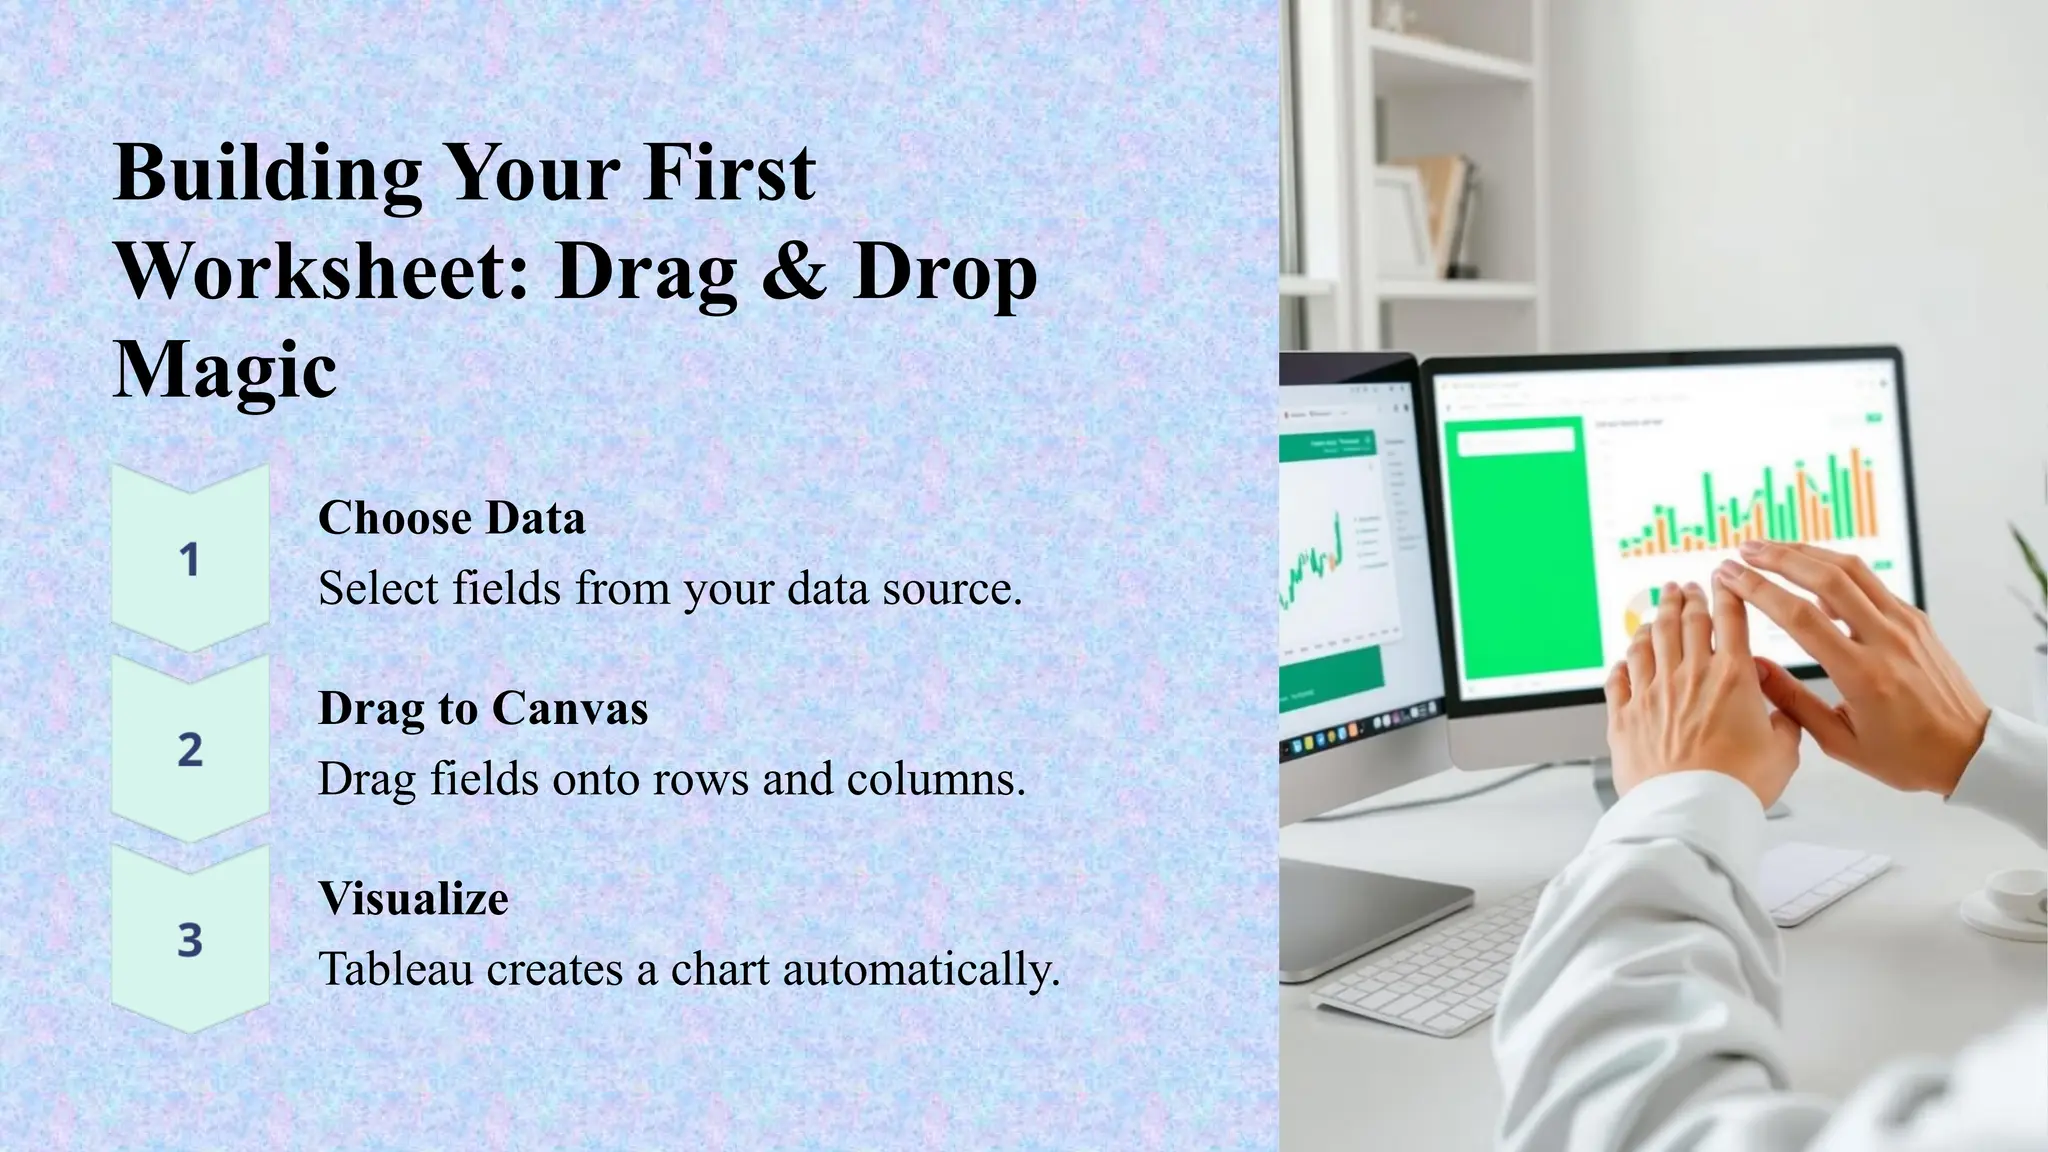
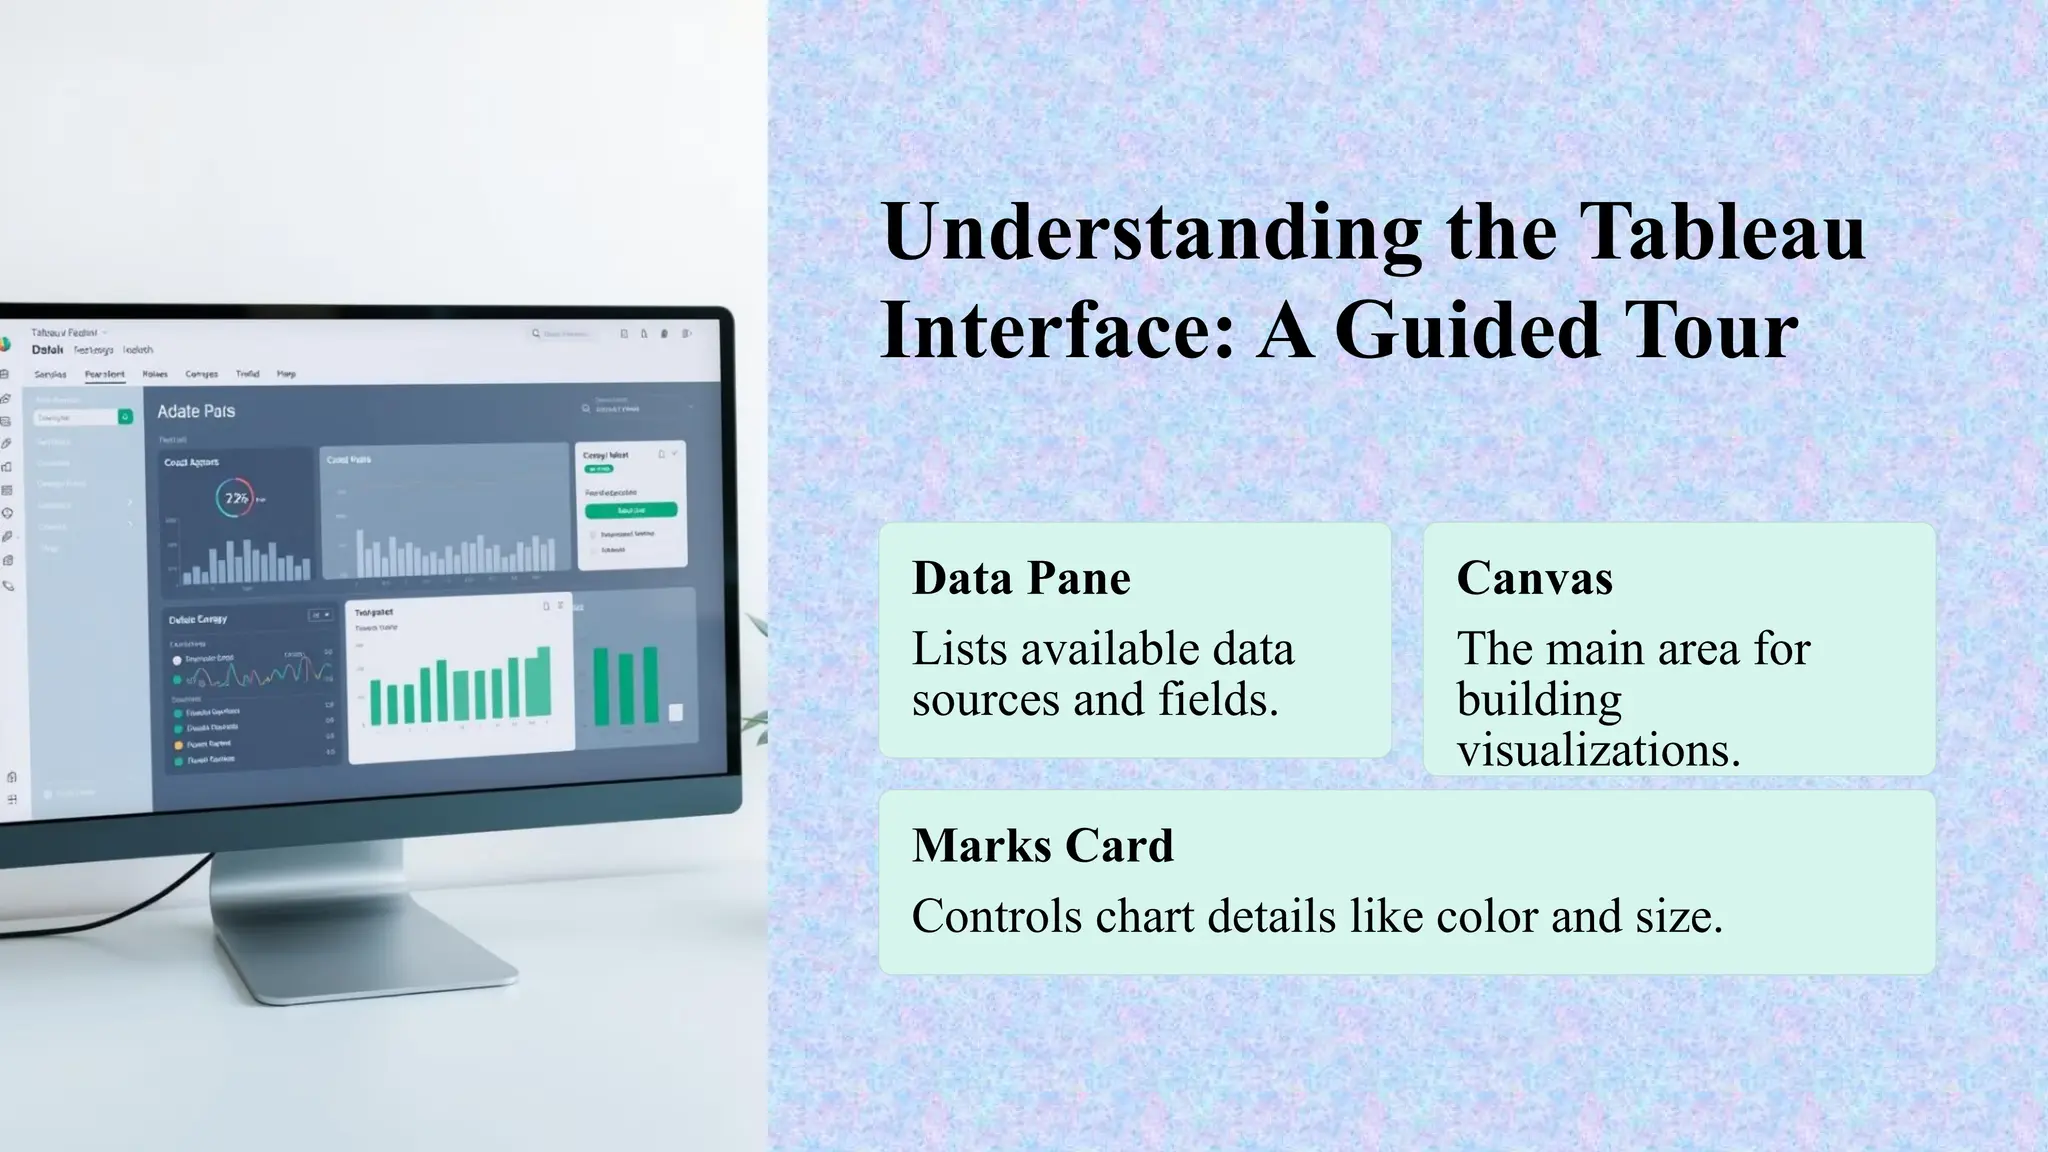

Tableau is a powerful tool used for data analysis and visualization. It allows the creation of amazing and interactive visualization and that too without coding. Tableau is very famous as it can take in data and produce the required data visualization output in a very short time. Basically, it can elevate your data into insights that can be used to drive your action in the future.