Downloaded 16 times

![{
return CallNextHookEx(g_hhook, code, wParam, lParam)
}
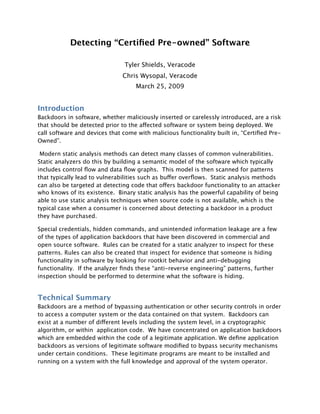
Windows Userland Rootkits
Windows userland based rootkits target the hooking and modification of processes in
ring three. By not having a requirement to go to a lower operating level, such as ring
one, these are the simplest forms of rootkit technologies that can be implemented.
Static detection of userland process modifications target specific sequences of calls
that are indicative of the existence of a hooking utility or rootkit. Each method below
outlines the API calls that should be identified and flagged on when using a static
analysis engine for the detection of these types of activities.
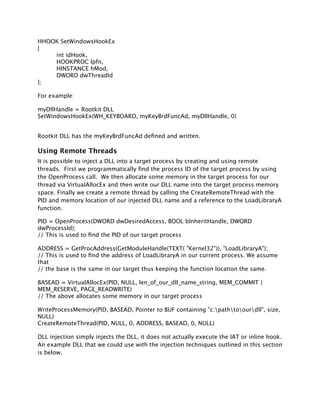
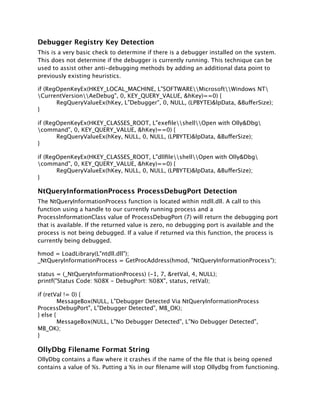
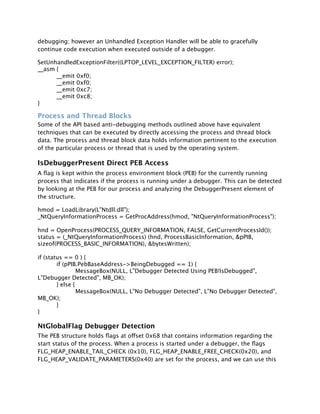
IAT Hooking
IAT hooking is the modification of the Import Address Table for a binary that has been
loaded into memory. This is typically done by injecting a DLL into the running process
and executing the IAT modification code in the context of the target process. The code
first locates the IAT table within the loaded image by using the following reference:
(IMAGE_DOS_HEADER->e_lfanew)->OptionalHeader-
>DataDirectory[IMAGE_DIRECTORY_ENTRY_IMPORT]
// This is using the image base as a starting reference point and the other values as
offsets.
Once the reference to the IAT is discovered, code is used to walk the IAT table entries
until the entry that matches the function we would like to patch is discovered. At this
point we execute the following code to unlock the memory protections of the segment
of memory we will be modifying, overwrite the target function pointer, and then revert
the memory protections that were originally in place.
/* Unlock read only memory protection */
VirtualProtect((LPVOID)(&pIteratingIAT-
>u1.Function),sizeof(DWORD),PAGE_EXECUTE_READWRITE,&dwProtect);
/* OVERWRITE API address! :) */
(DWORD*)pIteratingIAT->u1.Function = (DWORD*)pApiNew;
/* Restore previous memory protection */
VirtualProtect((LPVOID)(&pIteratingIAT-
>u1.Function),sizeof(DWORD),dwNewProtect,&dwProtect);
To detect IAT hooking we should identify any reference to the IAT structure noted
above that is followed by memory unprotect, write, and re-protect code. Alternate
code to unprotect and re-protect memory is demonstrated within the SSDT hooking
portion of this document. This is interchangeable with the above VirtualProtect, write,](https://image.slidesharecdn.com/blackhat-europe-2009-wysopal-certified-pre-owned-1-00-wp-111004123138-phpapp01/85/Blackhat-Europe-2009-Detecting-Certified-Pre-Owned-Software-7-320.jpg)
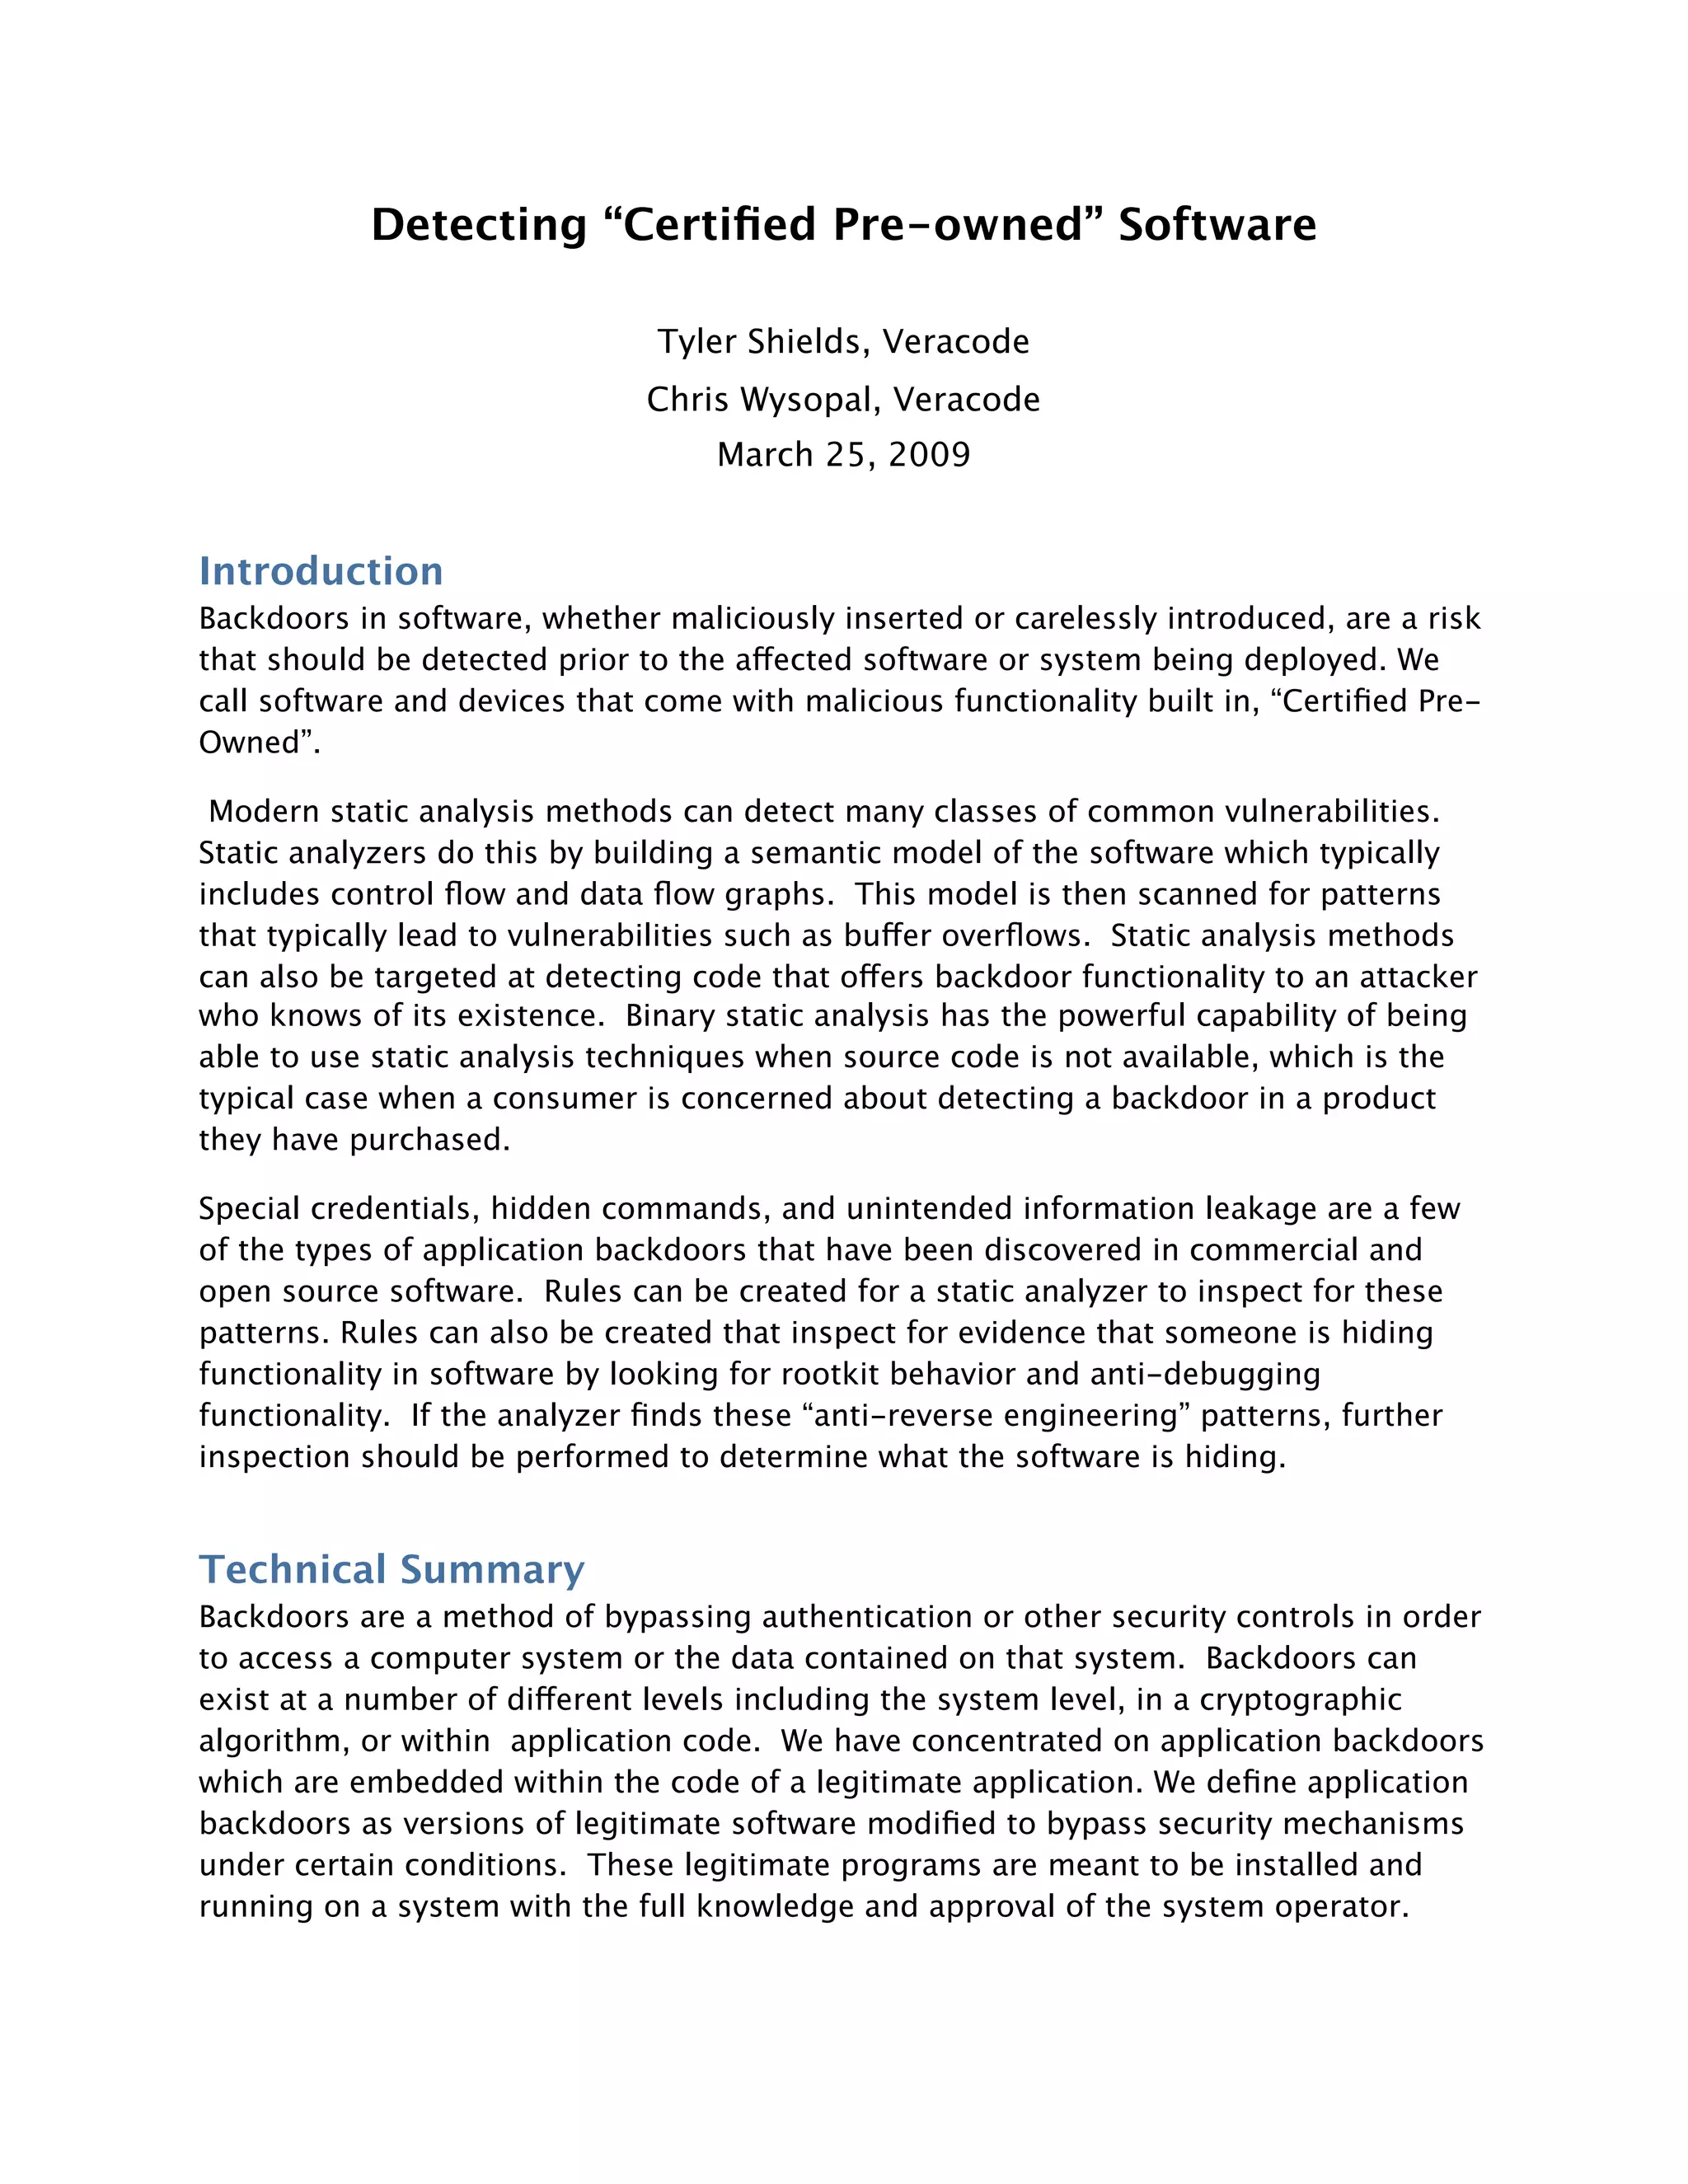
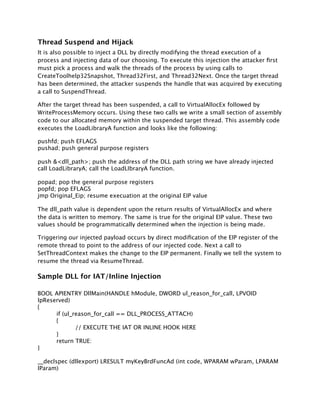
![VirtualProtect method above. Static analysis should check for both moethods in all
places where one is used.
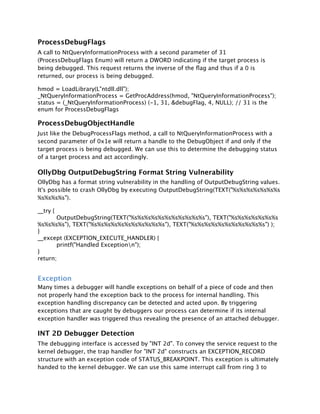
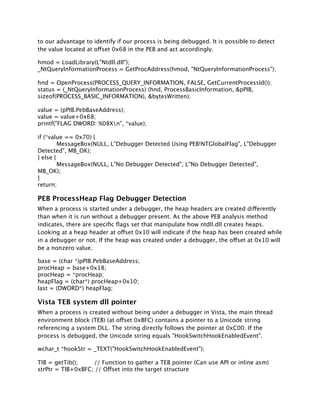
Inline Function Hooking (Runtime Patching)
Runtime patching is the modification of the function to be called directly in memory. By
runtime patching an exported library call, the execution of that call can be subverted
and arbitrary code of our choosing executed in its place. Runtime patching modifies
the first bytes of the destination function, typically with a jmp instruction, while saving
the original bytes for later use. The first bytes of the target function are modified to
jmp to a function of our choosing within our injected DLL. Upon completion of the
rerouted function, we call the saved bytes and execute a jmp back to the subverted
function plus the appropriate offset of our injected bytes.
The most direct method of detection for this type of rootkit activity is to check for the
existence of a function that is declared (naked), meaning no epilog and prolog will
exist around the function, which ends in a jmp statement. Standard functions will have
epilog and prolog data surrounding the function within the disassembly; however to be
able to properly insert our function we would have to end the function without a prolog
and on a jmp statement such that the function would properly return to the original
hijacked function call.
__declspec(naked) my_function_detour_ntdeviceiocontrolfile()
{
__asm
{
//exec missing instructions
push ebp
mov ebp, esp
push 0x01
push dword prt [ebp+0x2c]
// do anything we want here
// end on a jmp statement to jump back to the original
// functionality. The address is stamped in later by the rootkit
_emit 0xEA
_emit 0xAA
_emit 0xAA
_emit 0xAA
_emit 0xAA
_emit 0x08
_emit 0x00
}
}
As a point of interest, it should be noted that this is the same method that the
Microsoft Detours API package utilizes when creating its inline hooks. This type of
detection should work against the MS Detours API by default.](https://image.slidesharecdn.com/blackhat-europe-2009-wysopal-certified-pre-owned-1-00-wp-111004123138-phpapp01/85/Blackhat-Europe-2009-Detecting-Certified-Pre-Owned-Software-8-320.jpg)
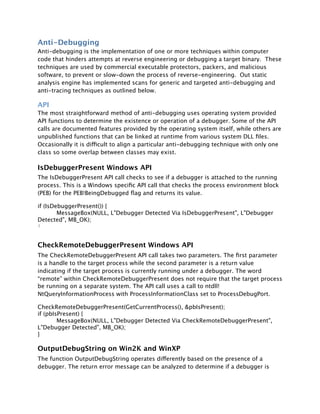


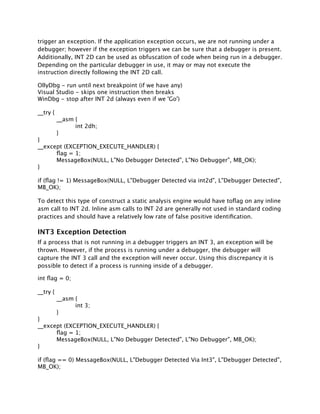
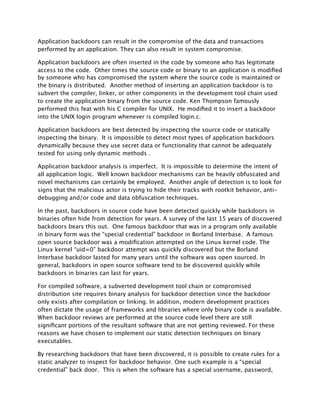
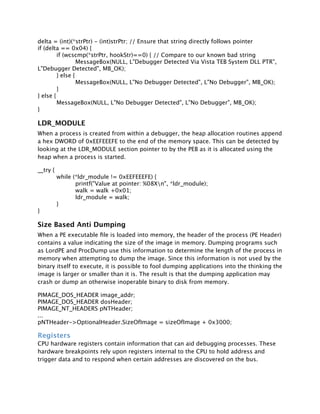
![Single Step Detection
If the Trap Flag is set within the thread context, the SEH will be called prior to the
instruction occurring. By enabling the Trap Flag we can detect the presence of the SEH
being fired to accurately determine if the process is running under a debugger.
//Set the trap flag
__try {
__asm {
PUSHFD; //Saves the flag registers
OR BYTE PTR[ESP+1], 1; // Sets the Trap Flag in EFlags
POPFD; //Restore the flag registers
NOP; // NOP
}
}
OllyDbg Memory Breakpoint Detection
OllyDBG interprets PAGE_GUARD as a Memory break-point. Thus if we execute a
PAGE_GUARDED page a code exception will occur. If the debugger is present it will trap
this as a break point and continue executing code after it. If there is no debugger
present we will catch the exception in code and handle it appropriately via the SEH.
memRegion = VirtualAlloc(NULL, 0x10000, MEM_COMMIT, PAGE_READWRITE);
RtlFillMemory(memRegion, 0x10, 0xC3);
success = VirtualProtect(memRegion, 0x10, PAGE_EXECUTE_READ | PAGE_GUARD,
&oldProt);
myproc = (FARPROC) memRegion;
success = 1;
__try {
myproc();
}
__except (EXCEPTION_EXECUTE_HANDLER) {
success = 0;
MessageBox(NULL, L"No Debugger Detected", L"No Debugger Detected",
MB_OK);
}
Ctrl-C Vectored Exception Handling
When a console program is being debugged, a Ctrl-C command will throw an
exception that can be trapped by a vectored exception handler. If the program is not
being debugged, no exception is thrown and only a signal handler will be called. We
can detect this by registering both a signal handler for Ctrl-C as well as a vectored
exception handler. If the exception handler is triggered we are running under a](https://image.slidesharecdn.com/blackhat-europe-2009-wysopal-certified-pre-owned-1-00-wp-111004123138-phpapp01/85/Blackhat-Europe-2009-Detecting-Certified-Pre-Owned-Software-16-320.jpg)
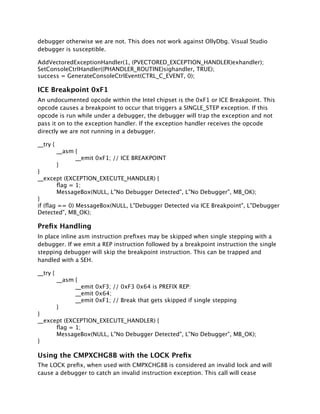
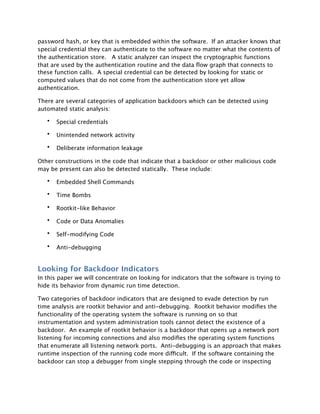
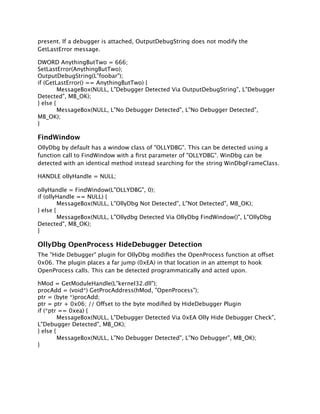
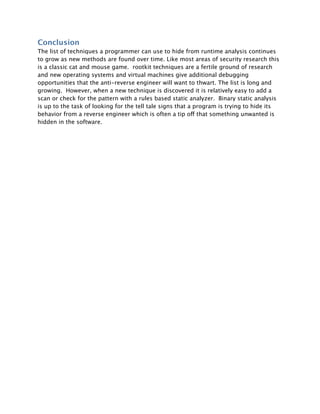
![Hardware Breakpoint Detection
There are two different types of breakpoints, software and hardware breakpoints. When
a hardware breakpoint is set the CPU debug registers are used to hold the specific
breakpoint information. DR0-DR3 holds the address that is used to break the program
execution while DR7 holds context information about the breakpoints in DR0-DR3. We
can access these debug registers via the GetThreadContext() function and determine if
hardware breakpoints have been set and act accordingly.
hnd = GetCurrentThread();
status = GetThreadContext(hnd, &ctx);
if ((ctx.Dr0 != 0x00) || (ctx.Dr1 != 0x00) || (ctx.Dr2 != 0x00) || (ctx.Dr3 != 0x00) ||
(ctx.Dr6 != 0x00) || (ctx.Dr7 != 0x00))
{
MessageBox(NULL, L"Debugger Detected Via DRx Modification/Hardware
Breakpoint", L"Debugger Detected", MB_OK);
} else {
MessageBox(NULL, L"No Debugger Detected", L"No Debugger", MB_OK);
}
VMware Detection
Multiple techniques exist to detect if our process is running within an instance of
VMware. These techniques are based on the fact that some processor specific registers
can be accessed from user mode and will return the value that the host system is
storing in those registers. Due to this fact, the virtual machine must emulate those
registers and will return values that are different than the standard values stored by
the host operating system. IDT and GDT values were originally used to detect the
presence of a virtual machine but due to the advent of multiple processors they
became less accurate. However, checks against the LDT register are impervious to
multiple processor differences. As such it is possible to reference this register from
code and accurately determine if we are running under an instance of VMware. If the
return value for the first and second bytes is not equal to zero we can be certain that
we are within a virtual machine.
__asm {
sldt ldt_info;
}
if ((ldt_info[0] != 0x00) && (ldt_info[1] != 0x00)) ldt_flag = 1;
Timing
Timing based anti-debugging methods are primarily used to detect single stepping
through a process. By surrounding sensitive code blocks with time states, or
alternatively conducting two time checks in succession, it is possible to determine the](https://image.slidesharecdn.com/blackhat-europe-2009-wysopal-certified-pre-owned-1-00-wp-111004123138-phpapp01/85/Blackhat-Europe-2009-Detecting-Certified-Pre-Owned-Software-21-320.jpg)


The document discusses detecting "certified pre-owned" software, or software containing backdoors. It describes how static analysis of software binaries can detect various types of application backdoors, including special credentials, unintended network activity, and deliberate information leakage. The document focuses on detecting indicators that software is trying to hide its behavior, such as rootkit behavior and anti-debugging techniques, through static analysis of the software code. Rules can be developed for static analyzers to inspect software for these types of backdoor behaviors and indicators.